
This article is based on publicly available IR materials and is not a recommendation to buy or sell any specific securities.
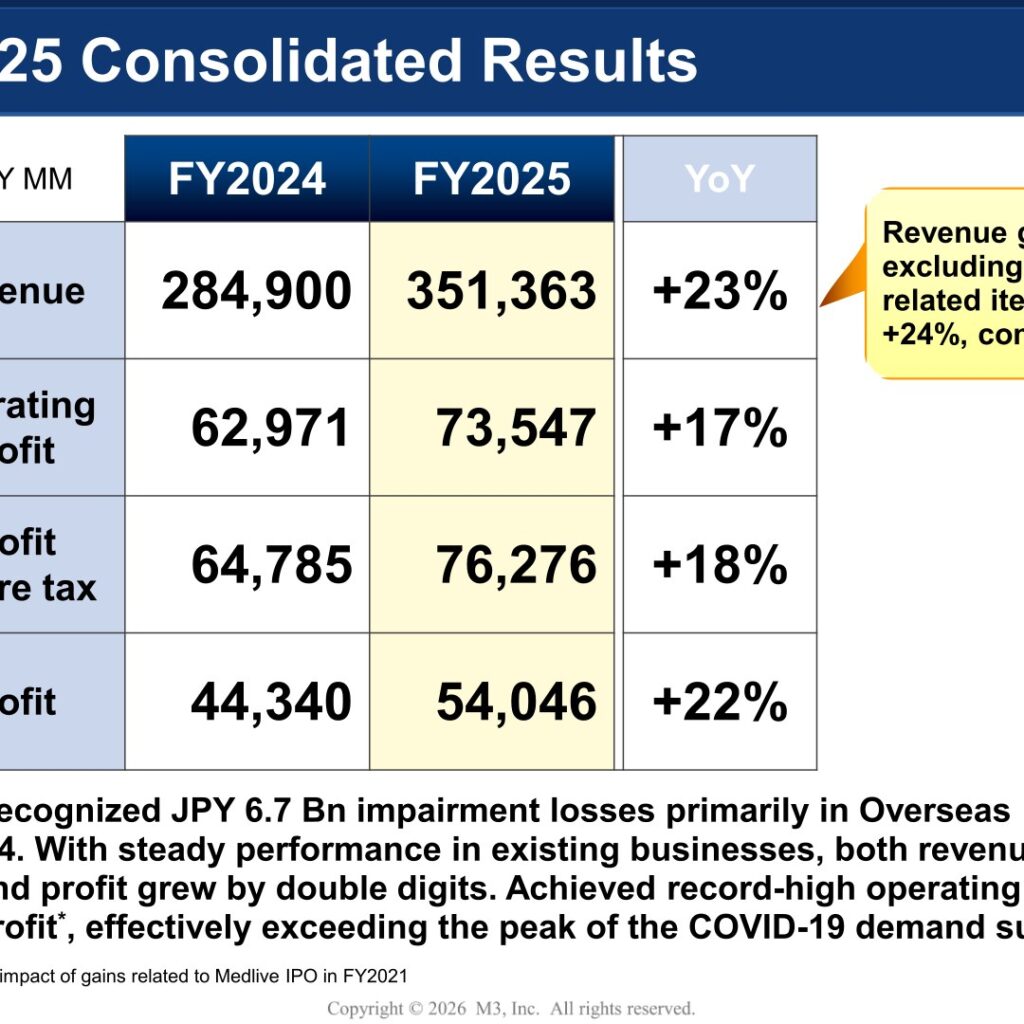
Note: In line with this site’s convention, the fiscal year ended March 2026 is labeled FY2025, consistent with the terminology used in M3, Inc.’s own presentation materials. For the fiscal year, M3 Group revenue rose 23% year-on-year to JPY 351,363 million and operating profit rose 17% to JPY 73,547 million, a record high that effectively exceeded the peak of pandemic-era demand. Profit before tax grew 18% and profit grew 22%, even after the Group recognized approximately JPY 6.7 billion in impairment losses, primarily in the Overseas segment, in the fourth quarter.
Consolidated Results (Full-Year Actual)
Revenue growth excluding COVID-related items was +24%, comparable. With steady performance across existing businesses, both revenue and profit grew by double digits in FY2025. Unit: JPY million.
| Item | FY2025 | FY2024 | YoY |
|---|---|---|---|
| Revenue | 351,363 | 284,900 | +23% |
| Operating profit | 73,547 | 62,971 | +17% |
| Profit before tax | 76,276 | 64,785 | +18% |
| Profit | 54,046 | 44,340 | +22% |
Segment Results
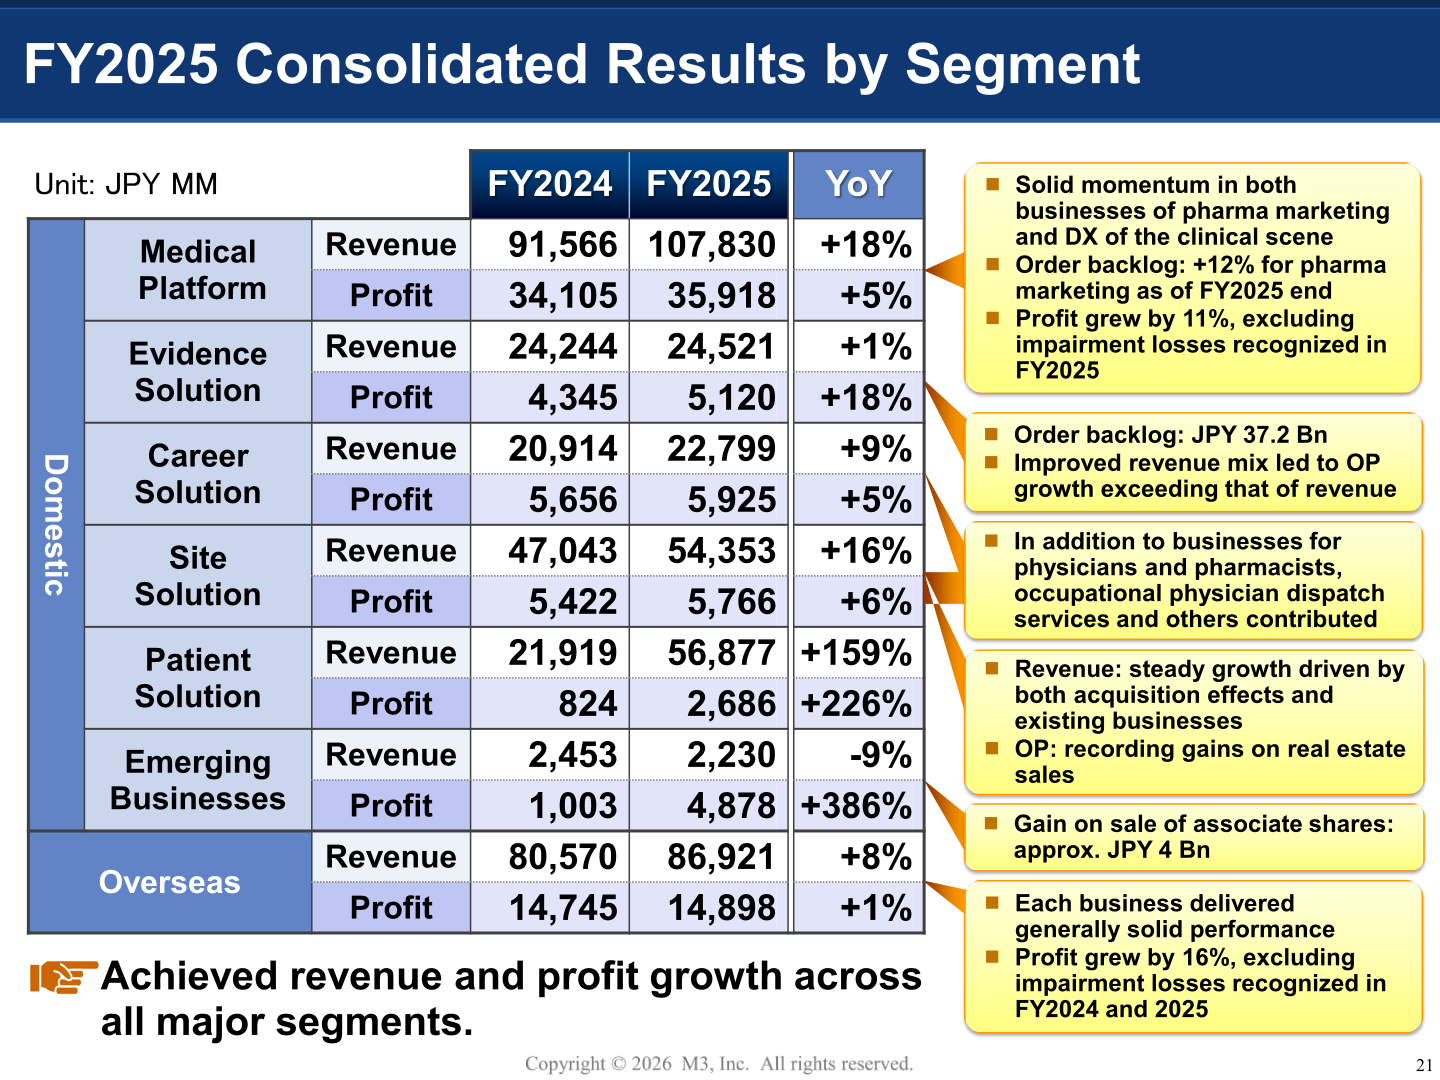
M3 achieved revenue and profit growth across all major segments in FY2025 (unit: JPY million). The Group recognized total impairment losses of approximately JPY 6.7 billion in Q4, comprising approximately JPY 2.1 billion in the Domestic Medical Platform segment (medical institutions support business), reflecting a deteriorated business outlook due to Japan’s FY2026 medical fee revisions, and approximately JPY 4.6 billion in Overseas, reflecting continued deterioration in the UK Career for Doctors business amid large-scale physician strikes and healthcare policy shifts, and negative impacts including project cancellations in US Clinical Trials due to shifts in US vaccine policy. Order backlog stood at JPY 37.2 billion. In the Overseas segment, segment profit increased 16% year-on-year (at constant currency), excluding impairment losses recognized in FY2024 and FY2025, driven by solid revenue and an improved sales mix. By region, FY2025 revenue was JPY 18,182 million in North America (FY2024: JPY 16,333 million), JPY 38,201 million in Europe (FY2024: JPY 33,692 million), and JPY 30,522 million in APAC and others (FY2024: JPY 30,482 million), for a regional total of JPY 86,905 million (FY2024: JPY 80,506 million); this regional total is as stated on the regional breakdown slide and differs slightly from the Overseas segment total shown in the segment results table.
| Segment | Metric | FY2025 | FY2024 | YoY |
|---|---|---|---|---|
| Medical Platform (Domestic) | Revenue | 107,830 | 91,566 | +18% |
| Medical Platform (Domestic) | Profit | 35,918 | 34,105 | +5% |
| Evidence Solution (Domestic) | Revenue | 24,521 | 24,244 | +1% |
| Evidence Solution (Domestic) | Profit | 5,120 | 4,345 | +18% |
| Career Solution (Domestic) | Revenue | 22,799 | 20,914 | +9% |
| Career Solution (Domestic) | Profit | 5,925 | 5,656 | +5% |
| Site Solution (Domestic) | Revenue | 54,353 | 47,043 | +16% |
| Site Solution (Domestic) | Profit | 5,766 | 5,422 | +6% |
| Patient Solution (Domestic) | Revenue | 56,877 | 21,919 | +159% |
| Patient Solution (Domestic) | Profit | 2,686 | 824 | +226% |
| Emerging Businesses (Domestic) | Revenue | 2,230 | 2,453 | -9% |
| Emerging Businesses (Domestic) | Profit | 4,878 | 1,003 | +386% |
| Overseas | Revenue | 86,921 | 80,570 | +8% |
| Overseas | Profit | 14,898 | 14,745 | +1% |
FY2026 Forecast
M3’s long-term results chart shows consolidated revenue and operating profit trends through an FY2026 (E26) data point. Unit: JPY million.
| Item | FY2026 (Forecast) | FY2025 (Actual) |
|---|---|---|
| Revenue | 400,000 | 351,363 |
| Operating profit | 80,000 | 73,547 |
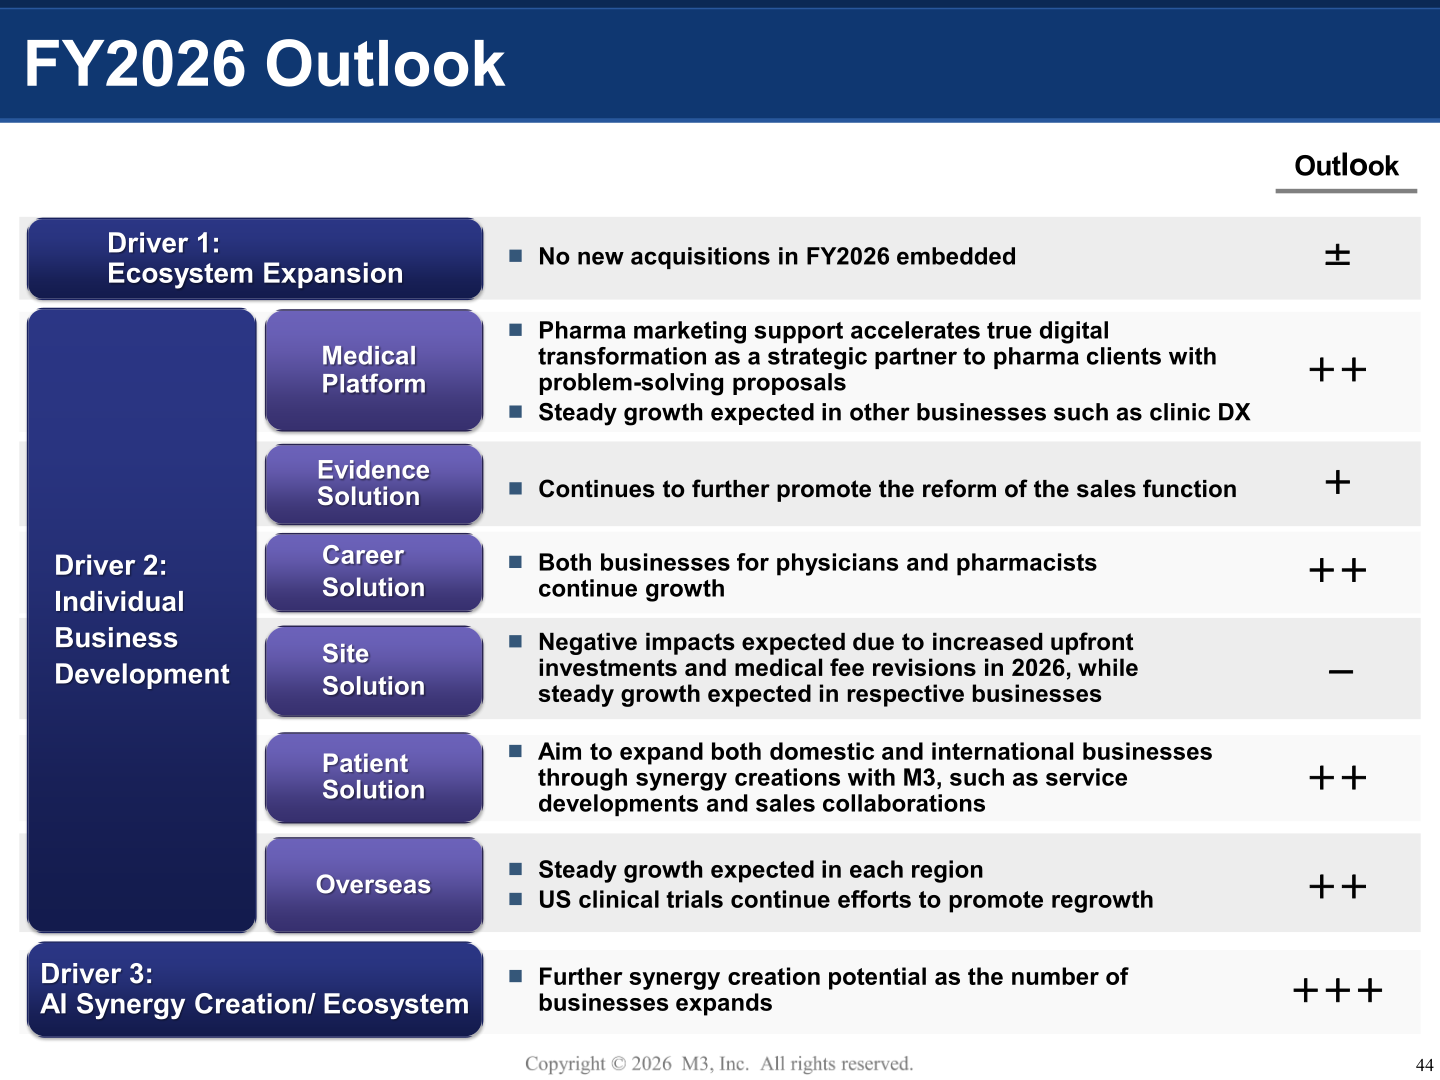
For FY2026, M3 cited three growth drivers: Driver 1 Ecosystem Expansion, Driver 2 Individual Business Development, and Driver 3 AI Synergy Creation/Ecosystem. By business area, pharma marketing support is expected to accelerate digital transformation as a strategic partner to pharma clients through problem-solving proposals, with steady growth expected in other businesses such as clinic DX, and continued promotion of sales-function reform. Both physician- and pharmacist-facing businesses are expected to continue growing. Negative impacts are expected from increased upfront investment and Japan’s FY2026 medical fee revisions, alongside steady growth in the respective businesses. Overseas, steady growth is expected in each region, with US clinical trials continuing efforts to promote regrowth. No new acquisitions are embedded in the FY2026 plan.
Shareholder Returns
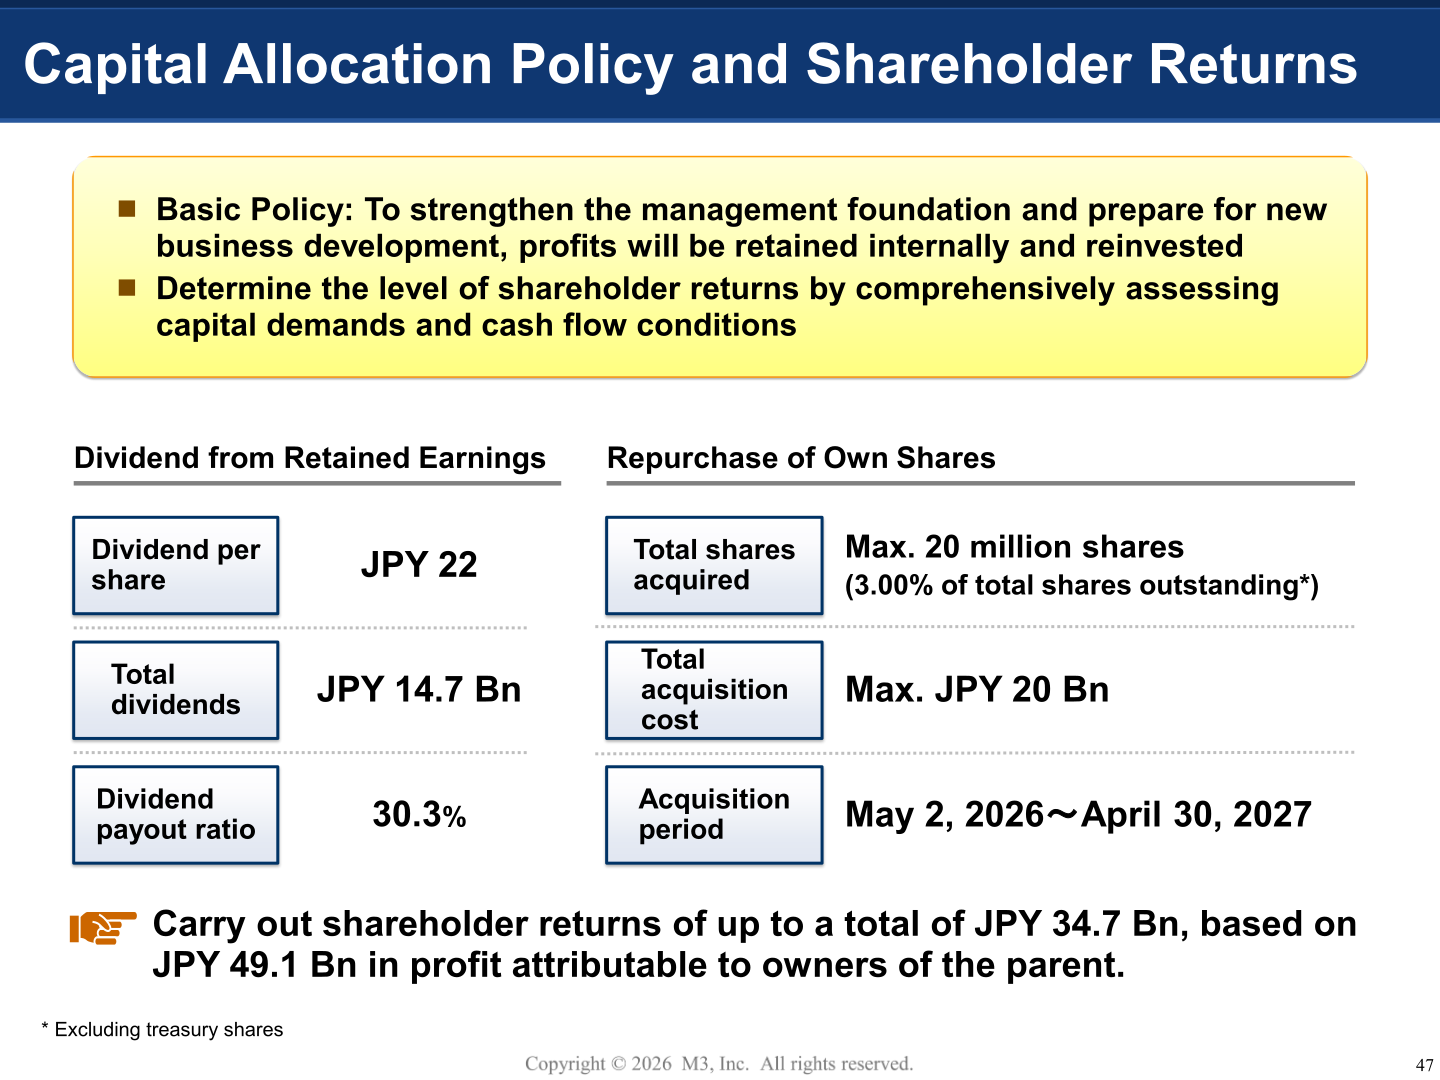
Basic policy: to strengthen the management foundation and prepare for new business development, profits are retained internally and reinvested; the level of shareholder returns is determined by comprehensively assessing capital demands and cash flow conditions. M3 stated it will carry out shareholder returns of up to a total of JPY 34.7 billion, based on JPY 49.1 billion in profit attributable to owners of the parent.
| Item | FY2025 / Plan |
|---|---|
| Dividend per share | JPY 22 |
| Total dividends | JPY 14.7 Bn |
| Dividend payout ratio | 30.3% |
| Total shareholder returns (dividends + buybacks) | Up to JPY 34.7 Bn |
| Share buyback – max shares to be acquired | Max. 20 million shares (3.00% of total shares outstanding, excl. treasury shares) |
| Share buyback – max acquisition cost | Max. JPY 20 Bn |
| Share buyback – acquisition period | May 2, 2026 – April 30, 2027 |
Medium-Term Plan / Topics
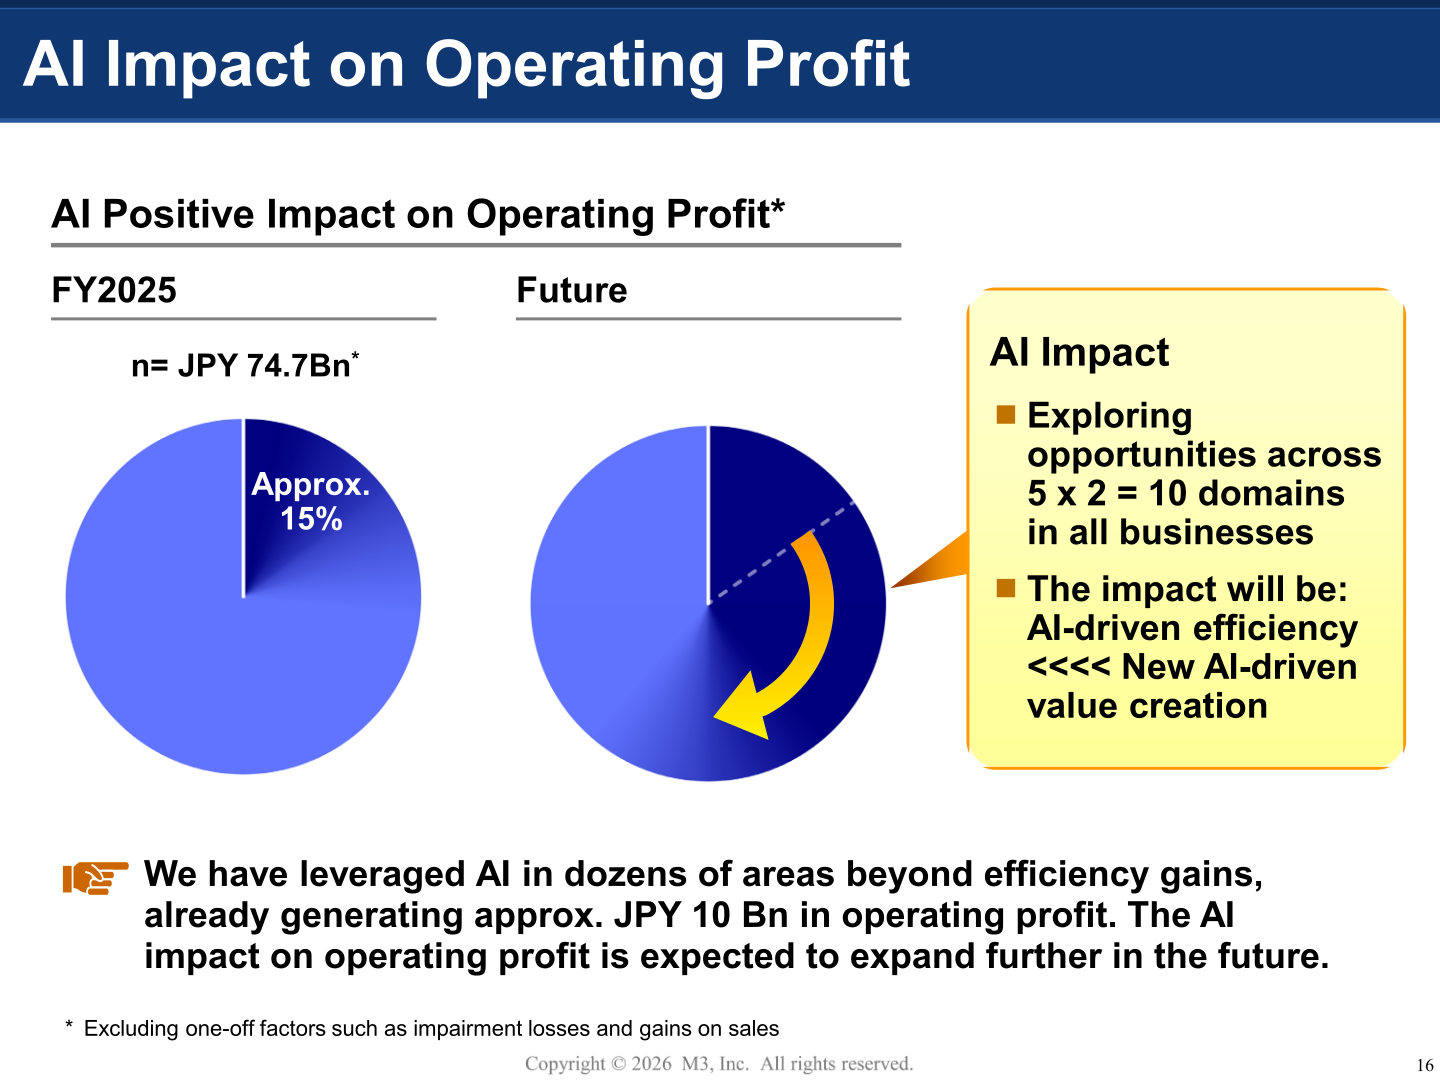
Effective June 1, 2026, M3 will update its Group Mission to: “Using technology creatively to help as many people as possible live longer, healthier, and happier lives, while minimizing unnecessary healthcare costs,” while its founding philosophy of “One More Life, One Less Cost” remains unchanged; the update was shared with the approximately 17,000 M3 Group staff across 18 countries. On AI, M3 stated that AI is already generating approximately JPY 10 billion in operating profit through use across dozens of areas beyond efficiency gains, equivalent to roughly 15% of an approximately JPY 74.7 billion operating profit base (excluding one-off items such as impairment losses and gains on sales), exploring opportunities across 5 x 2 = 10 domains in all businesses, with this impact expected to expand further. Over the longer term, M3’s growth-potential simulation shows Group sales expanding from JPY 14.6 billion in FY2010 to JPY 64.7 billion in FY2015 (4.5x), JPY 169.2 billion in FY2020 (12.0x), and JPY 351.4 billion in FY2025 (24.0x), with the number of countries, business types, and business units also expanding several-fold over the same period (countries: 3 to 18, 6.0x; business types: 6 to 41, 7.0x; business units: 10 to 81, 8.0x); M3 stated it aims for further growth exceeding 10-20x current levels through aggressive M&A.
This article is an analysis based on publicly available information and is not a recommendation to buy or sell any specific securities. Investment decisions are your own responsibility.
![[Obayashi] Investors’ Guide 2026 — The Complete 24-Article Breakdown](https://japan-equity.com/wp-content/uploads/2026/07/hub_cover-1024x1024.png)
![[Obayashi] IR & SR Policy — Feeding Dialogue Back into Management](https://japan-equity.com/wp-content/uploads/2026/07/p32_sq-1024x1024.jpg)
![[Obayashi] Domestic Civil Engineering — Resilience Spending Supports 9.6% Margin](https://japan-equity.com/wp-content/uploads/2026/07/p11_sq-1024x1024.jpg)
![[Obayashi] Overseas Construction — Orders Reach ¥1.2tn](https://japan-equity.com/wp-content/uploads/2026/07/p15_sq-1024x1024.jpg)
![[Obayashi] Share Price & External Ratings — vs TOPIX, ESG Index Inclusion](https://japan-equity.com/wp-content/uploads/2026/07/p40_sq-1024x1024.jpg)
![[Construction] ¥75.5tn Investment, Shrinking Workforce — Big-5 Market Share](https://japan-equity.com/wp-content/uploads/2026/07/p12_sq-1024x1024.jpg)



![[Obayashi] Capital Policy & Shareholder Returns — ROE 10%+, DOE ~5%, ¥100bn Buyback](https://japan-equity.com/wp-content/uploads/2026/07/p27_sq-1024x1024.jpg)
![[Obayashi] Reducing Cross-Shareholdings — ¥285.2bn Sold in Five Years](https://japan-equity.com/wp-content/uploads/2026/07/p29_sq-1024x1024.jpg)
![[Obayashi] ¥750bn Investment Plan — ¥300bn to Development, ¥190bn to Tech/DX](https://japan-equity.com/wp-content/uploads/2026/07/p30_sq-1024x1024.jpg)
![[Obayashi] MTP2022 KPIs — Operating Profit ~2x Target, ROE 14.4%](https://japan-equity.com/wp-content/uploads/2026/07/p25_sq-1024x1024.jpg)
![[Obayashi] Cash Allocation — ¥420bn Investment CF Over Five Years](https://japan-equity.com/wp-content/uploads/2026/07/p26_sq-1024x1024.jpg)
![[Obayashi] Green Energy — 44 Plants, 344MW, and the Green Hydrogen Challenge](https://japan-equity.com/wp-content/uploads/2026/07/p21_sq-1024x1024.jpg)
![[Obayashi] Tackling the Labor Shortage — Robotics Construction®](https://japan-equity.com/wp-content/uploads/2026/07/p14_sq-1024x1024.jpg)
