
This article is based on publicly available IR materials and is not a recommendation to buy or sell any specific securities.
JFE Holdings, Inc. reported FY2025 (fiscal year ended March 31, 2026) revenue of ¥4,539.2 bn, down ¥320.4 bn year on year, with business profit of ¥135.3 bn (±0.0 bn year on year) and business profit excluding inventory valuation etc. of ¥166.3 bn, down ¥70.0 bn. Profit attributable to owners of parent was ¥70.1 bn, down ¥21.7 bn, and ROE was 2.7%. The company describes a highly uncertain geopolitical environment — a slowdown in the Chinese economy, protectionist measures such as US tariffs, and escalating tensions in the Middle East — with the steel spread significantly below medium-term plan projections. For FY2026 the company forecasts business profit of ¥215.0 bn and profit attributable to owners of parent of ¥150.0 bn, with the annual dividend held at ¥80 per share.
Consolidated Results (Full-Year Actual)
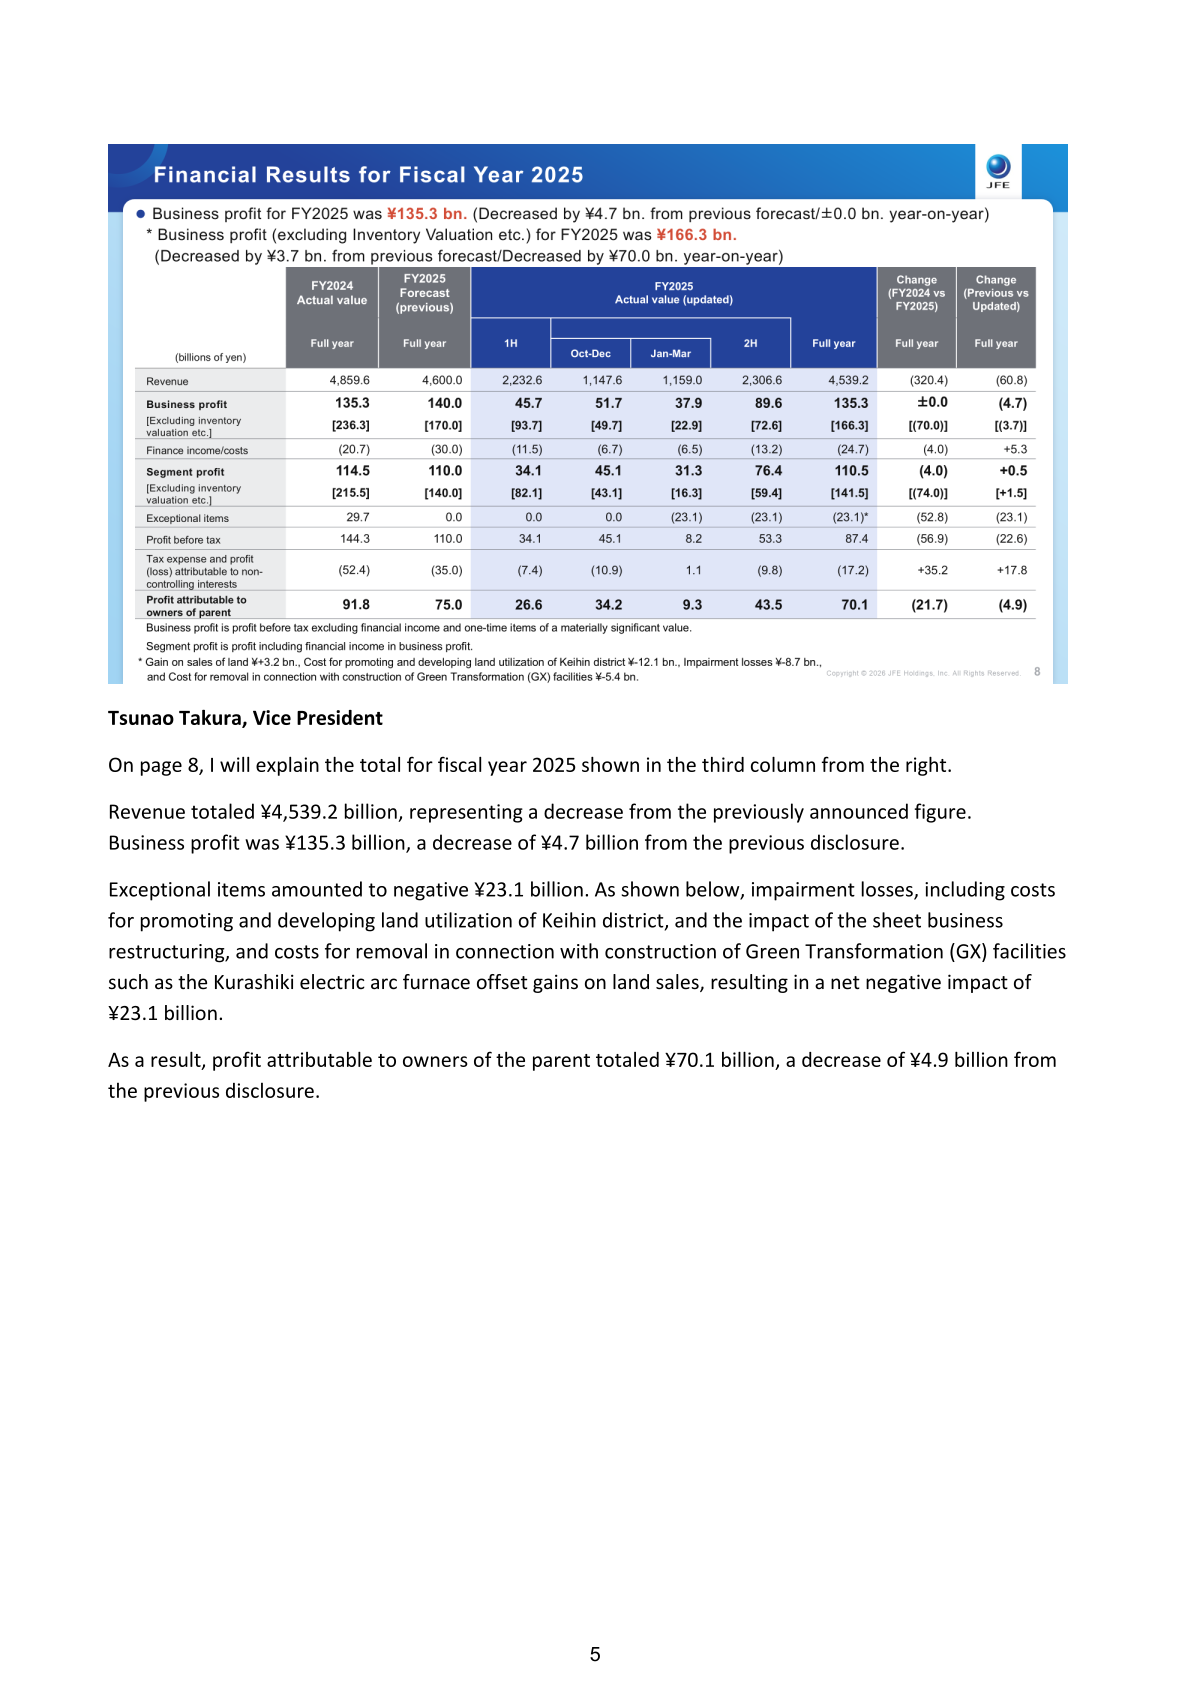
Business profit for FY2025 was ¥135.3 bn, a decrease of ¥4.7 bn from the previous forecast and ±0.0 bn year on year. Business profit excluding inventory valuation etc. was ¥166.3 bn, a decrease of ¥3.7 bn from the previous forecast and a decrease of ¥70.0 bn year on year. Exceptional items were negative ¥23.1 bn: a gain on sales of land of ¥+3.2 bn was offset by cost for promoting and developing land utilization of the Keihin district of ¥-12.1 bn, impairment losses of ¥-8.7 bn, and cost for removal in connection with construction of Green Transformation (GX) facilities of ¥-5.4 bn.
| Item (billions of yen) | FY2025 (Actual) | FY2024 (Actual) | Change (FY2024 vs FY2025) |
|---|---|---|---|
| Revenue | 4,539.2 | 4,859.6 | (320.4) |
| Business profit | 135.3 | 135.3 | ±0.0 |
| [Excluding inventory valuation etc.] | [166.3] | [236.3] | [(70.0)] |
| Finance income/costs | (24.7) | (20.7) | (4.0) |
| Segment profit | 110.5 | 114.5 | (4.0) |
| [Excluding inventory valuation etc.] | [141.5] | [215.5] | [(74.0)] |
| Exceptional items | (23.1) | 29.7 | (52.8) |
| Profit before tax | 87.4 | 144.3 | (56.9) |
| Tax expense and profit (loss) attributable to non-controlling interests | (17.2) | (52.4) | +35.2 |
| Profit attributable to owners of parent | 70.1 | 91.8 | (21.7) |
Segment Results
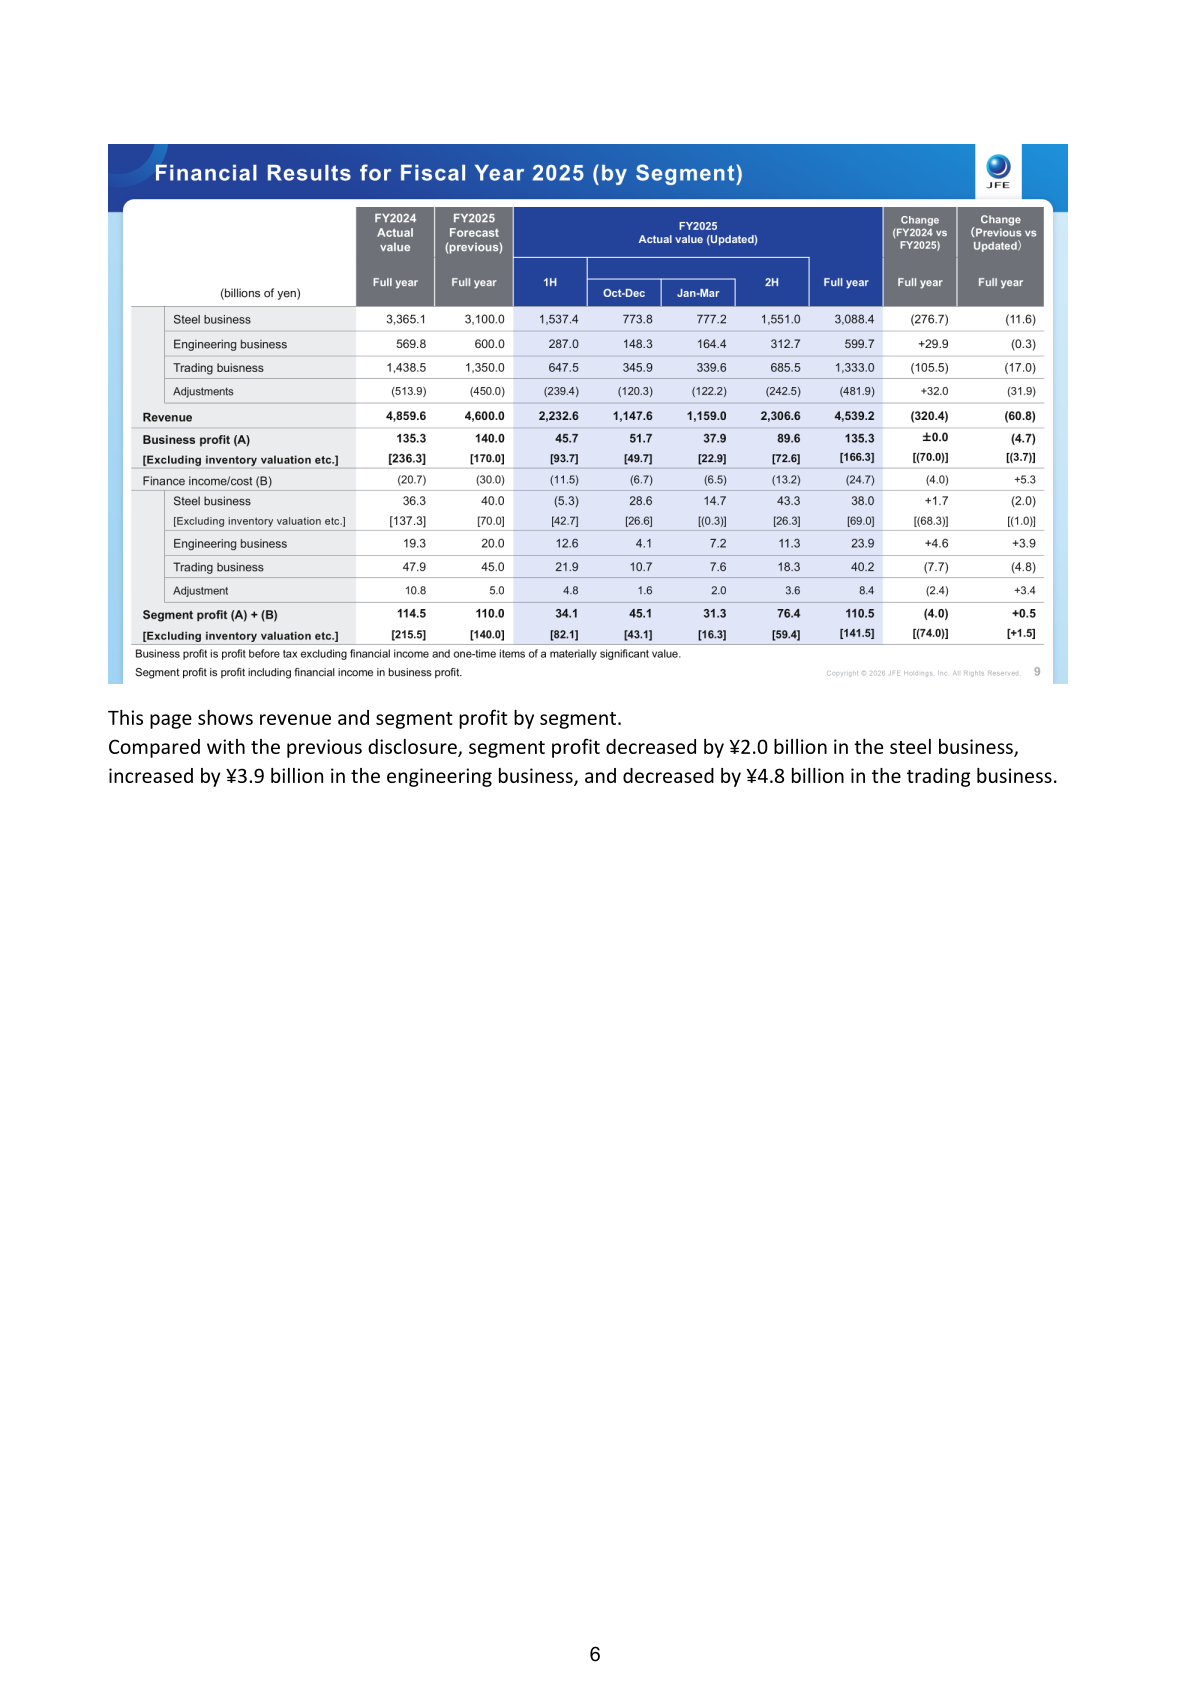
By segment, the steel business posted revenue of ¥3,088.4 bn (down ¥276.7 bn year on year) and segment profit of ¥38.0 bn (up ¥1.7 bn); excluding inventory valuation etc., steel segment profit was ¥69.0 bn, down ¥68.3 bn. The engineering business recorded revenue of ¥599.7 bn, up ¥29.9 bn and a record high for the fourth consecutive fiscal year, with segment profit of ¥23.9 bn, up ¥4.6 bn; order intake reached a record high of ¥836.1 bn, up ¥256.6 bn from FY2024, driven by increased orders in the Waste to Resource sector. The trading business (JFE Shoji) posted revenue of ¥1,333.0 bn (down ¥105.5 bn) and segment profit of ¥40.2 bn (down ¥7.7 bn), reflecting a delayed recovery in North America and other factors.
| Segment (billions of yen) | Metric | FY2025 (Actual) | FY2024 (Actual) | Change |
|---|---|---|---|---|
| Steel business | Revenue | 3,088.4 | 3,365.1 | (276.7) |
| Steel business | Segment profit | 38.0 | 36.3 | +1.7 |
| Steel business | Segment profit [excluding inventory valuation etc.] | [69.0] | [137.3] | [(68.3)] |
| Engineering business | Revenue | 599.7 | 569.8 | +29.9 |
| Engineering business | Segment profit | 23.9 | 19.3 | +4.6 |
| Engineering business | Orders | 836.1 | 579.5 | +256.6 |
| Trading business | Revenue | 1,333.0 | 1,438.5 | (105.5) |
| Trading business | Segment profit | 40.2 | 47.9 | (7.7) |
| Adjustments | Revenue | (481.9) | (513.9) | +32.0 |
| Adjustment | Segment profit | 8.4 | 10.8 | (2.4) |
For JFE Steel, crude steel production (standalone) was 21.37 million mt in FY2025 versus 21.95 million mt in FY2024, shipments (standalone) were 18.86 million mt versus 19.36 million mt, the average sales price (standalone) was ¥120.7 thousand/mt versus ¥130.3 thousand/mt, and the average exchange rate was ¥150.2/US$ versus ¥152.7/US$. In the year-on-year segment profit analysis, cost contributed ¥+27.0 bn and inventory valuation etc. ¥+70.0 bn, while volume and mix were ¥(12.0) bn, spreads ¥(78.0) bn and others ¥(5.3) bn.
Cash Flow and Financial Position
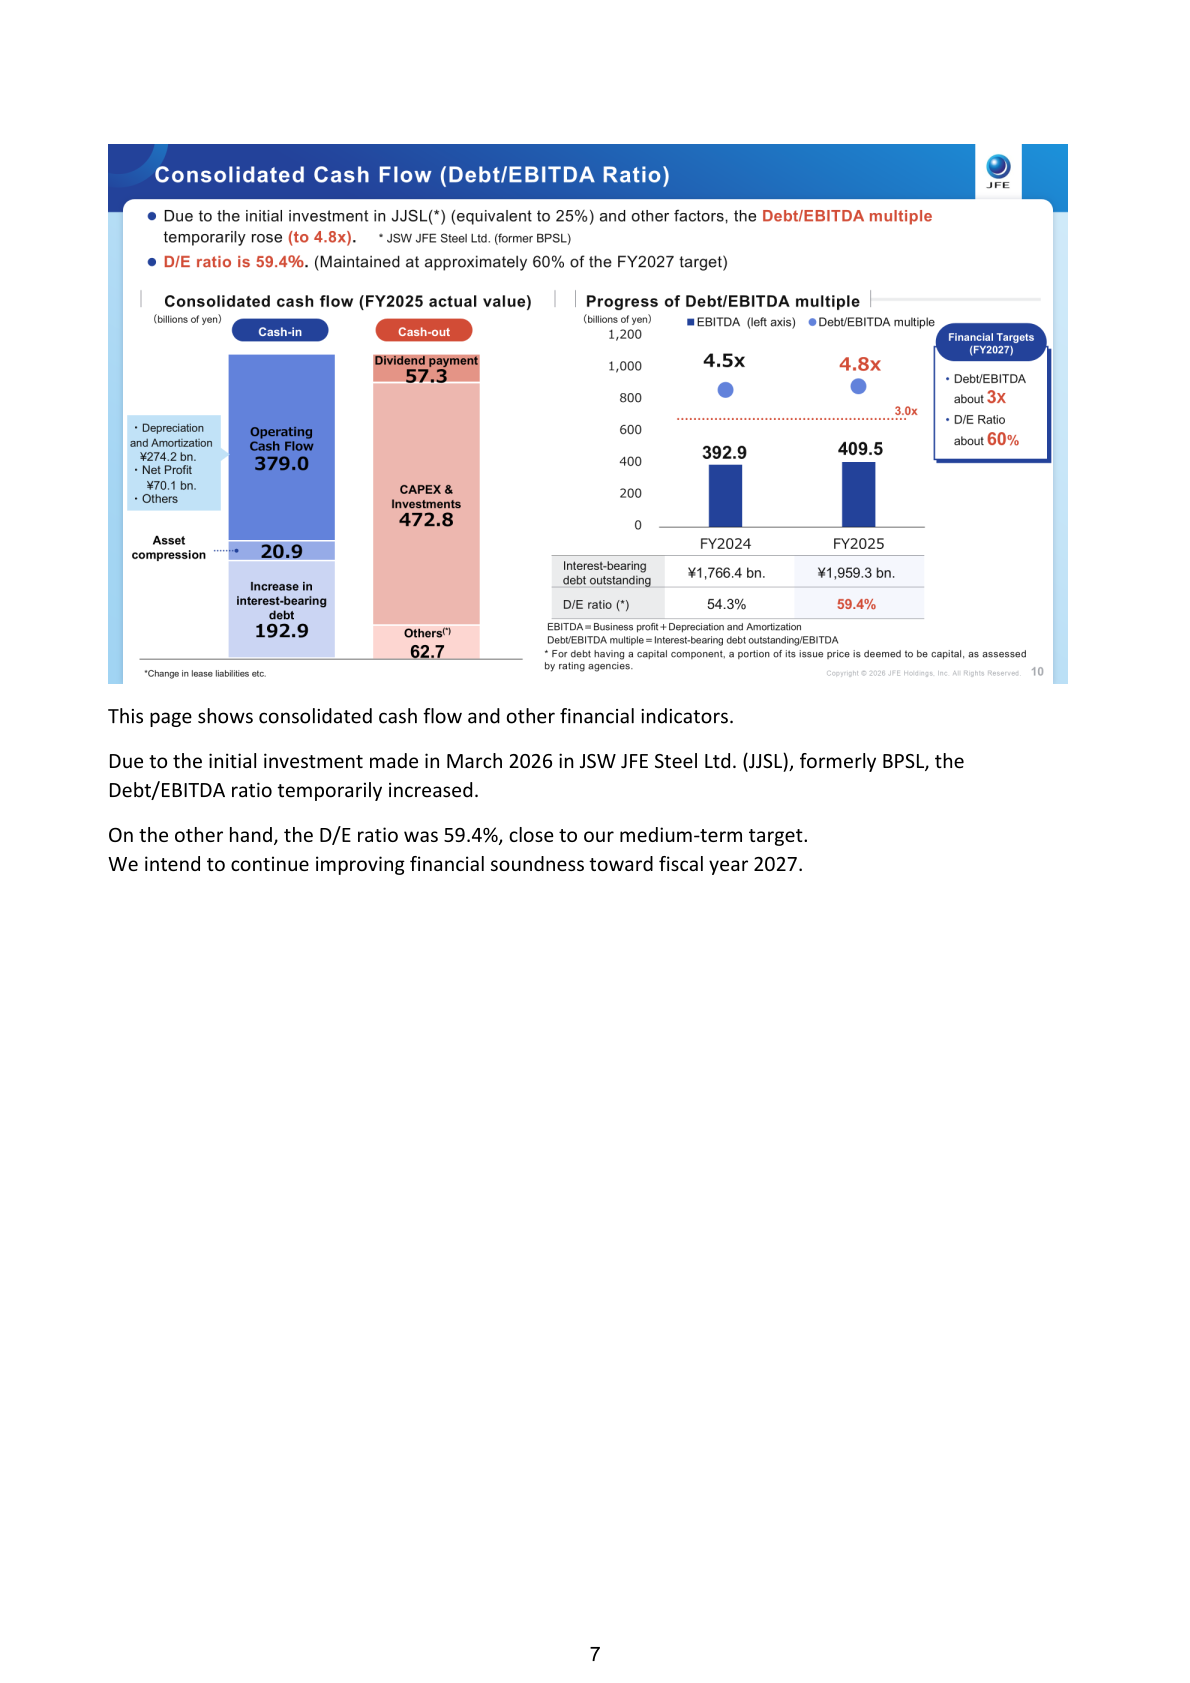
FY2025 operating cash flow was ¥379.0 bn (including depreciation and amortization of ¥274.2 bn and net profit of ¥70.1 bn), with asset compression of ¥20.9 bn and an increase in interest-bearing debt of ¥192.9 bn on the cash-in side. Cash-out comprised CAPEX and investments of ¥472.8 bn, dividend payment of ¥57.3 bn and others of ¥62.7 bn. Interest-bearing debt outstanding rose to ¥1,959.3 bn from ¥1,766.4 bn, EBITDA was ¥409.5 bn versus ¥392.9 bn, and the Debt/EBITDA multiple temporarily rose to 4.8x from 4.5x due to the initial investment in JSW JFE Steel Ltd. (JJSL, former BPSL). The D/E ratio was 59.4% versus 54.3%. The FY2027 financial targets are a Debt/EBITDA multiple of about 3x and a D/E ratio of about 60%.
FY2026 Forecast
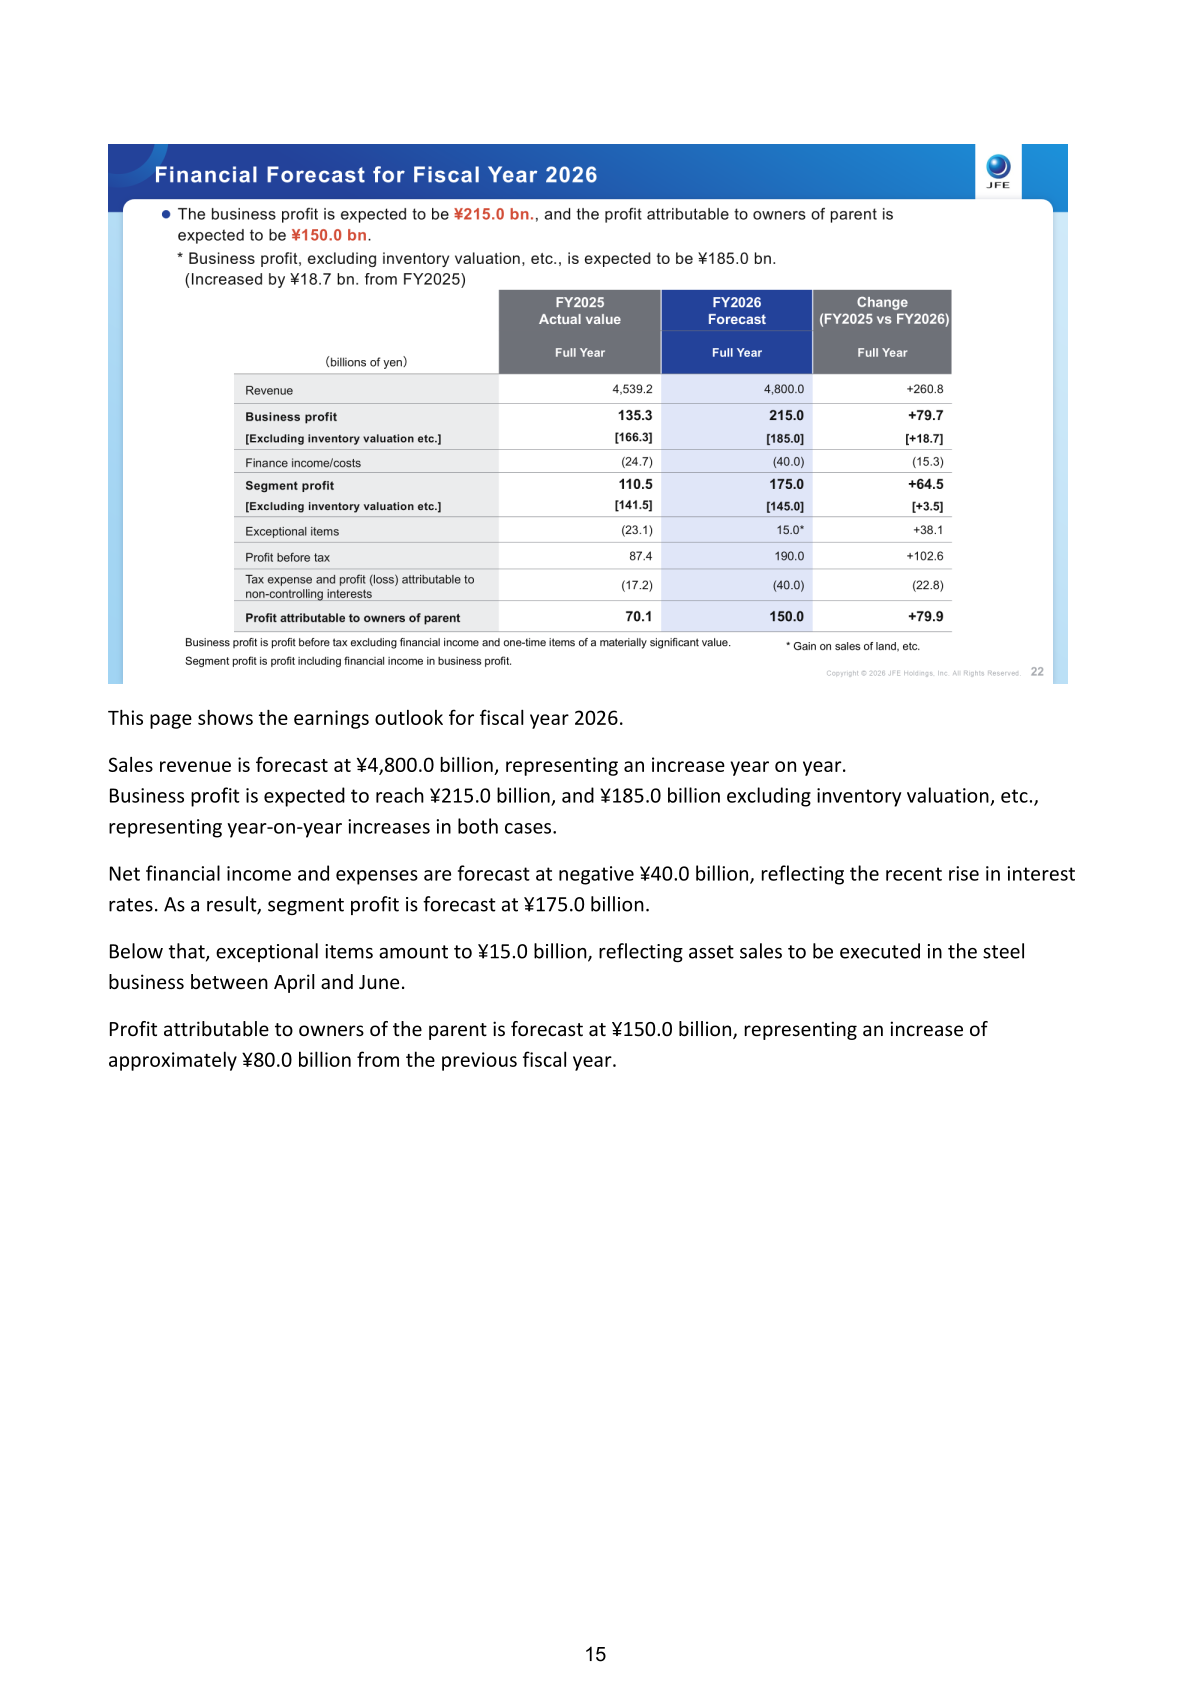
For FY2026 the company forecasts revenue of ¥4,800.0 bn (up ¥260.8 bn), business profit of ¥215.0 bn (up ¥79.7 bn) and business profit excluding inventory valuation etc. of ¥185.0 bn (up ¥18.7 bn). Finance income/costs are forecast at ¥(40.0) bn reflecting the recent rise in interest rates, giving segment profit of ¥175.0 bn. Exceptional items of ¥15.0 bn reflect a gain on sales of land etc., and profit attributable to owners of parent is forecast at ¥150.0 bn, up ¥79.9 bn. ROE is projected at approximately 6%. The forecast assumes an exchange rate of approximately ¥155.0/US$ and crude steel production (standalone) of approximately 21.50 million mt. The company states that the impact of the situation in the Middle East has not been factored into the FY2026 outlook.
| Item (billions of yen) | FY2026 (Forecast) | FY2025 (Actual) | Change |
|---|---|---|---|
| Revenue | 4,800.0 | 4,539.2 | +260.8 |
| Business profit | 215.0 | 135.3 | +79.7 |
| [Excluding inventory valuation etc.] | [185.0] | [166.3] | [+18.7] |
| Finance income/costs | (40.0) | (24.7) | (15.3) |
| Segment profit | 175.0 | 110.5 | +64.5 |
| [Excluding inventory valuation etc.] | [145.0] | [141.5] | [+3.5] |
| Exceptional items | 15.0 | (23.1) | +38.1 |
| Profit before tax | 190.0 | 87.4 | +102.6 |
| Tax expense and profit (loss) attributable to non-controlling interests | (40.0) | (17.2) | (22.8) |
| Profit attributable to owners of parent | 150.0 | 70.1 | +79.9 |
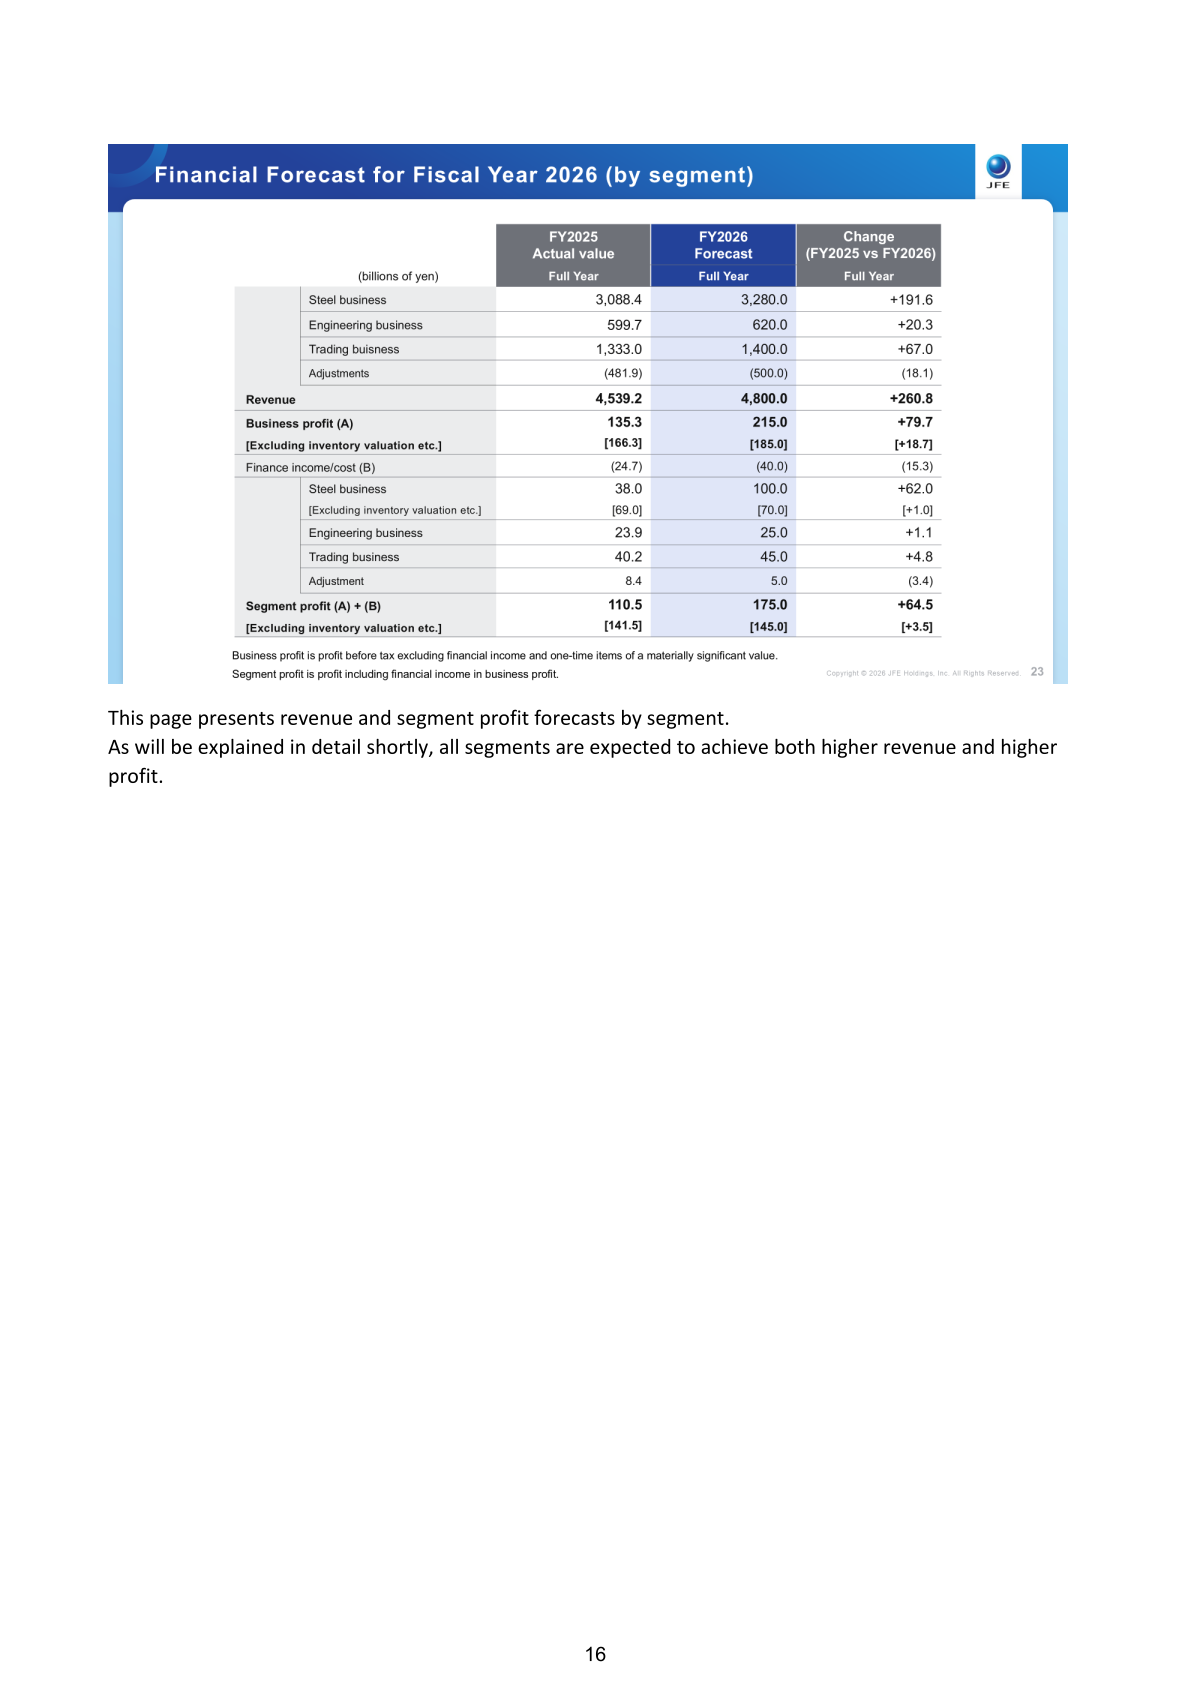
By segment, all three businesses are forecast to achieve both higher revenue and higher profit in FY2026: steel business revenue of ¥3,280.0 bn with segment profit of ¥100.0 bn (¥70.0 bn excluding inventory valuation etc.), engineering business revenue of ¥620.0 bn with segment profit of ¥25.0 bn, and trading business revenue of ¥1,400.0 bn with segment profit of ¥45.0 bn. In the engineering business, orders are forecast at ¥600.0 bn (down ¥236.1 bn from the record FY2025 level) with an order backlog at fiscal year-end of ¥1,200.0 bn.
| Segment (billions of yen) | Metric | FY2026 (Forecast) | FY2025 (Actual) | Change |
|---|---|---|---|---|
| Steel business | Revenue | 3,280.0 | 3,088.4 | +191.6 |
| Steel business | Segment profit | 100.0 | 38.0 | +62.0 |
| Steel business | Segment profit [excluding inventory valuation etc.] | [70.0] | [69.0] | [+1.0] |
| Engineering business | Revenue | 620.0 | 599.7 | +20.3 |
| Engineering business | Segment profit | 25.0 | 23.9 | +1.1 |
| Engineering business | Orders | 600.0 | 836.1 | (236.1) |
| Trading business | Revenue | 1,400.0 | 1,333.0 | +67.0 |
| Trading business | Segment profit | 45.0 | 40.2 | +4.8 |
| Adjustments | Revenue | (500.0) | (481.9) | (18.1) |
| Adjustment | Segment profit | 5.0 | 8.4 | (3.4) |
Shareholder Returns
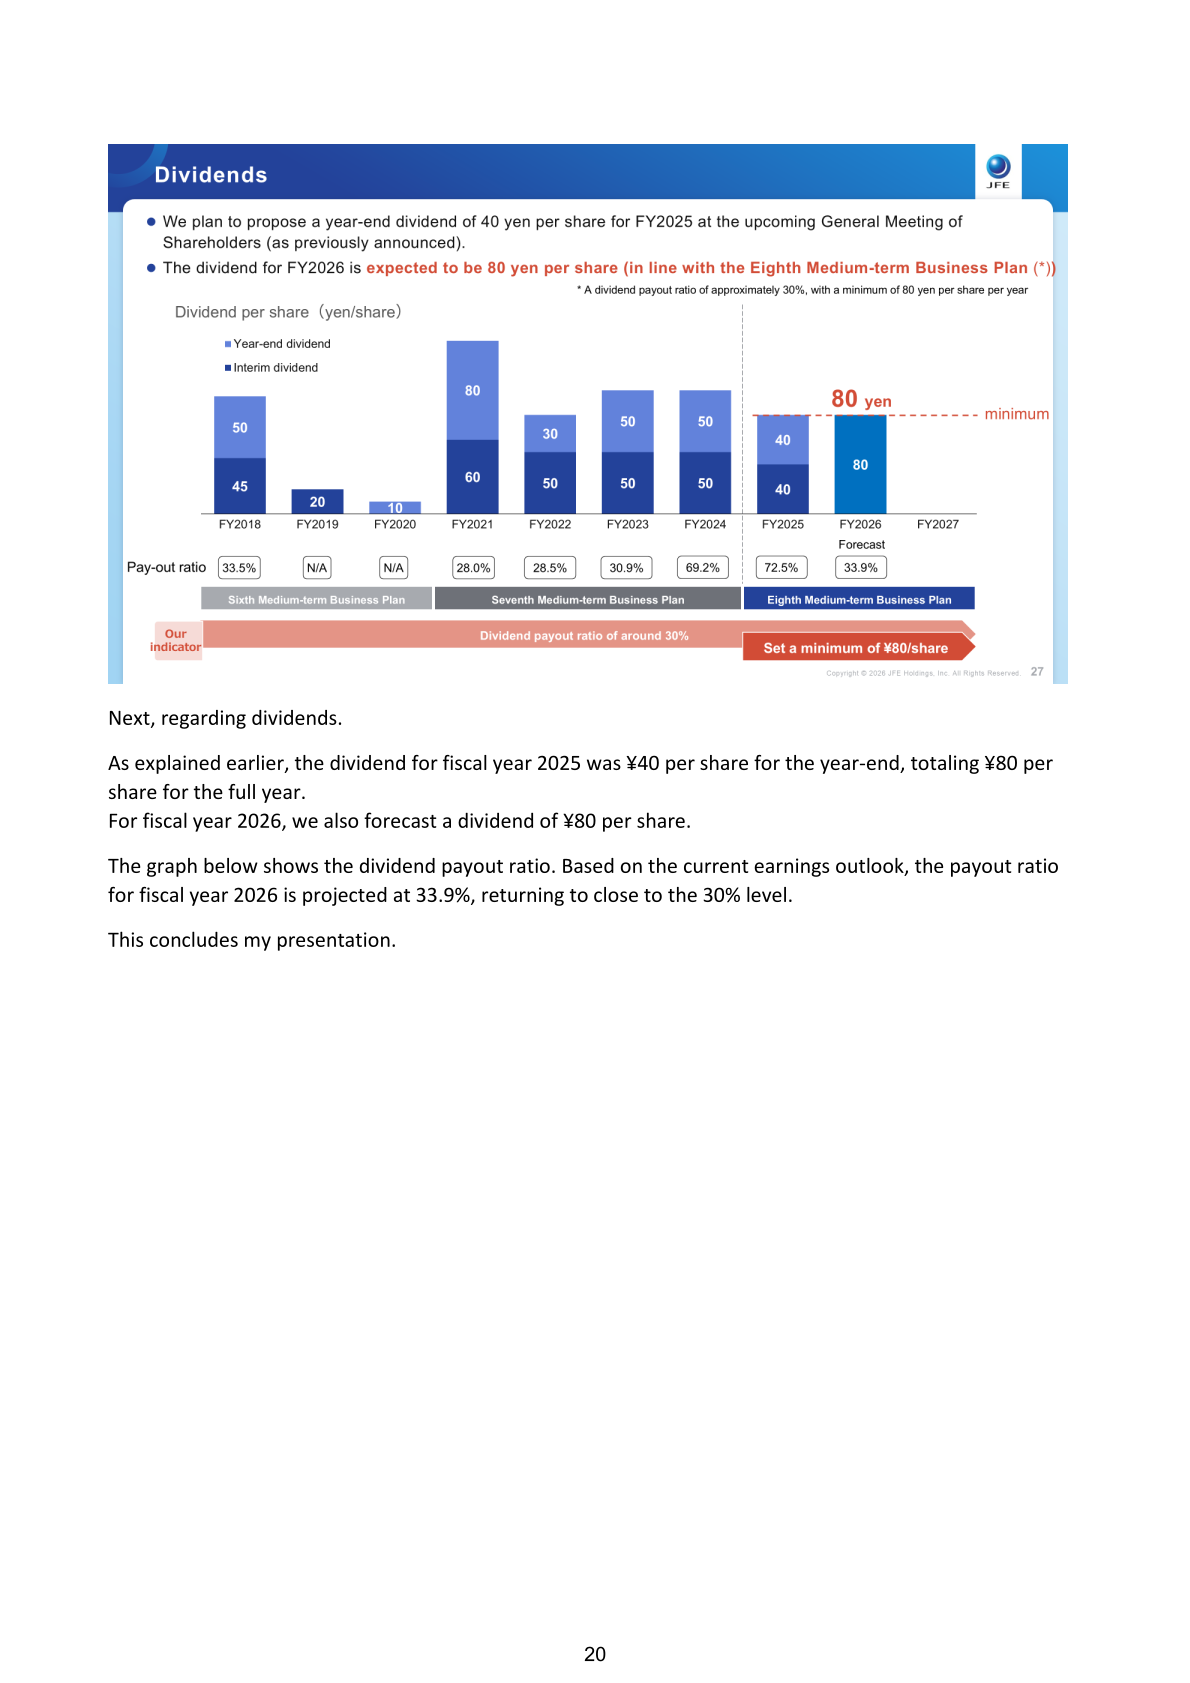
For FY2025 the company plans to propose a year-end dividend of ¥40 per share at the upcoming General Meeting of Shareholders, bringing the annual dividend to ¥80 per share, with a payout ratio of 72.5%. For FY2026 the dividend is expected to be ¥80 per share, in line with the Eighth Medium-term Business Plan, which sets a dividend payout ratio of approximately 30% with a minimum of ¥80 per share per year; the FY2026 payout ratio is projected at 33.9%. The company notes that because earnings levels in FY2025 and FY2026 remain lower than initially planned and the business environment continues to be very challenging, it will carefully maintain financial soundness while balancing investments and funding sources.
| Item | FY2026 (Forecast) | FY2025 | FY2024 |
|---|---|---|---|
| Dividend per share | ¥80 | ¥80 (interim ¥40 / year-end ¥40) | ¥100 (interim ¥50 / year-end ¥50) |
| Pay-out ratio | 33.9% | 72.5% | 69.2% |
Medium-Term Plan / Topics
JFE formulated the JFE Group Long-term Vision, “JFE Vision 2035,” and the Eighth Medium-term Business Plan covering FY2025–FY2027 (announced in May 2025). The Eighth Medium-term Business Plan targets business profit of ¥400.0 bn and ROE of at least 10% in FY2027, with a dividend payout ratio of approximately 30% and a minimum of ¥80 per share; JFE Vision 2035 targets business profit of ¥700.0 bn in FY2035. The plan’s themes are rebuilding the domestic production structure (raising the ratio of high-value-added products to 60% and reorganizing domestic production and businesses), expanding the overseas business through partnerships with top-tier local companies in growth regions, and developing and promoting the widespread adoption of green steel, including ultra-innovative technology development and innovative electric arc furnaces. Management states that following FY2025, FY2026 earnings are also expected to fall short of initial medium-term projections.
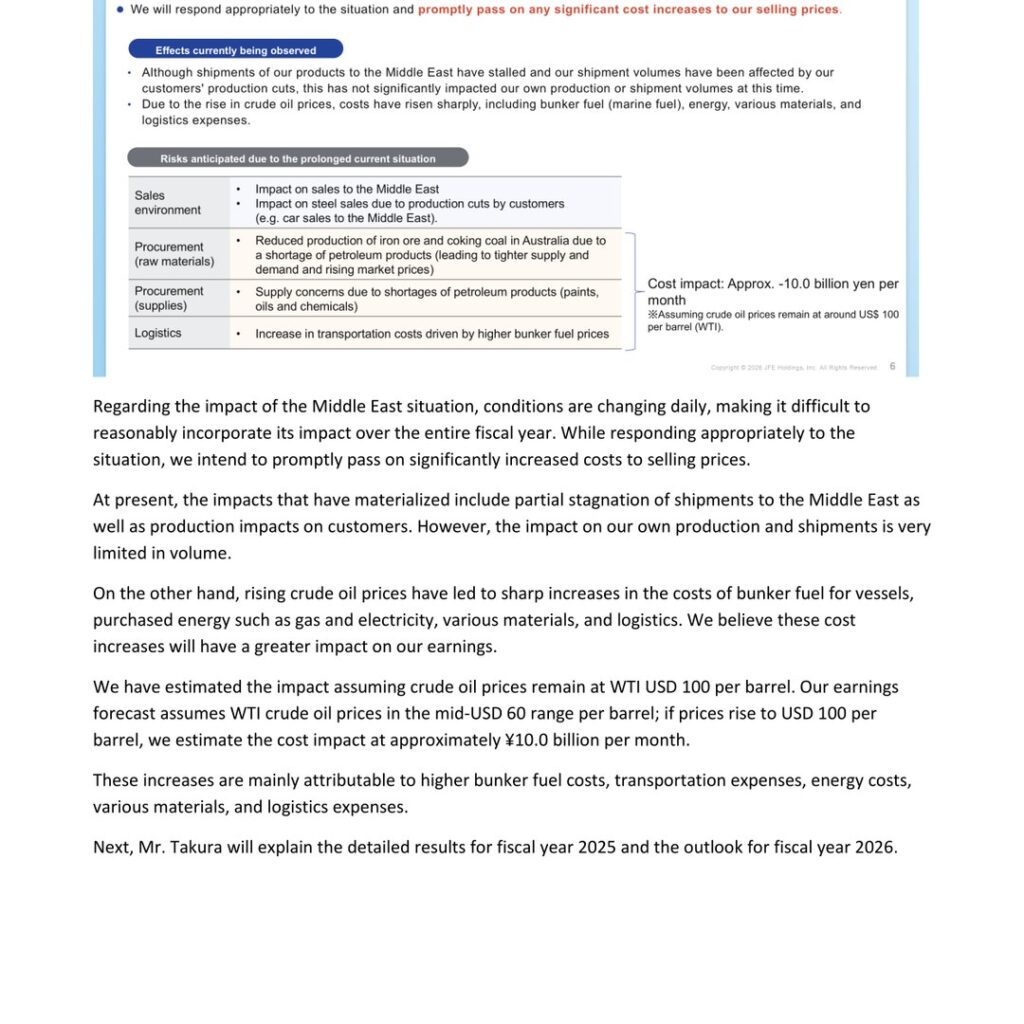
On the FY2026 business environment, the company assumes domestic steel demand will remain generally flat with sluggish construction demand and automotive demand at the same level as FY2025, while overseas the challenging supply-demand environment, particularly in Asia, is expected to persist. Iron ore prices are expected to remain at current levels (FOB $90–$100) and coking coal at approximately FOB $230. Regarding the situation in the Middle East, the company states that conditions change daily, making it difficult to fully account for the impact over the fiscal year; assuming crude oil prices remain around US$100 per barrel (WTI), it estimates a cost impact of approximately -¥10.0 billion per month, and it intends to promptly pass on significant cost increases to selling prices.
This article is an analysis based on publicly available information and is not a recommendation to buy or sell any specific securities. Investment decisions are your own responsibility.
![[Obayashi] Investors’ Guide 2026 — The Complete 24-Article Breakdown](https://japan-equity.com/wp-content/uploads/2026/07/hub_cover-1024x1024.png)
![[Obayashi] IR & SR Policy — Feeding Dialogue Back into Management](https://japan-equity.com/wp-content/uploads/2026/07/p32_sq-1024x1024.jpg)
![[Obayashi] Real Estate Development — 18.7% Margin, ¥287.7bn Unrealized Gains](https://japan-equity.com/wp-content/uploads/2026/07/p20_sq-1024x1024.jpg)
![[Obayashi] Domestic Civil Engineering — Resilience Spending Supports 9.6% Margin](https://japan-equity.com/wp-content/uploads/2026/07/p11_sq-1024x1024.jpg)
![[Obayashi] Share Price & External Ratings — vs TOPIX, ESG Index Inclusion](https://japan-equity.com/wp-content/uploads/2026/07/p40_sq-1024x1024.jpg)
![[Construction] ¥75.5tn Investment, Shrinking Workforce — Big-5 Market Share](https://japan-equity.com/wp-content/uploads/2026/07/p12_sq-1024x1024.jpg)



![[Obayashi] Capital Policy & Shareholder Returns — ROE 10%+, DOE ~5%, ¥100bn Buyback](https://japan-equity.com/wp-content/uploads/2026/07/p27_sq-1024x1024.jpg)
![[Obayashi] Reducing Cross-Shareholdings — ¥285.2bn Sold in Five Years](https://japan-equity.com/wp-content/uploads/2026/07/p29_sq-1024x1024.jpg)
![[Obayashi] ¥750bn Investment Plan — ¥300bn to Development, ¥190bn to Tech/DX](https://japan-equity.com/wp-content/uploads/2026/07/p30_sq-1024x1024.jpg)
![[Obayashi] MTP2022 KPIs — Operating Profit ~2x Target, ROE 14.4%](https://japan-equity.com/wp-content/uploads/2026/07/p25_sq-1024x1024.jpg)
![[Obayashi] Cash Allocation — ¥420bn Investment CF Over Five Years](https://japan-equity.com/wp-content/uploads/2026/07/p26_sq-1024x1024.jpg)
![[Obayashi] Green Energy — 44 Plants, 344MW, and the Green Hydrogen Challenge](https://japan-equity.com/wp-content/uploads/2026/07/p21_sq-1024x1024.jpg)
![[Obayashi] Tackling the Labor Shortage — Robotics Construction®](https://japan-equity.com/wp-content/uploads/2026/07/p14_sq-1024x1024.jpg)
