
This article is based on publicly available IR materials and is not a recommendation to buy or sell any specific securities.
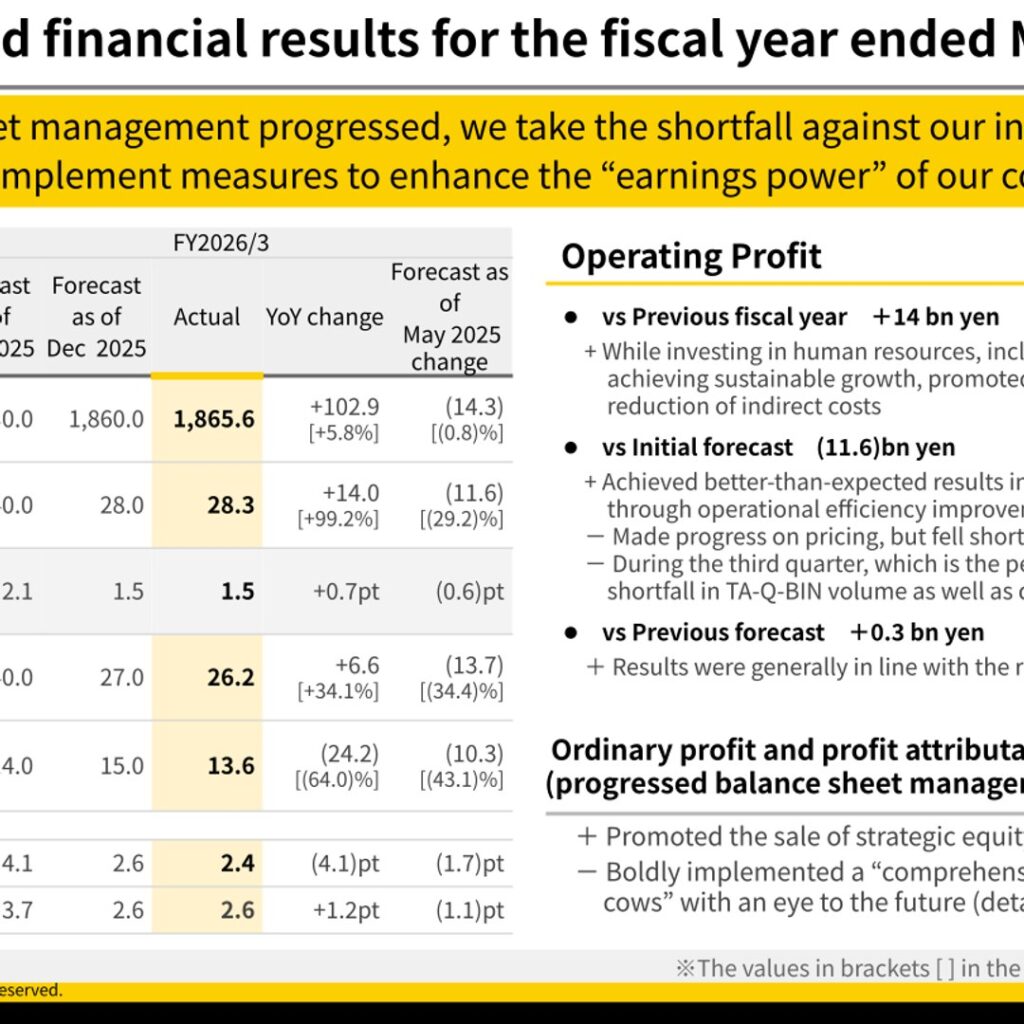
Yamato Holdings Co., Ltd. reported consolidated results for the fiscal year ended March 31, 2026, as set out in its Yamato Group IR Presentation Material dated April 30, 2026. In this article, “FY2025” refers to this fiscal year (labeled “FY2026/3” in the company’s own materials), and “FY2024” refers to the prior fiscal year ended March 31, 2025 (labeled “FY2025/3”); “FY2026” refers to the forecast fiscal year ending March 31, 2027 (labeled “FY2027/3”). Operating revenue rose 5.8% year on year to 1,865.6 billion yen, and operating profit nearly doubled, up 99.2% to 28.3 billion yen, but this fell 11.6 billion yen (-29.2%) short of the initial forecast of 40.0 billion yen issued in May 2025, due mainly to a shortfall in TA-Q-BIN volume during the peak third-quarter demand period and delays in optimizing operating costs. Profit attributable to owners of parent fell 64.0% year on year to 13.6 billion yen, reflecting a one-time extraordinary loss of approximately 13.4 billion yen from goodwill amortization related to Nakano Shokai Co., Ltd. For FY2026, the company forecasts operating profit of 42.0 billion yen, up 48.4% year on year, under a new management structure pursuing a “comprehensive review with no sacred cows,” “business portfolio transformation,” and “AI and data-driven management.”
Consolidated Results (Full-Year Actual)
The overview of consolidated financial results, in billions of yen, is as follows:
| Item | FY2025 (Actual) | FY2024 (Actual) | YoY Change |
|---|---|---|---|
| Operating revenue | 1,865.6 | 1,762.6 | +102.9 [+5.8%] |
| Operating profit | 28.3 | 14.2 | +14.0 [+99.2%] |
| Profit margin [%] | 1.5 | 0.8 | +0.7pt |
| Ordinary profit | 26.2 | 19.5 | +6.6 [+34.1%] |
| Profit attributable to owners of parent | 13.6 | 37.9 | (24.2) [(64.0)%] |
| ROE [%] | 2.4 | 6.5 | (4.1)pt |
| ROIC [%] | 2.6 | 1.4 | +1.2pt |
Against the initial FY2025 forecast issued in May 2025 (operating profit of 40.0 billion yen), actual operating profit of 28.3 billion yen was 11.6 billion yen [-29.2%] lower; against the revised forecast issued in December 2025 (28.0 billion yen), actual results were 0.3 billion yen higher. The company attributes the shortfall against the initial forecast primarily to delays in optimizing operating costs (-9.8 billion yen impact) and sluggish progress in pricing optimization (-5.3 billion yen impact), partly offset by better-than-expected results in indirect cost control (+1.6 billion yen) and cost inflation/human capital investment being controlled within initial projections (+3.5 billion yen).
Segment Results
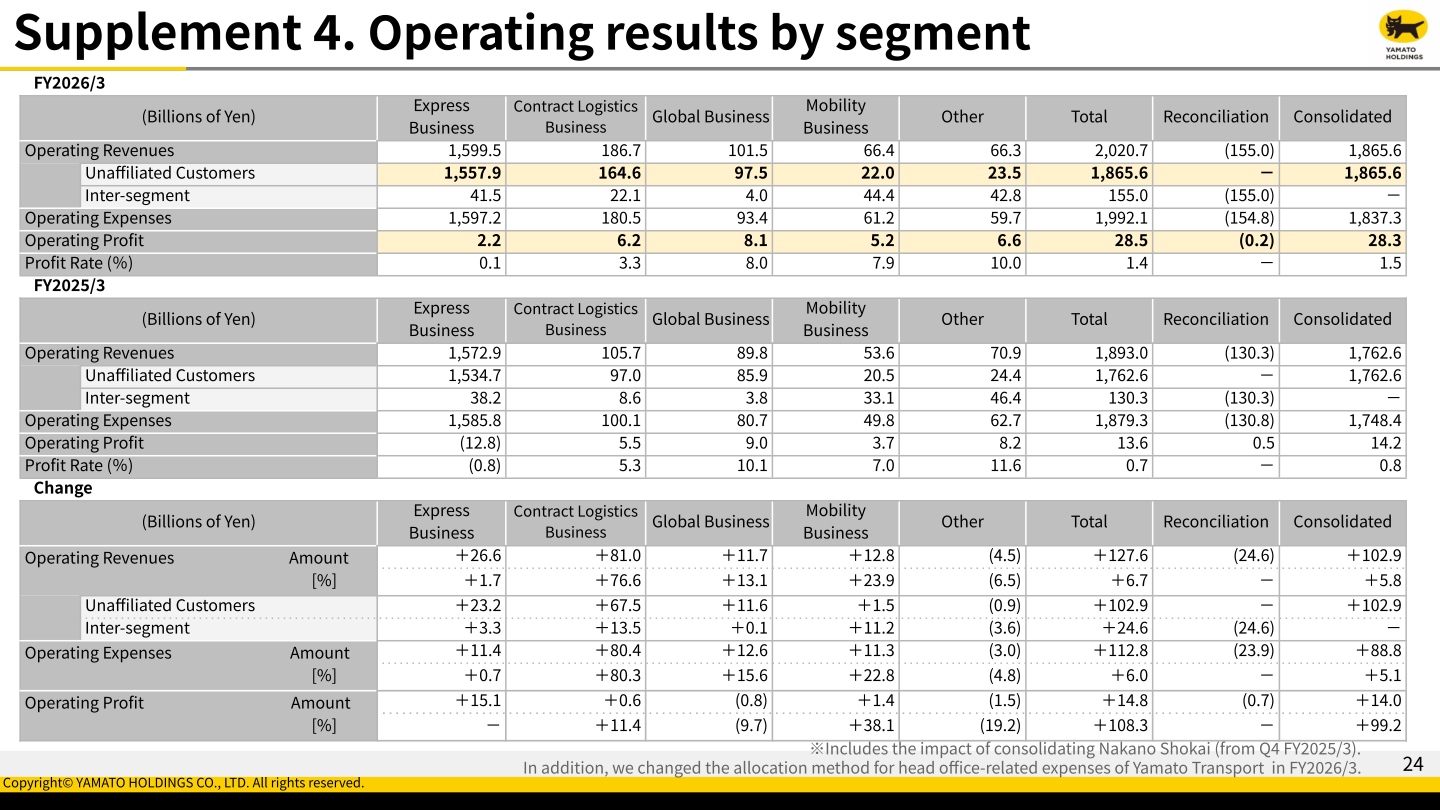
Yamato Holdings reports results across the segments used in its own materials: Express Business, Contract Logistics Business, Global Business, Mobility Business, and Other. In FY2025, the Express Business narrowed its operating loss to a small operating profit, while the Contract Logistics Business and Global Business remained profitable; the Contract Logistics Business in particular saw operating revenue increase significantly, which the company attributes to the impact of consolidating Nakano Shokai Co., Ltd. (from Q4 FY2025/3) and a change in the allocation method for Yamato Transport’s head office-related expenses in FY2025.
| Segment | Operating Revenue FY2025 | Operating Revenue FY2024 | Operating Profit FY2025 | Operating Profit FY2024 | Profit Rate FY2025 [%] | Profit Rate FY2024 [%] |
|---|---|---|---|---|---|---|
| Express Business | 1,599.5 | 1,572.9 | 2.2 | (12.8) | 0.1 | (0.8) |
| Contract Logistics Business | 186.7 | 105.7 | 6.2 | 5.5 | 3.3 | 5.3 |
| Global Business | 101.5 | 89.8 | 8.1 | 9.0 | 8.0 | 10.1 |
| Mobility Business | 66.4 | 53.6 | 5.2 | 3.7 | 7.9 | 7.0 |
| Other | 66.3 | 70.9 | 6.6 | 8.2 | 10.0 | 11.6 |
| Total | 2,020.7 | 1,893.0 | 28.5 | 13.6 | 1.4 | 0.7 |
| Reconciliation | (155.0) | (130.3) | (0.2) | 0.5 | - | - |
| Consolidated | 1,865.6 | 1,762.6 | 28.3 | 14.2 | 1.5 | 0.8 |
FY2026 Forecast
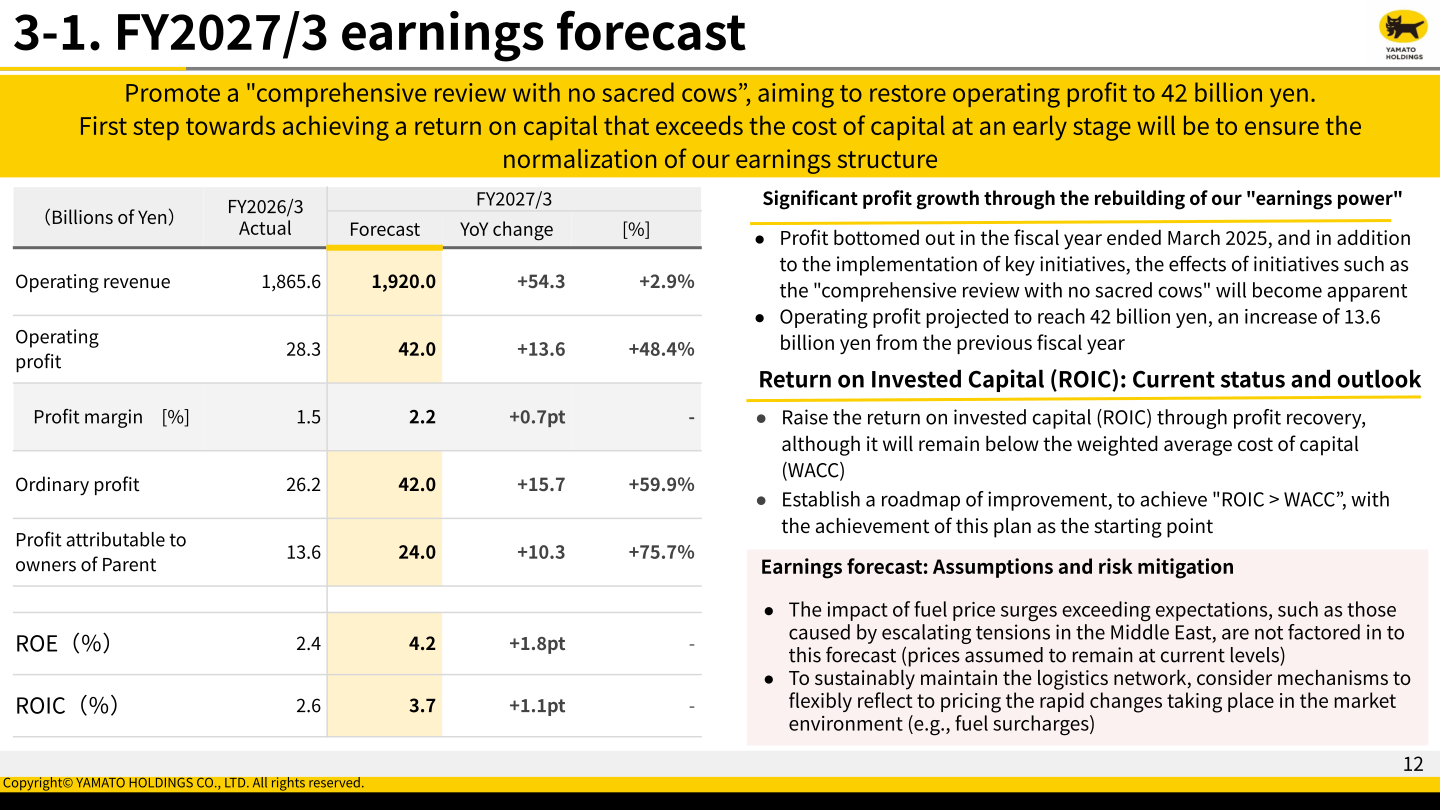
For FY2026, Yamato Holdings forecasts consolidated operating revenue of 1,920.0 billion yen (+2.9% year on year) and operating profit of 42.0 billion yen (+48.4% year on year), to be driven by three key policies aligned with the four profit growth drivers: Policy 1, comprehensive review with no sacred cows (optimize pricing and operating costs), expected to contribute +25 billion yen; Policy 2, business portfolio transformation (growth of business for corporates), expected to contribute +5 billion yen; and Policy 3, AI and data-driven management (indirect costs control), expected to contribute +3.7 billion yen. The forecast assumes fuel prices remain at current levels and does not factor in the impact of fuel price surges exceeding expectations, such as those arising from escalating tensions in the Middle East, which the company estimates could reduce operating profit by approximately 20 billion yen if such risks materialize.
| Item | FY2026 Forecast | FY2025 (Actual) | YoY Change |
|---|---|---|---|
| Operating revenue | 1,920.0 | 1,865.6 | +54.3 [+2.9%] |
| Operating profit | 42.0 | 28.3 | +13.6 [+48.4%] |
| Profit margin [%] | 2.2 | 1.5 | +0.7pt |
| Ordinary profit | 42.0 | 26.2 | +15.7 [+59.9%] |
| Profit attributable to owners of parent | 24.0 | 13.6 | +10.3 [+75.7%] |
| ROE [%] | 4.2 | 2.4 | +1.8pt |
| ROIC [%] | 3.7 | 2.6 | +1.1pt |
| Segment | Operating Revenue FY2026 Forecast [%] | Operating Revenue FY2025 Actual [%] | Operating Profit FY2026 Forecast [%] | Operating Profit FY2025 Actual [%] |
|---|---|---|---|---|
| Express Business | 1,593.8 (83.0) | 1,557.9 (83.5) | 12.1 (28.1) | 2.2 (8.1) |
| Contract Logistics Business | 171.6 (8.9) | 164.6 (8.8) | 9.5 (22.0) | 6.2 (21.8) |
| Global Business | 108.6 (5.7) | 97.5 (5.2) | 9.9 (23.0) | 8.1 (28.6) |
| Mobility Business | 22.3 (1.2) | 22.0 (1.2) | 5.3 (12.3) | 5.2 (18.3) |
| Other | 23.7 (1.2) | 23.5 (1.3) | 6.3 (14.6) | 6.6 (23.2) |
| Total | 1,920.0 (100.0) | 1,865.6 (100.0) | 43.1 (100.0) | 28.5 (100.0) |
| Reconciliation | - | - | (1.1) | (0.2) |
| Consolidated | 1,920.0 | 1,865.6 | 42.0 | 28.3 |
Shareholder Returns
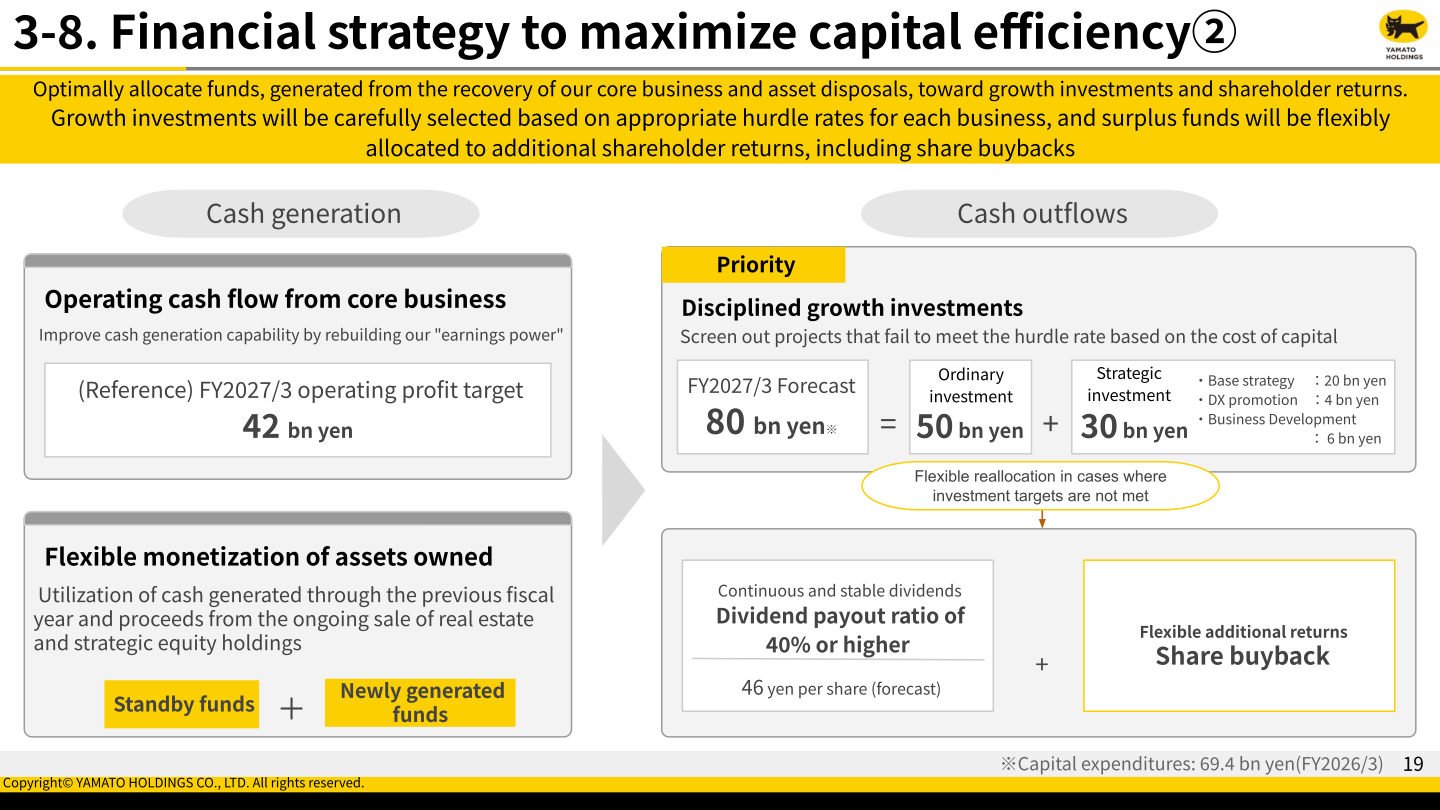
Yamato Holdings targets a dividend payout ratio of 40% or higher, prioritizing dividend stability and continuity while being mindful of DOE (dividends on equity), and aims to grow dividend per share over time. Dividend per share was 46 yen for FY2025, and the company forecasts a dividend of 46 yen per share for FY2026 as well. The company also considers flexible additional shareholder returns, including share buybacks, to improve capital efficiency, and has raised its dividend payout ratio target from the level set in the mid-term plan SX2030. Historically, the company has raised dividends in connection with milestone anniversaries, including a 2 yen increase for the TA-Q-BIN 40th Anniversary and a 10 yen increase for the 100th Anniversary.
Medium-Term Plan / Topics
Under the new management structure, Yamato Holdings advanced balance sheet management in FY2025: it completed the liquidation of a total of 20 properties, including large-scale non-business real estate, with a book value of approximately 23.7 billion yen and disposal proceeds of approximately 41.1 billion yen, and sold strategic equity holdings with a book value of approximately 0.7 billion yen for sale proceeds of approximately 3.1 billion yen. The company also booked a one-time extraordinary loss of approximately 13.4 billion yen for goodwill amortization related to Nakano Shokai Co., Ltd., reflecting a rigorous re-evaluation of that subsidiary’s business plan under the new management structure; this is expected to reduce the amortization burden starting from FY2026. The equity ratio stood at 44.6% as of March 31, 2026 (down from 46.5% a year earlier), which the company positions as maintaining its target level of approximately 45%. For FY2026, the company plans capital expenditure/investment of 80 billion yen, comprising 50 billion yen of ordinary investment and 30 billion yen of strategic investment (20 billion yen for base strategy, 4 billion yen for DX promotion, and 6 billion yen for business development).
This article is an analysis based on publicly available information and is not a recommendation to buy or sell any specific securities. Investment decisions are your own responsibility.
![[Obayashi] Investors’ Guide 2026 — The Complete 24-Article Breakdown](https://japan-equity.com/wp-content/uploads/2026/07/hub_cover-1024x1024.png)
![[Obayashi] IR & SR Policy — Feeding Dialogue Back into Management](https://japan-equity.com/wp-content/uploads/2026/07/p32_sq-1024x1024.jpg)
![[Obayashi] Domestic Civil Engineering — Resilience Spending Supports 9.6% Margin](https://japan-equity.com/wp-content/uploads/2026/07/p11_sq-1024x1024.jpg)
![[Obayashi] Overseas Construction — Orders Reach ¥1.2tn](https://japan-equity.com/wp-content/uploads/2026/07/p15_sq-1024x1024.jpg)
![[Obayashi] Share Price & External Ratings — vs TOPIX, ESG Index Inclusion](https://japan-equity.com/wp-content/uploads/2026/07/p40_sq-1024x1024.jpg)
![[Construction] ¥75.5tn Investment, Shrinking Workforce — Big-5 Market Share](https://japan-equity.com/wp-content/uploads/2026/07/p12_sq-1024x1024.jpg)



![[Obayashi] Capital Policy & Shareholder Returns — ROE 10%+, DOE ~5%, ¥100bn Buyback](https://japan-equity.com/wp-content/uploads/2026/07/p27_sq-1024x1024.jpg)
![[Obayashi] Reducing Cross-Shareholdings — ¥285.2bn Sold in Five Years](https://japan-equity.com/wp-content/uploads/2026/07/p29_sq-1024x1024.jpg)
![[Obayashi] ¥750bn Investment Plan — ¥300bn to Development, ¥190bn to Tech/DX](https://japan-equity.com/wp-content/uploads/2026/07/p30_sq-1024x1024.jpg)
![[Obayashi] MTP2022 KPIs — Operating Profit ~2x Target, ROE 14.4%](https://japan-equity.com/wp-content/uploads/2026/07/p25_sq-1024x1024.jpg)
![[Obayashi] Cash Allocation — ¥420bn Investment CF Over Five Years](https://japan-equity.com/wp-content/uploads/2026/07/p26_sq-1024x1024.jpg)
![[Obayashi] Green Energy — 44 Plants, 344MW, and the Green Hydrogen Challenge](https://japan-equity.com/wp-content/uploads/2026/07/p21_sq-1024x1024.jpg)
![[Obayashi] Tackling the Labor Shortage — Robotics Construction®](https://japan-equity.com/wp-content/uploads/2026/07/p14_sq-1024x1024.jpg)
