
This article is based on publicly available IR materials and is not a recommendation to buy or sell any specific securities.
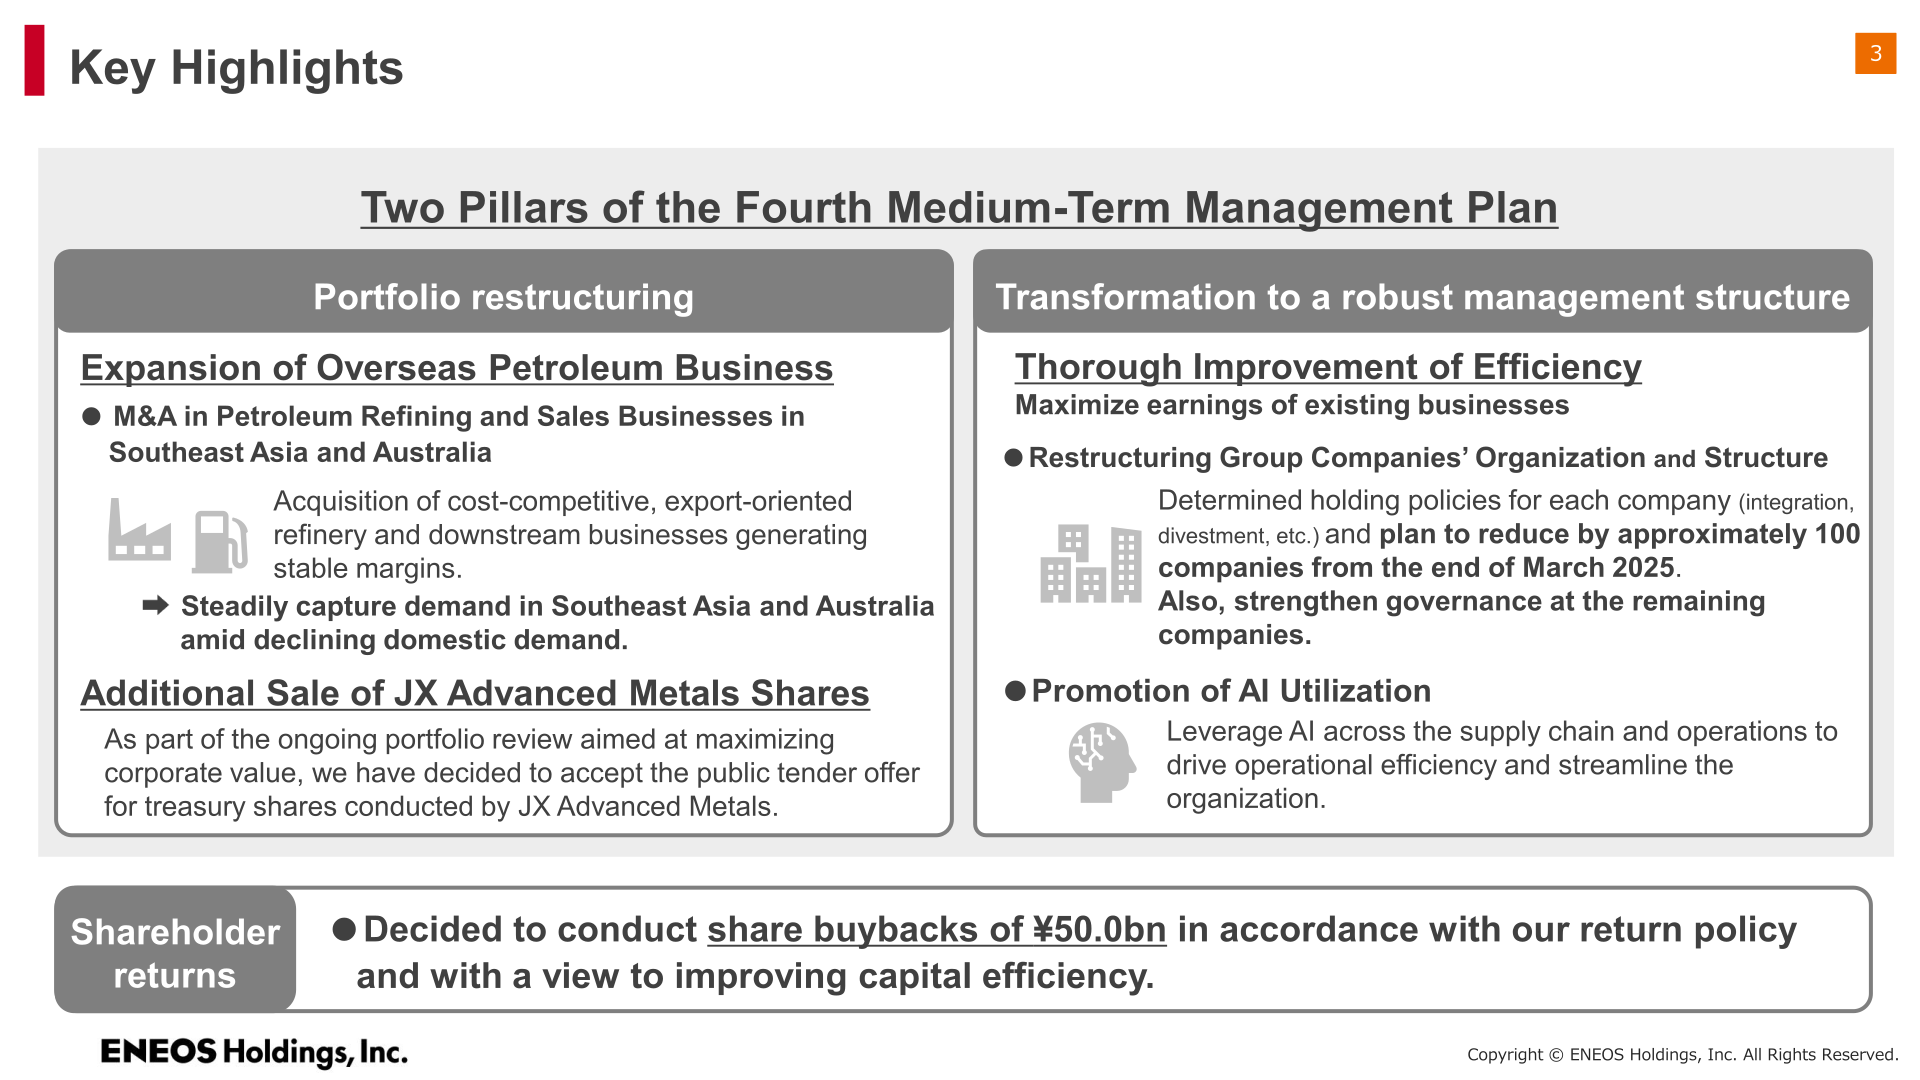
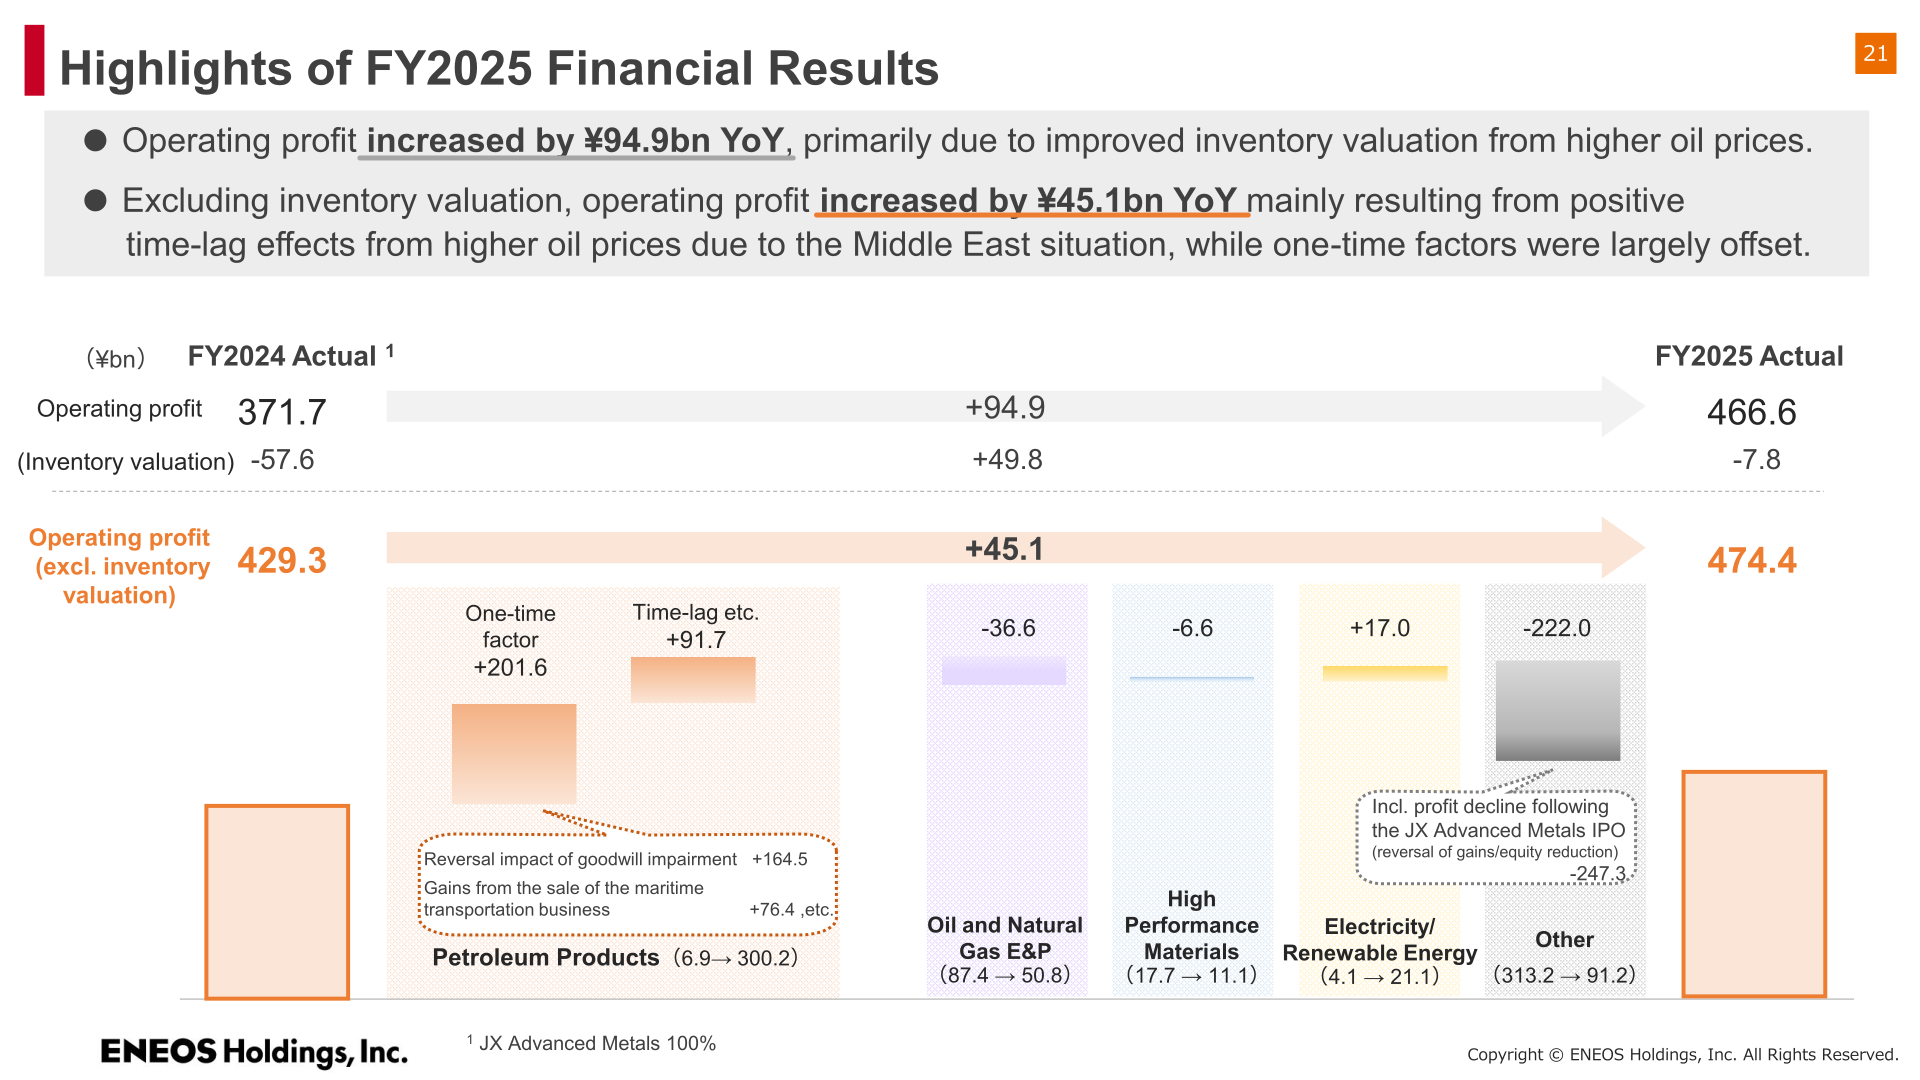
ENEOS Holdings reported FY2025 (fiscal year ended March 31, 2026) operating profit of ¥466.6 billion, up ¥94.9 billion (+26%) year on year, primarily due to improved inventory valuation from higher oil prices. Excluding inventory valuation, operating profit increased ¥45.1 billion (+11%) to ¥474.4 billion, driven mainly by positive time-lag effects from higher oil prices linked to the Middle East situation, while one-time factors were largely offset. Profit attributable to owners of the parent rose ¥32.6 billion (+14%) to ¥258.7 billion. For FY2026, the company forecasts operating profit of ¥610.0 billion (+31% YoY) and profit attributable to owners of the parent of ¥415.0 billion (+60% YoY).
Consolidated Results (Full-Year Actual)
Crude oil (Dubai) averaged $72/B in FY2025, down $7 (-9%) year on year, while the exchange rate averaged ¥151/$, down ¥2 (-1%). Revenue declined 10% to ¥11,765.5 billion. Note: per the source materials, FY2024 figures include discontinued operations in revenue, operating profit, finance income, and profit before tax.
| Item | FY2024 Actual | FY2025 Actual | Change |
|---|---|---|---|
| Crude oil (Dubai) ($/B) | 79 | 72 | -7 (-9%) |
| Exchange rate (¥/$) | 153 | 151 | -2 (-1%) |
| Revenue (¥bn) | 13,035.7 | 11,765.5 | -1,270.2 (-10%) |
| Operating profit (¥bn) | 371.7 | 466.6 | +94.9 (+26%) |
| Inventory valuation (¥bn) | -57.6 | -7.8 | +49.8 |
| Finance income (¥bn) | -22.4 | -17.8 | +4.6 |
| Profit before tax (¥bn) | 349.3 | 448.8 | +99.5 (+28%) |
| Profit attributable to owners of the parent (¥bn) | 226.1 | 258.7 | +32.6 (+14%) |
| Operating profit excl. inventory valuation (¥bn) | 429.3 | 474.4 | +45.1 (+11%) |
| Profit attributable to owners of the parent excl. inventory valuation (¥bn) | 266.4 | 264.2 | -2.2 (-1%) |
Segment Results
By segment (operating profit, excl. inventory valuation basis where applicable), Petroleum Products swung to ¥300.2 billion excl. inventory valuation from ¥6.9 billion in FY2024, up ¥293.3 billion, while including inventory valuation, Petroleum Products total operating profit was ¥292.4 billion versus -¥50.7 billion in FY2024, up ¥343.1 billion. Oil and Natural Gas E&P declined ¥36.6 billion (-42%) to ¥50.8 billion, and High Performance Materials fell ¥6.6 billion (-37%) to ¥11.1 billion. Electricity rose ¥1.0 billion (+5%) to ¥22.0 billion, and Renewable Energy narrowed its loss by ¥16.0 billion to -¥0.9 billion. The Other segment declined ¥222.0 billion (-71%) to ¥91.2 billion, reflecting a ¥66.9 billion (-60%) decrease in Metals to ¥44.2 billion (the Metals business was deconsolidated and is classified under Other from FY2025) and a ¥155.1 billion (-77%) decrease in NIPPO, consolidation adjustment, etc. to ¥47.0 billion.
| Segment | FY2024 Actual (¥bn) | FY2025 Actual (¥bn) | Change |
|---|---|---|---|
| Operating Profit (excl. inventory valuation), Total | 429.3 | 474.4 | +45.1 (+11%) |
| Petroleum Products (total, incl. inventory valuation) | -50.7 | 292.4 | +343.1 |
| Inventory valuation | -57.6 | -7.8 | +49.8 |
| Petroleum Products excl. inventory valuation | 6.9 | 300.2 | +293.3 |
| Oil and Natural Gas E&P | 87.4 | 50.8 | -36.6 (-42%) |
| High Performance Materials | 17.7 | 11.1 | -6.6 (-37%) |
| Electricity | 21.0 | 22.0 | +1.0 (+5%) |
| Renewable Energy | -16.9 | -0.9 | +16.0 |
| Other | 313.2 | 91.2 | -222.0 (-71%) |
| of which: Metals | 111.1 | 44.2 | -66.9 (-60%) |
| of which: NIPPO, consolidation adjustment, etc. | 202.1 | 47.0 | -155.1 (-77%) |
FY2026 Forecast
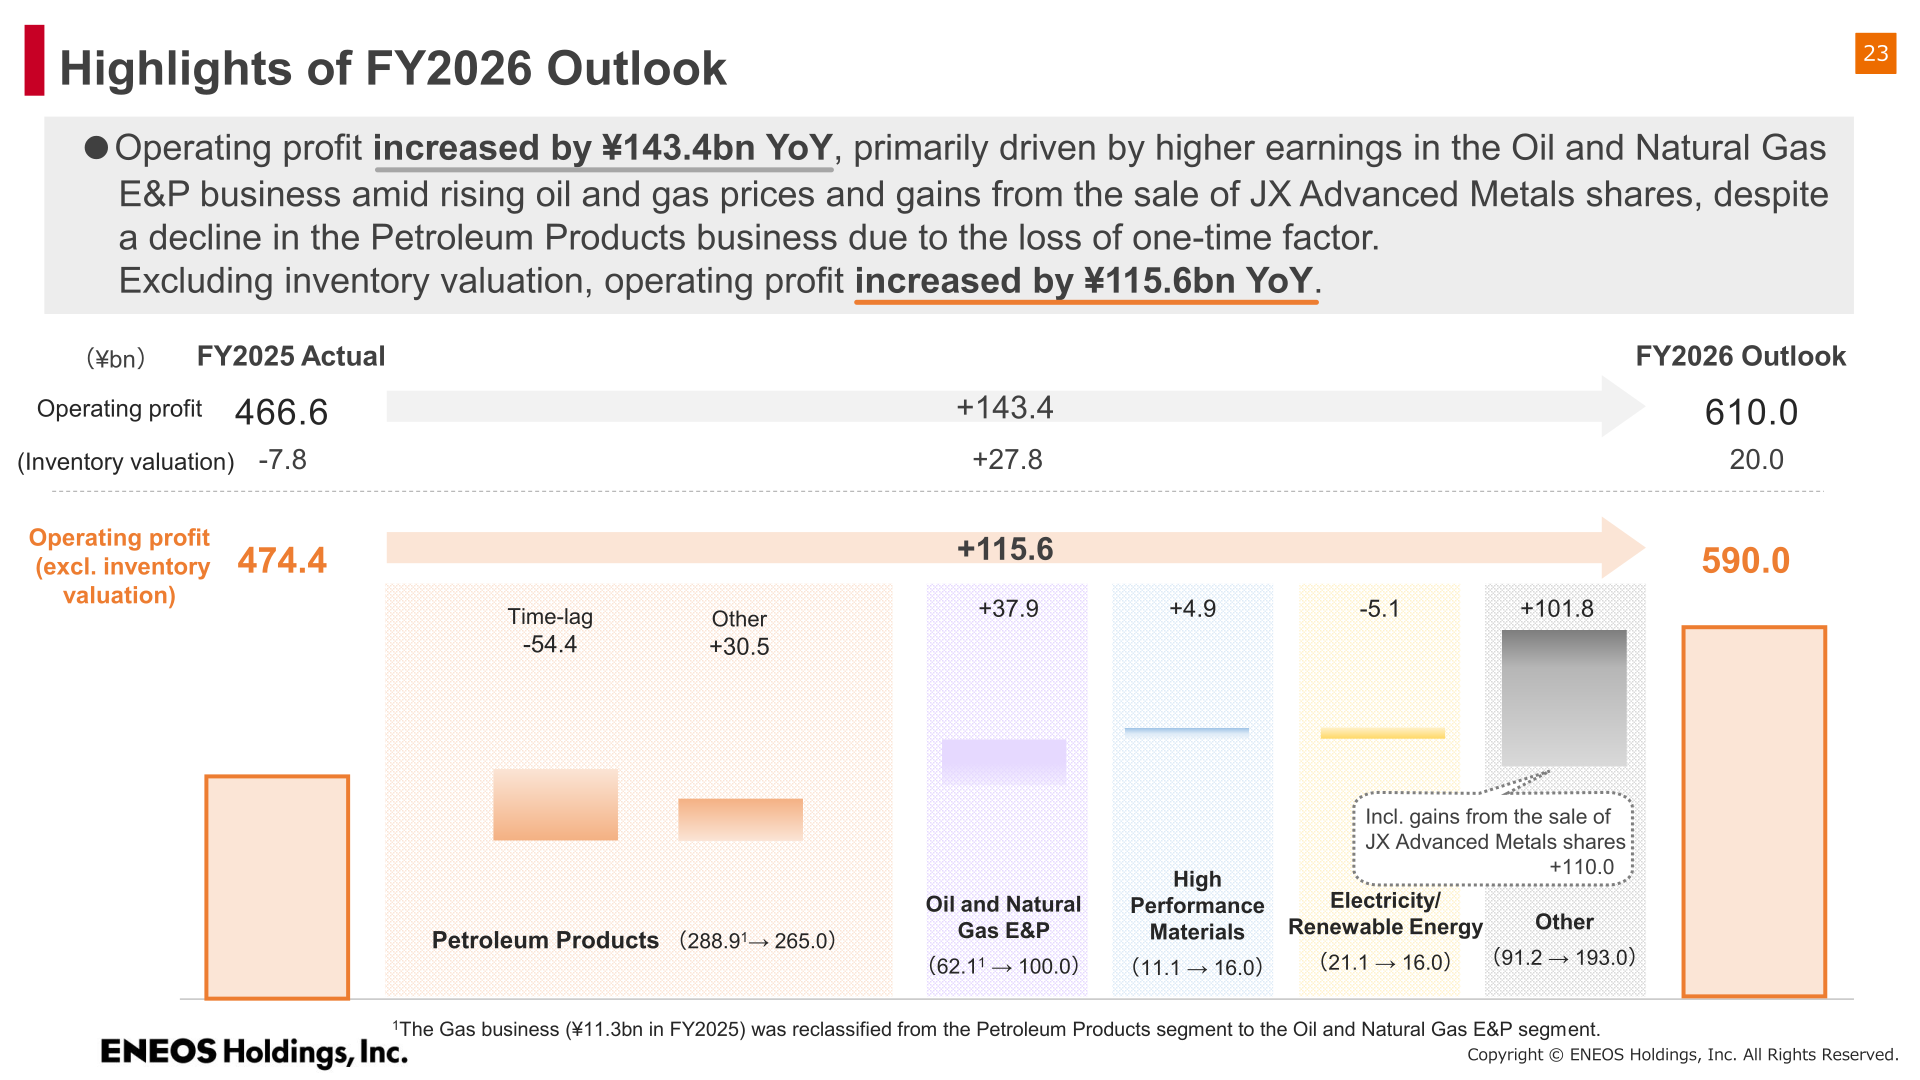
For FY2026, ENEOS forecasts operating profit of ¥610.0 billion, up ¥143.4 billion (+31%), primarily driven by higher earnings in the Oil and Natural Gas E&P business amid rising oil and gas prices and gains from the sale of JX Advanced Metals shares, despite a decline in the Petroleum Products business due to the loss of a one-time factor. Excluding inventory valuation, operating profit is forecast to increase ¥115.6 billion (+24%) to ¥590.0 billion. The outlook assumes a Dubai crude oil price of $110/B for April-May 2026 and $80/B for June 2026-March 2027, and an exchange rate of ¥155/$.
| Item | FY2025 Actual | FY2026 Outlook | Change |
|---|---|---|---|
| Crude oil (Dubai) ($/B) | 72 | 85 | +13 (+18%) |
| Exchange rate (¥/$) | 151 | 155 | +4 (+3%) |
| Revenue (¥bn) | 11,765.5 | 12,850.0 | +1,084.5 (+9%) |
| Operating profit (¥bn) | 466.6 | 610.0 | +143.4 (+31%) |
| Inventory valuation (¥bn) | -7.8 | 20.0 | +27.8 |
| Finance income (¥bn) | -17.8 | -20.0 | -2.2 |
| Profit before tax (¥bn) | 448.8 | 590.0 | +141.2 (+31%) |
| Profit attributable to owners of the parent (¥bn) | 258.7 | 415.0 | +156.3 (+60%) |
| Operating profit excl. inventory valuation (¥bn) | 474.4 | 590.0 | +115.6 (+24%) |
| Profit attributable to owners of the parent excl. inventory valuation (¥bn) | 264.2 | 400.0 | +135.8 (+51%) |
| Segment | FY2025 Actual (¥bn) | FY2026 Outlook (¥bn) | Change |
|---|---|---|---|
| Operating Profit (excl. inventory valuation), Total | 474.4 | 590.0 | +115.6 (+24%) |
| Petroleum Products (total, incl. inventory valuation) | 281.1 | 285.0 | +3.9 (+1%) |
| Inventory valuation | -7.8 | 20.0 | +27.8 |
| Petroleum Products excl. inventory valuation | 288.9 | 265.0 | -23.9 (-8%) |
| Oil and Natural Gas E&P | 62.1 | 100.0 | +37.9 (+61%) |
| High Performance Materials | 11.1 | 16.0 | +4.9 (+44%) |
| Electricity | 22.0 | 15.0 | -7.0 (-32%) |
| Renewable Energy | -0.9 | 1.0 | +1.9 |
| Other | 91.2 | 193.0 | +101.8 (+112%) |
| of which: Metals | 44.2 | 40.0 | -4.2 (-10%) |
| of which: NIPPO, consolidation adjustment, etc. | 47.0 | 153.0 | +106.0 (+226%) |
Note: per the source materials, ¥11.3 billion of operating profit from the natural gas business was reclassified from the Petroleum Products segment to the Oil and Natural Gas E&P segment following the transfer to ENEOS Xplora on April 1, 2026.
Shareholder Returns
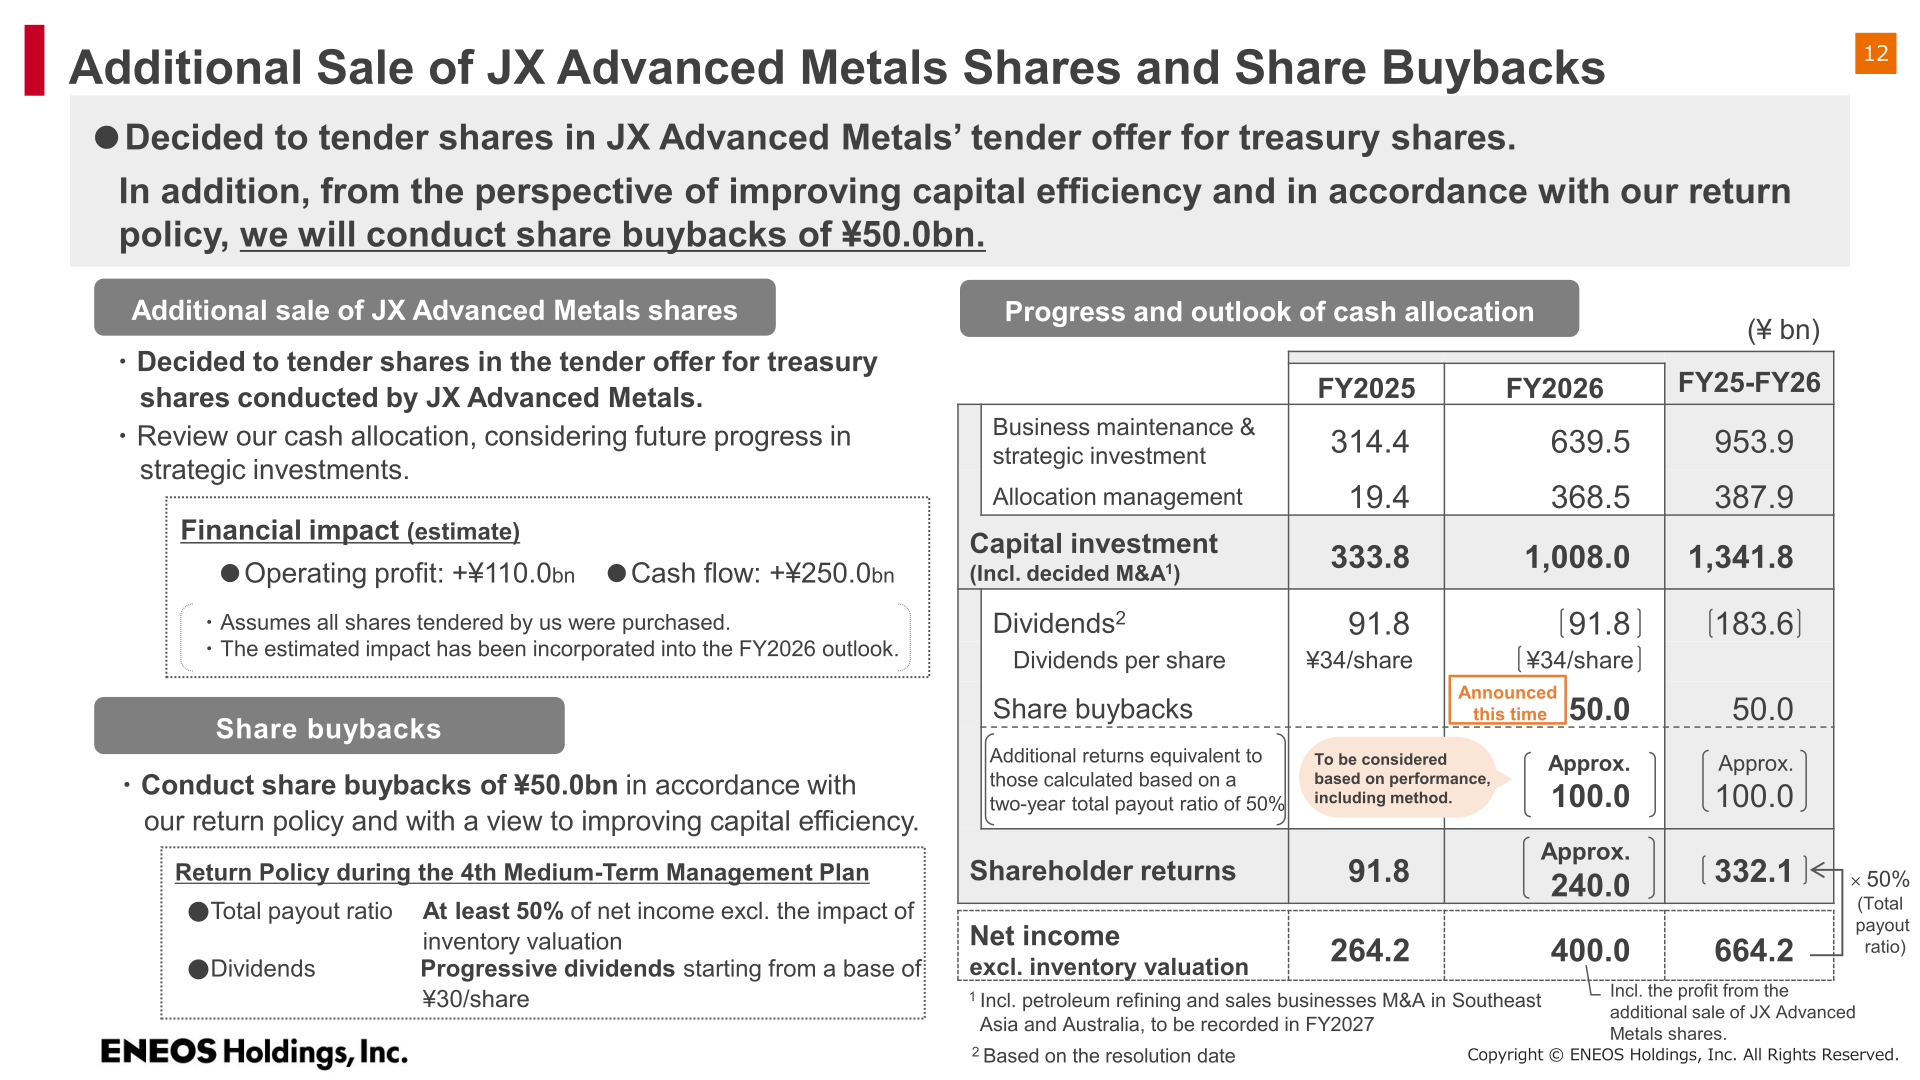
Under the Return Policy of the Fourth Medium-Term Management Plan, ENEOS targets a total payout ratio of at least 50% of net income excluding the impact of inventory valuation, with progressive dividends starting from a base of ¥30/share. The company has decided to conduct share buybacks of ¥50.0 billion in accordance with this policy and with a view to improving capital efficiency, and has also decided to tender shares in the tender offer for treasury shares conducted by JX Advanced Metals. The estimated financial impact of the additional sale of JX Advanced Metals shares is +¥110.0 billion to operating profit and +¥250.0 billion to cash flow, and this has been incorporated into the FY2026 outlook. Dividends per share are ¥34/share for both FY2025 and FY2026.
| Item | FY2025 | FY2026 | FY25-FY26 Total |
|---|---|---|---|
| Business maintenance & strategic investment (¥bn) | 314.4 | 639.5 | 953.9 |
| Allocation management (¥bn) | 19.4 | 368.5 | 387.9 |
| Capital investment, incl. decided M&A (¥bn) | 333.8 | 1,008.0 | 1,341.8 |
| Dividends (¥bn) | 91.8 | 91.8 | 183.6 |
| Dividends per share | ¥34/share | ¥34/share | – |
| Share buybacks (¥bn) | 50.0 | 50.0 | Approx. 100.0 |
| Shareholder returns (¥bn) | 91.8 | Approx. 240.0 | 332.1 |
| Net income excl. inventory valuation (¥bn) | 264.2 | 400.0 | 664.2 |
Medium-Term Plan / Topics
ENEOS’s Fourth Medium-Term Management Plan centers on two pillars: portfolio restructuring and transformation to a robust management structure. Under portfolio restructuring, the company has agreed to acquire, through a newly established special purpose vehicle, 100% of the shares of certain Chevron Corporation subsidiaries’ petroleum refining and sales businesses in Southeast Asia and Australia (assets in Singapore, Malaysia, Australia, the Philippines, Vietnam and Indonesia), for an acquisition cost of US$2,170 million (approximately ¥336.0 billion, converted at an exchange rate of US$1=¥155), with closing expected in 2027. The company targets EBITDA of US$380 million and operating profit of US$250 million from this business under its FY2030 Plan. ENEOS also plans to reduce the number of consolidated subsidiaries (excluding the NIPPO Group and paper companies, etc.) to approximately 170, a reduction of about 100 companies from March 31, 2025; as of March 31, 2026, the number had already decreased by 13 companies to 262. Separately, in April 2026, Group company ENEOS WING Corporation was made the subject of a criminal complaint filed by the Japan Fair Trade Commission on suspicion of violating the Antimonopoly Act and was, the same day, indicted by the Tokyo District Public Prosecutors Office; the company states it will accelerate the reduction of Group companies and work to prevent recurrence through measures such as strengthening internal audits and enhancing training programs for management of Group companies, and will consider matters such as the responsibility of relevant individuals based on the final outcomes.
This article is an analysis based on publicly available information and is not a recommendation to buy or sell any specific securities. Investment decisions are your own responsibility.
![[Obayashi] Investors’ Guide 2026 — The Complete 24-Article Breakdown](https://japan-equity.com/wp-content/uploads/2026/07/hub_cover-1024x1024.png)
![[Obayashi] IR & SR Policy — Feeding Dialogue Back into Management](https://japan-equity.com/wp-content/uploads/2026/07/p32_sq-1024x1024.jpg)
![[Obayashi] Real Estate Development — 18.7% Margin, ¥287.7bn Unrealized Gains](https://japan-equity.com/wp-content/uploads/2026/07/p20_sq-1024x1024.jpg)
![[Obayashi] Domestic Civil Engineering — Resilience Spending Supports 9.6% Margin](https://japan-equity.com/wp-content/uploads/2026/07/p11_sq-1024x1024.jpg)
![[Obayashi] Share Price & External Ratings — vs TOPIX, ESG Index Inclusion](https://japan-equity.com/wp-content/uploads/2026/07/p40_sq-1024x1024.jpg)
![[Construction] ¥75.5tn Investment, Shrinking Workforce — Big-5 Market Share](https://japan-equity.com/wp-content/uploads/2026/07/p12_sq-1024x1024.jpg)



![[Obayashi] Capital Policy & Shareholder Returns — ROE 10%+, DOE ~5%, ¥100bn Buyback](https://japan-equity.com/wp-content/uploads/2026/07/p27_sq-1024x1024.jpg)
![[Obayashi] Reducing Cross-Shareholdings — ¥285.2bn Sold in Five Years](https://japan-equity.com/wp-content/uploads/2026/07/p29_sq-1024x1024.jpg)
![[Obayashi] ¥750bn Investment Plan — ¥300bn to Development, ¥190bn to Tech/DX](https://japan-equity.com/wp-content/uploads/2026/07/p30_sq-1024x1024.jpg)
![[Obayashi] MTP2022 KPIs — Operating Profit ~2x Target, ROE 14.4%](https://japan-equity.com/wp-content/uploads/2026/07/p25_sq-1024x1024.jpg)
![[Obayashi] Cash Allocation — ¥420bn Investment CF Over Five Years](https://japan-equity.com/wp-content/uploads/2026/07/p26_sq-1024x1024.jpg)
![[Obayashi] Green Energy — 44 Plants, 344MW, and the Green Hydrogen Challenge](https://japan-equity.com/wp-content/uploads/2026/07/p21_sq-1024x1024.jpg)
![[Obayashi] Tackling the Labor Shortage — Robotics Construction®](https://japan-equity.com/wp-content/uploads/2026/07/p14_sq-1024x1024.jpg)
