
This article is based on publicly available IR materials and is not a recommendation to buy or sell any specific securities.
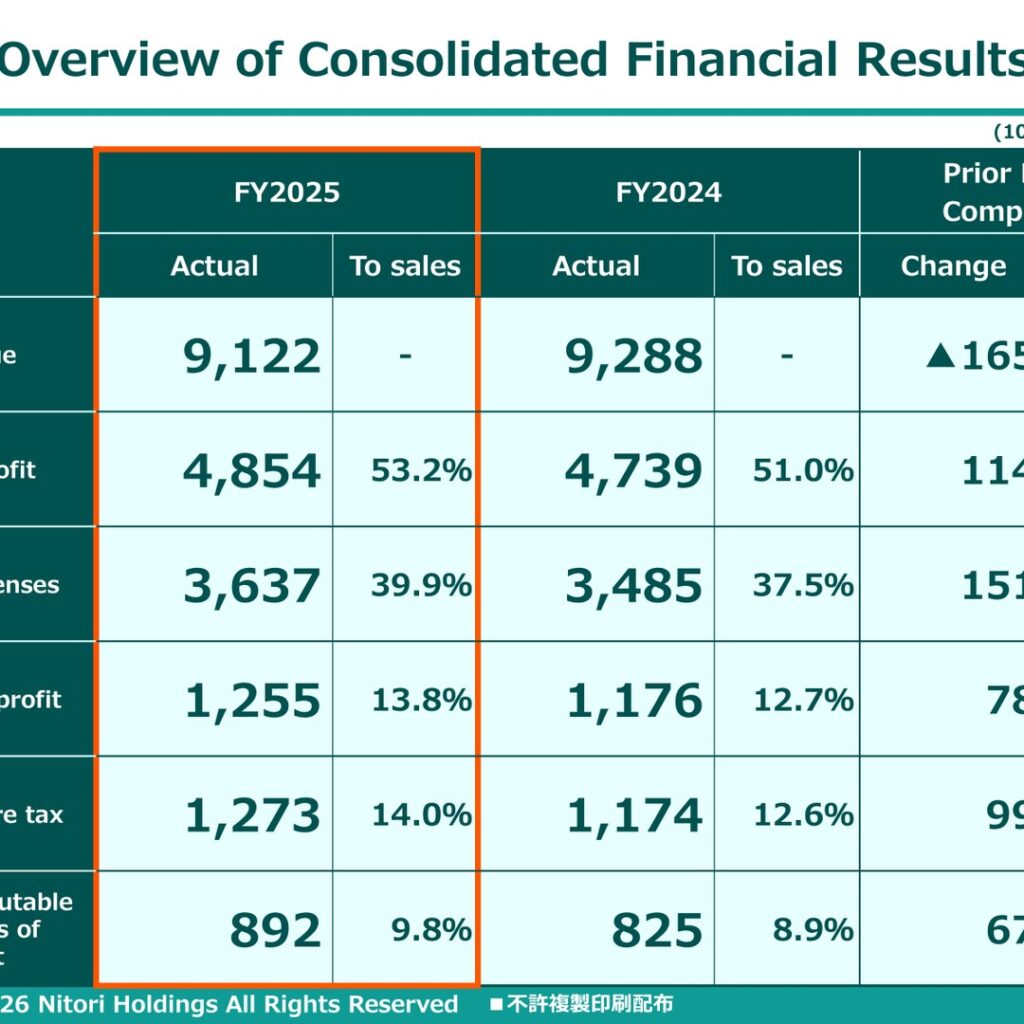
NITORI Holdings Co., Ltd. reported consolidated results for FY2025, as set out in its Financial Results Presentation for the FY2025 dated May 14, 2026. References to “FY2025” in this article follow the company’s own presentation title, corresponding to the fiscal year ended March 31, 2026 (with store data as of that date). Revenue was 9,122 (100 million yen), 98.2% of the FY2024 level (a decline of 165), while gross profit rose to 4,854 (100 million yen), up 102.4% year on year, lifting the gross profit margin to 53.2% from 51.0%. Operating profit increased 6.7% to 1,255 (100 million yen), profit before tax rose 8.4% to 1,273 (100 million yen), and profit attributable to owners of parent increased 8.1% to 892 (100 million yen).
Consolidated Results (Full-Year Actual)
The overview of consolidated financial results, in 100 million yen, with ratios to sales (“To sales”) where disclosed, is as follows:
| Item | FY2025 Actual (To sales) | FY2024 Actual (To sales) | Change | YOY |
|---|---|---|---|---|
| Revenue | 9,122 (-) | 9,288 (-) | ▲165 | 98.2% |
| Gross profit | 4,854 (53.2%) | 4,739 (51.0%) | 114 | 102.4% |
| SG&A expenses | 3,637 (39.9%) | 3,485 (37.5%) | 151 | 104.4% |
| Operating profit | 1,255 (13.8%) | 1,176 (12.7%) | 78 | 106.7% |
| Profit before tax | 1,273 (14.0%) | 1,174 (12.6%) | 99 | 108.4% |
| Profit attributable to owners of parent | 892 (9.8%) | 825 (8.9%) | 67 | 108.1% |
Segment Results
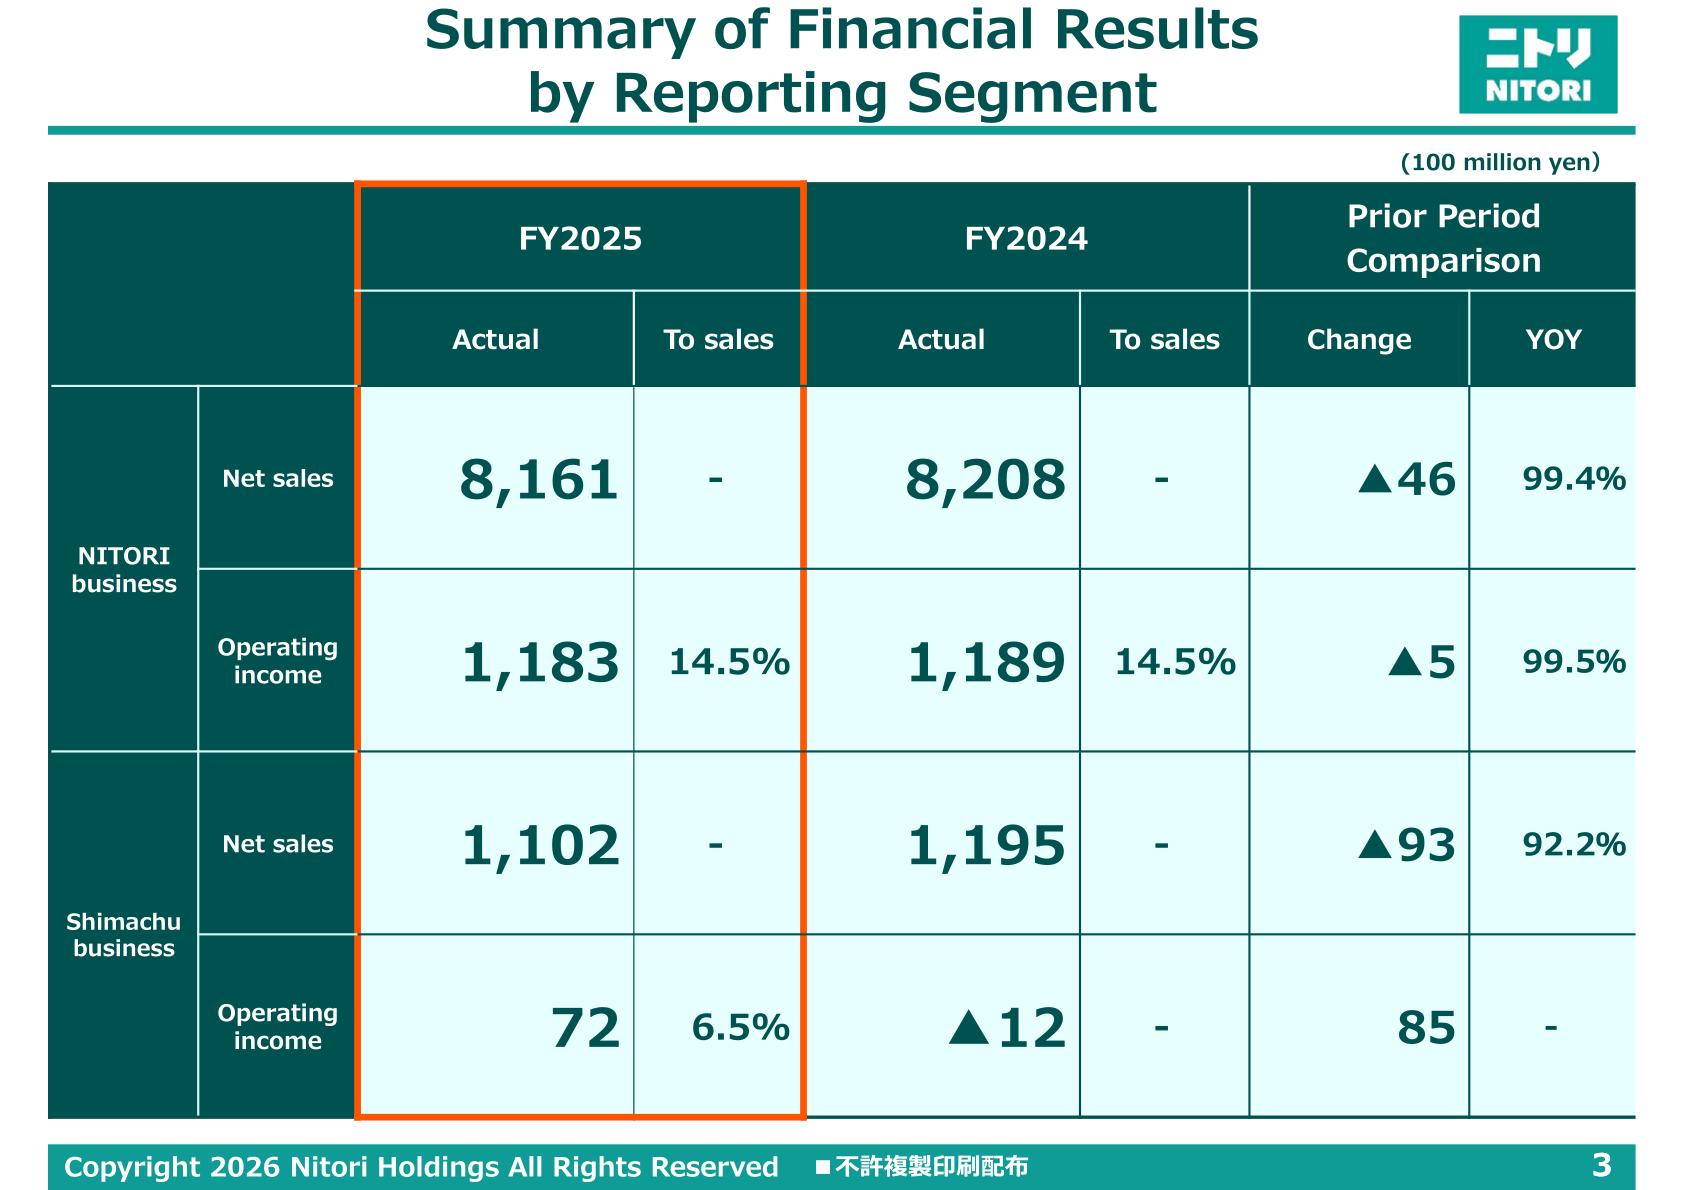
NITORI Holdings discloses results for two reporting segments, the NITORI business and the Shimachu business (in 100 million yen). In the Shimachu business, operating income turned positive at 72 (6.5% to sales) from an operating loss of ▲12 in FY2024, a change of 85; the year-on-year comparison is shown as “-” in the source material because the prior-year figure was negative.
| Segment | Metric | FY2025 | FY2024 | Change | YOY |
|---|---|---|---|---|---|
| NITORI business | Net sales | 8,161 | 8,208 | ▲46 | 99.4% |
| NITORI business | Operating income (to sales) | 1,183 (14.5%) | 1,189 (14.5%) | ▲5 | 99.5% |
| Shimachu business | Net sales | 1,102 | 1,195 | ▲93 | 92.2% |
| Shimachu business | Operating income (to sales) | 72 (6.5%) | ▲12 (-) | 85 | – |
Cost Structure
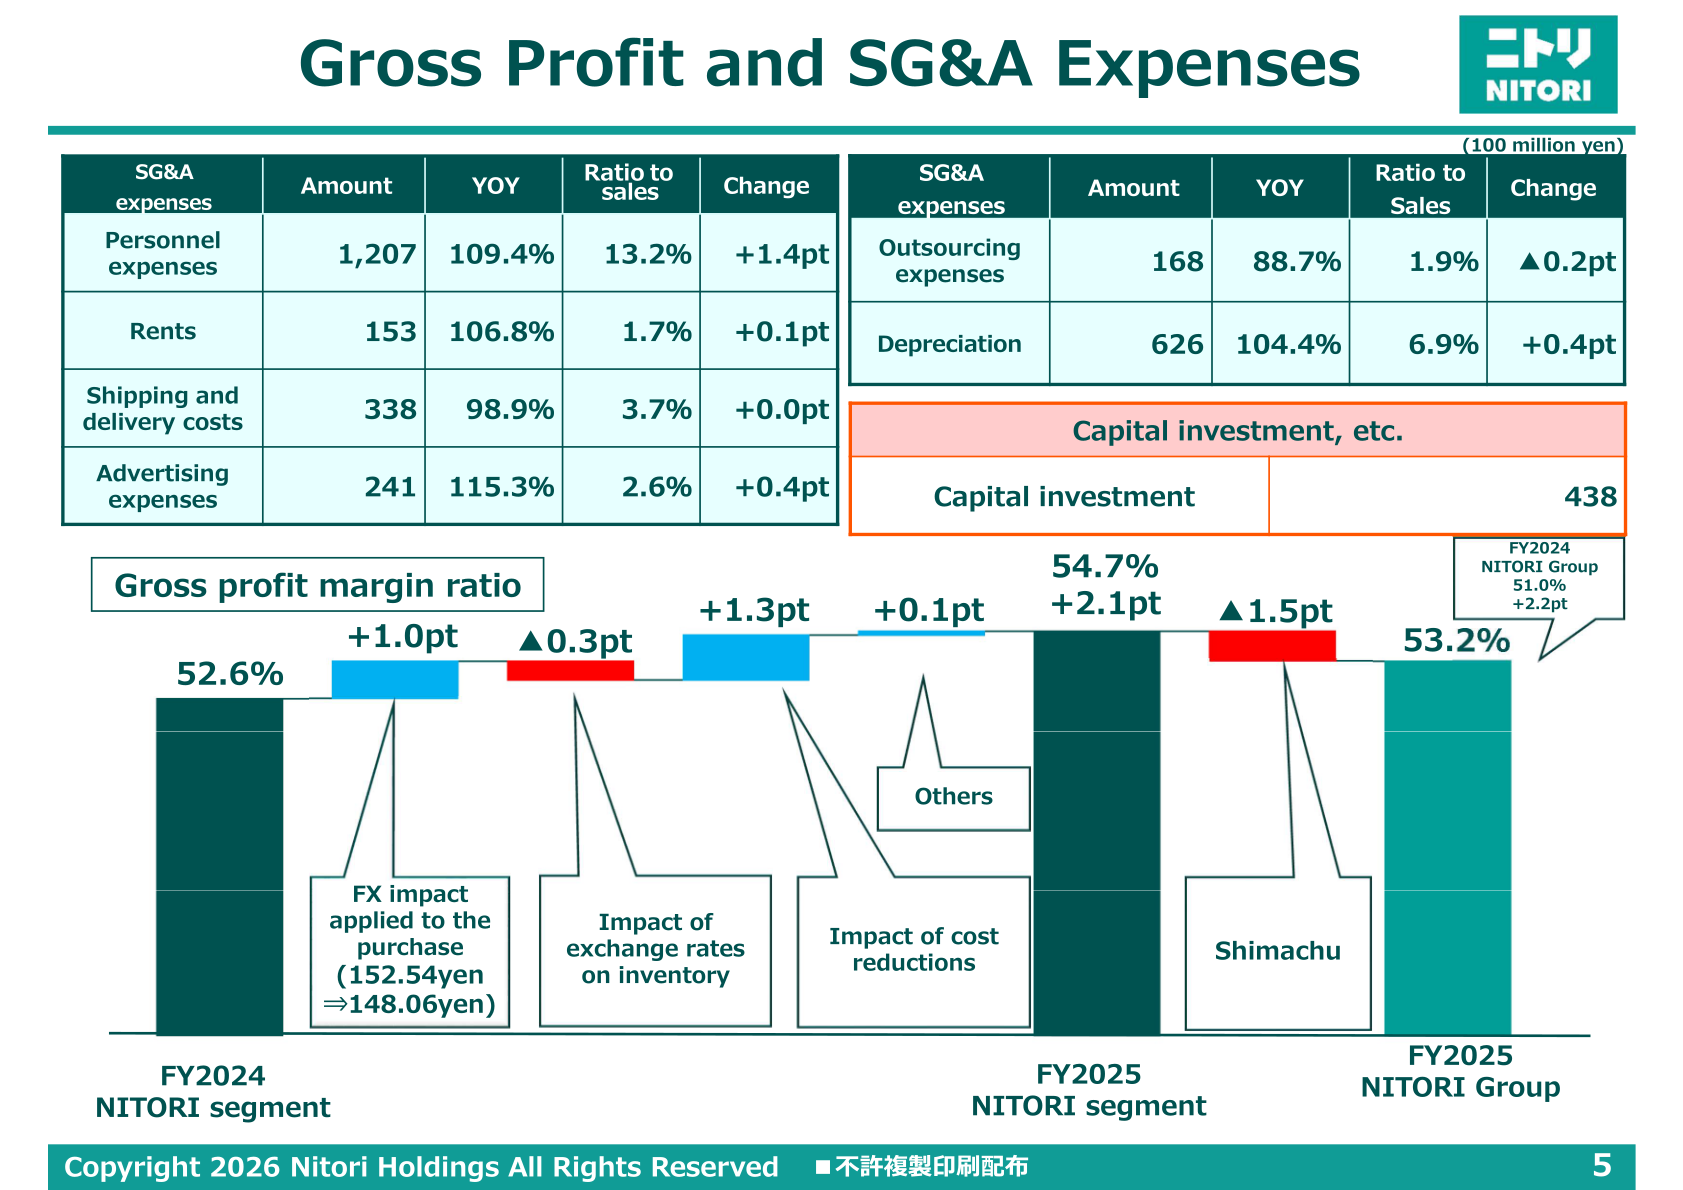
The presentation breaks down SG&A expenses by category for FY2025, with amount, year-on-year change, ratio to sales, and the change in that ratio (in 100 million yen):
| SG&A Item | FY2025 Amount | YOY | Ratio to Sales | Change |
|---|---|---|---|---|
| Personnel expenses | 1,207 | 109.4% | 13.2% | +1.4pt |
| Rents | 153 | 106.8% | 1.7% | +0.1pt |
| Shipping and delivery costs | 338 | 98.9% | 3.7% | +0.0pt |
| Advertising expenses | 241 | 115.3% | 2.6% | +0.4pt |
| Outsourcing expenses | 168 | 88.7% | 1.9% | ▲0.2pt |
| Depreciation | 626 | 104.4% | 6.9% | +0.4pt |
Capital investment was 438 (100 million yen). The gross profit margin ratio for the NITORI segment was 54.7% in FY2025 versus 52.6% in FY2024, and for the NITORI Group overall it was 53.2% in FY2025 versus 51.0% in FY2024. The presentation attributes part of this margin improvement to the foreign exchange rate applied to purchasing, which moved from 152.54 yen to 148.06 yen per dollar, as well as to cost reduction efforts, partly offset by the impact of exchange rates on inventory.
FY2026 Forecast
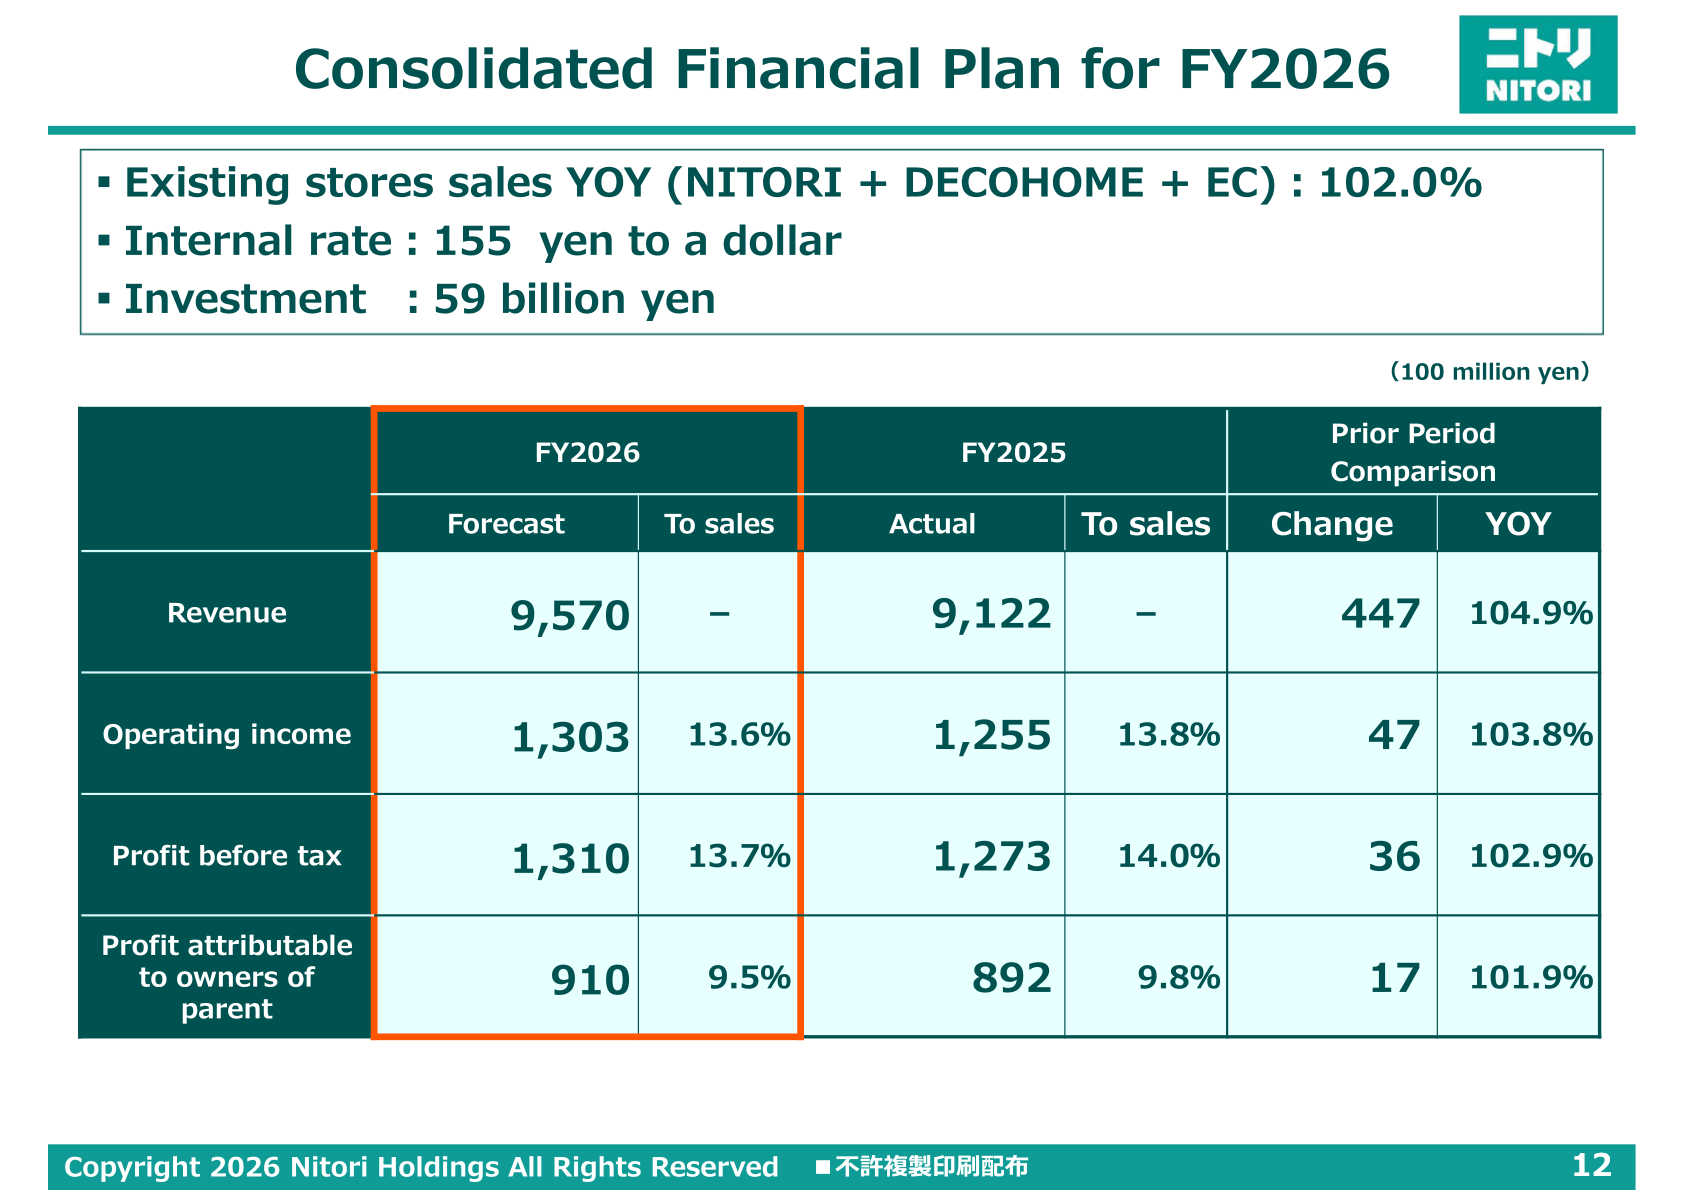
For FY2026, NITORI Holdings forecasts the following consolidated results, in 100 million yen. The forecast assumes existing-store sales growth (NITORI + DECOHOME + EC) of 102.0% year on year, an internal foreign exchange rate of 155 yen to the dollar, and planned investment of 59 billion yen, per the presentation.
| Item | FY2026 Forecast (To sales) | FY2025 Actual (To sales) | Change | YOY |
|---|---|---|---|---|
| Revenue | 9,570 (-) | 9,122 (-) | 447 | 104.9% |
| Operating income | 1,303 (13.6%) | 1,255 (13.8%) | 47 | 103.8% |
| Profit before tax | 1,310 (13.7%) | 1,273 (14.0%) | 36 | 102.9% |
| Profit attributable to owners of parent | 910 (9.5%) | 892 (9.8%) | 17 | 101.9% |
Shareholder Returns
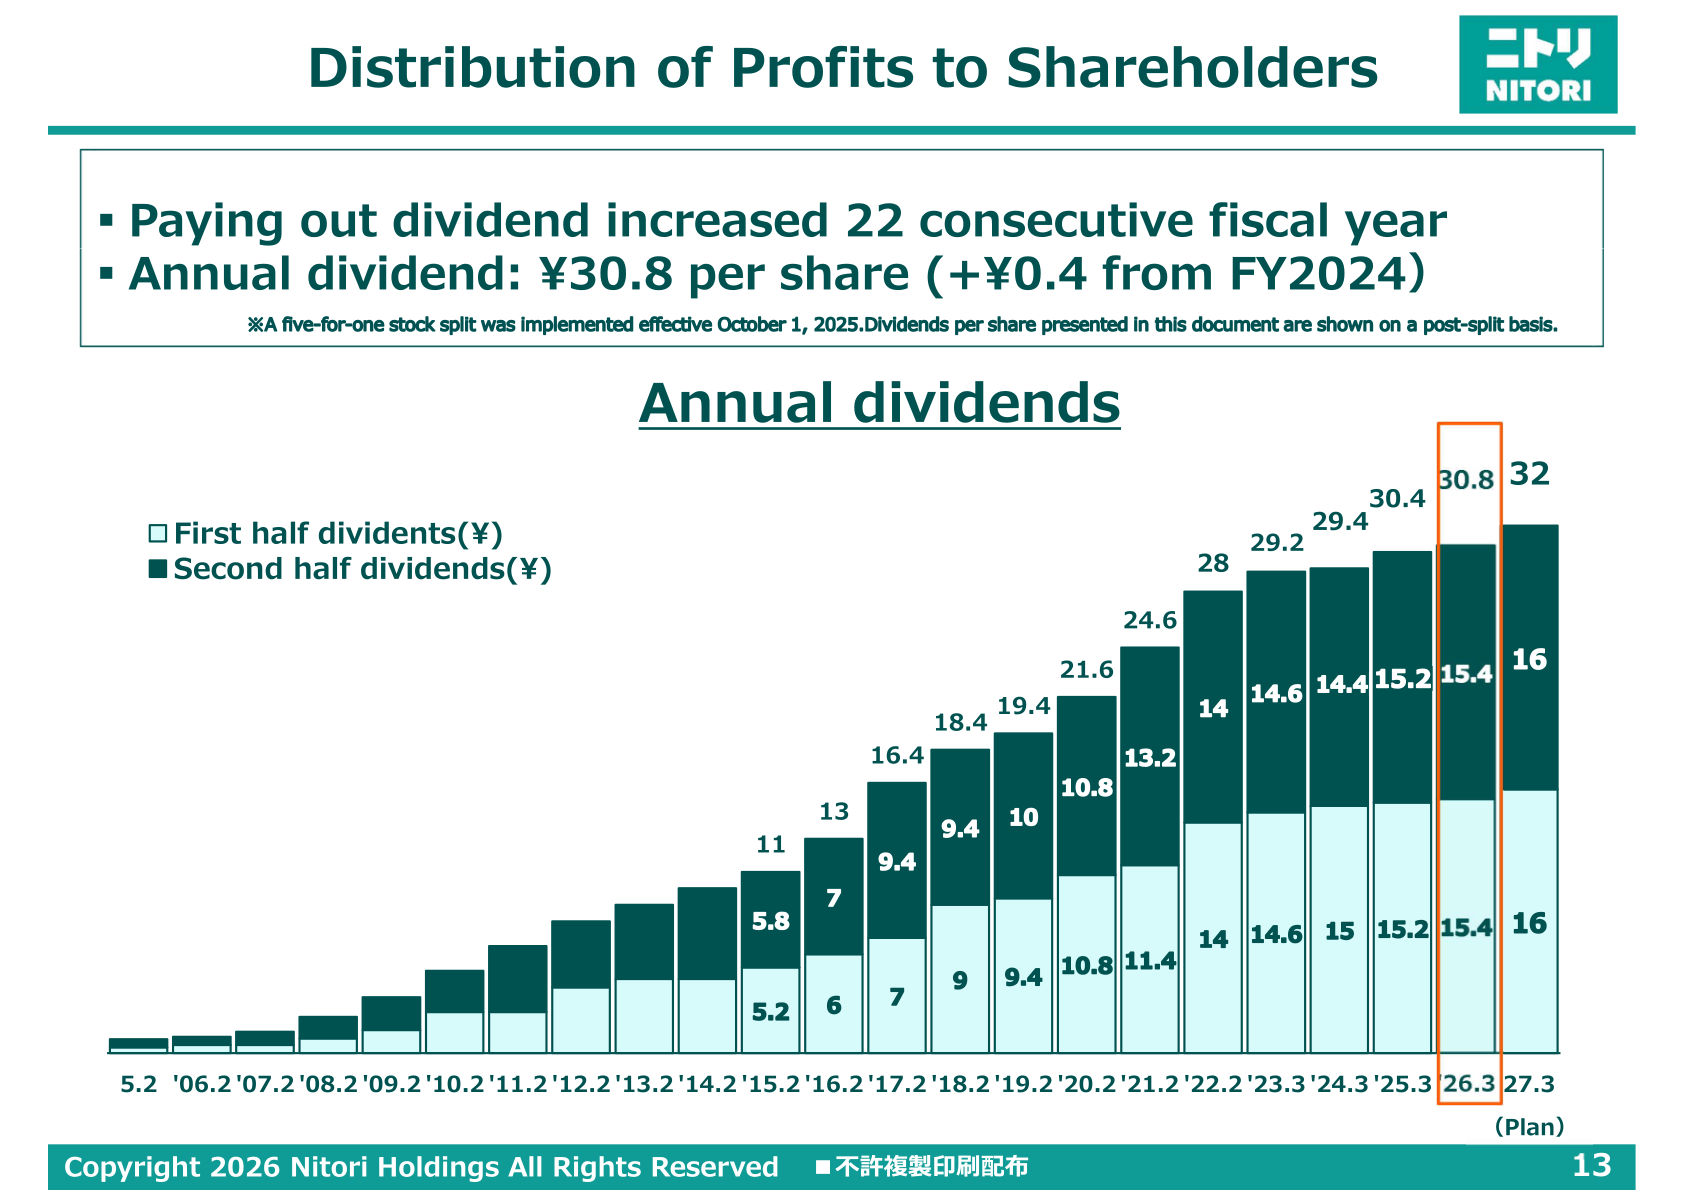
NITORI Holdings’ annual dividend for FY2025 was ¥30.8 per share, up ¥0.4 from FY2024, marking the 22nd consecutive fiscal year of dividend increases, according to the presentation. The chart in the presentation also shows a subsequent value of ¥32 per share, labeled “(Plan).” Separately, the Major Indicators of Management Efficiency table shows the Ratio of profit distribution at 27.0% for the current period (2026.3), against a target of over 20% and a prior-period figure of 28.9% (2025.3).
Store Network
As of March 31, 2026 (end of FY2025), the NITORI Group operated a total of 1,069 stores (860 in Japan, 209 overseas), a net increase of 21 stores during the fiscal year, comprising 92 store openings and 71 store closures. For FY2026, the company’s Store Roll-Out Plan calls for a net increase of 143 stores, bringing the total to 1,212 stores (921 in Japan, 291 overseas).
Note: per the presentation, monetary figures are unaudited reference figures rounded down to the nearest 100 million yen, with all other figures rounded.
This article is an analysis based on publicly available information and is not a recommendation to buy or sell any specific securities. Investment decisions are your own responsibility.
![[Obayashi] Investors’ Guide 2026 — The Complete 24-Article Breakdown](https://japan-equity.com/wp-content/uploads/2026/07/hub_cover-1024x1024.png)
![[Obayashi] IR & SR Policy — Feeding Dialogue Back into Management](https://japan-equity.com/wp-content/uploads/2026/07/p32_sq-1024x1024.jpg)
![[Obayashi] Real Estate Development — 18.7% Margin, ¥287.7bn Unrealized Gains](https://japan-equity.com/wp-content/uploads/2026/07/p20_sq-1024x1024.jpg)
![[Obayashi] Domestic Civil Engineering — Resilience Spending Supports 9.6% Margin](https://japan-equity.com/wp-content/uploads/2026/07/p11_sq-1024x1024.jpg)
![[Obayashi] Share Price & External Ratings — vs TOPIX, ESG Index Inclusion](https://japan-equity.com/wp-content/uploads/2026/07/p40_sq-1024x1024.jpg)
![[Construction] ¥75.5tn Investment, Shrinking Workforce — Big-5 Market Share](https://japan-equity.com/wp-content/uploads/2026/07/p12_sq-1024x1024.jpg)



![[Obayashi] Capital Policy & Shareholder Returns — ROE 10%+, DOE ~5%, ¥100bn Buyback](https://japan-equity.com/wp-content/uploads/2026/07/p27_sq-1024x1024.jpg)
![[Obayashi] Reducing Cross-Shareholdings — ¥285.2bn Sold in Five Years](https://japan-equity.com/wp-content/uploads/2026/07/p29_sq-1024x1024.jpg)
![[Obayashi] ¥750bn Investment Plan — ¥300bn to Development, ¥190bn to Tech/DX](https://japan-equity.com/wp-content/uploads/2026/07/p30_sq-1024x1024.jpg)
![[Obayashi] MTP2022 KPIs — Operating Profit ~2x Target, ROE 14.4%](https://japan-equity.com/wp-content/uploads/2026/07/p25_sq-1024x1024.jpg)
![[Obayashi] Cash Allocation — ¥420bn Investment CF Over Five Years](https://japan-equity.com/wp-content/uploads/2026/07/p26_sq-1024x1024.jpg)
![[Obayashi] Green Energy — 44 Plants, 344MW, and the Green Hydrogen Challenge](https://japan-equity.com/wp-content/uploads/2026/07/p21_sq-1024x1024.jpg)
![[Obayashi] Tackling the Labor Shortage — Robotics Construction®](https://japan-equity.com/wp-content/uploads/2026/07/p14_sq-1024x1024.jpg)
