
This article is based on publicly available IR materials and is not a recommendation to buy or sell any specific securities.
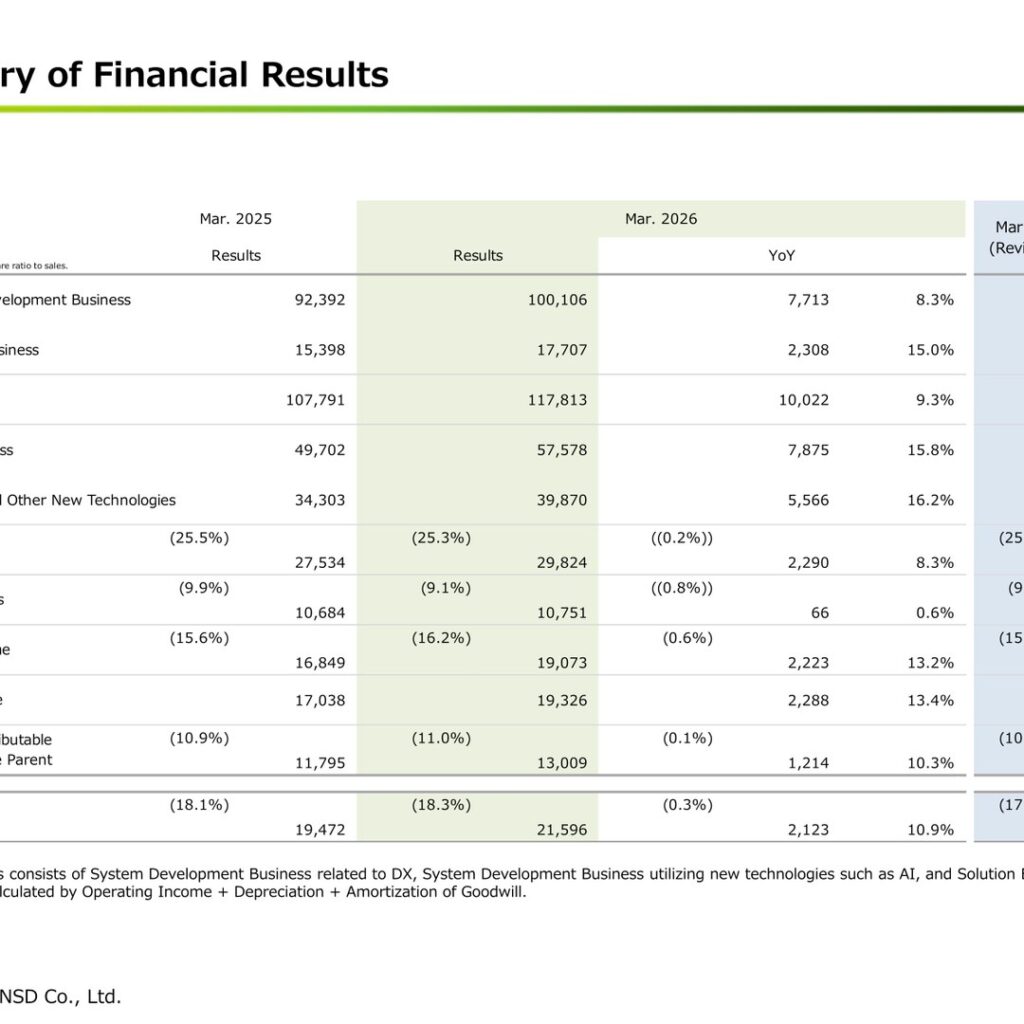
Note: this article covers the fiscal year ended March 31, 2026, which the presentation labels “Mar. 2026”; our site classifies the most recently completed fiscal year as FY2025, and the labels used in the text, tables and segment data below follow the presentation. NSD Co., Ltd. posted net sales of 117,813 million yen for the fiscal year ended March 31, 2026, an increase of 9.3% year on year, and operating income of 19,073 million yen, up 13.2%. Ordinary income rose 13.4% to 19,326 million yen and net income attributable to owners of the parent rose 10.3% to 13,009 million yen. The company’s forecast revised on January 30, 2026 called for net sales of 117,200 million yen and operating income of 18,400 million yen.
Consolidated Results (Full-Year Actual)
The presentation attributes the increase in net sales to continued high orders in Financial IT and a significant increase in orders in Industry IT in the System Development Business, as well as significant growth in orders for security products in the Solution Business. DAS Business net sales, which NSD defines as System Development Business related to DX, System Development Business utilizing new technologies such as AI, and the Solution Business, increased by 15.8% to 57.5 billion yen as a result of the growth of System Development Business related to DX utilizing cloud technologies. Operating income increased on higher sales in the Solution Business in addition to a steady increase in the System Development Business. EBITDA, which the company calculates as operating income plus depreciation plus amortization of goodwill, was 21,596 million yen, up 10.9%.
| Item (Millions of yen) | Mar. 2026 Results | Mar. 2025 Results | YoY | Mar. 2026 Forecast (Revised 2026/1/30) |
|---|---|---|---|---|
| Net Sales | 117,813 | 107,791 | 9.3% | 117,200 |
| System Development Business | 100,106 | 92,392 | 8.3% | – |
| Solution Business | 17,707 | 15,398 | 15.0% | – |
| DAS Business | 57,578 | 49,702 | 15.8% | 55,000 |
| DX/AI and Other New Technologies | 39,870 | 34,303 | 16.2% | – |
| Gross Profit | 29,824 | 27,534 | 8.3% | 29,500 |
| SG & A Expenses | 10,751 | 10,684 | 0.6% | 11,100 |
| Operating Income | 19,073 | 16,849 | 13.2% | 18,400 |
| Ordinary Income | 19,326 | 17,038 | 13.4% | 18,600 |
| Net Income Attributable to Owners of the Parent | 13,009 | 11,795 | 10.3% | 12,700 |
| EBITDA | 21,596 | 19,472 | 10.9% | 20,800 |
Segment Results
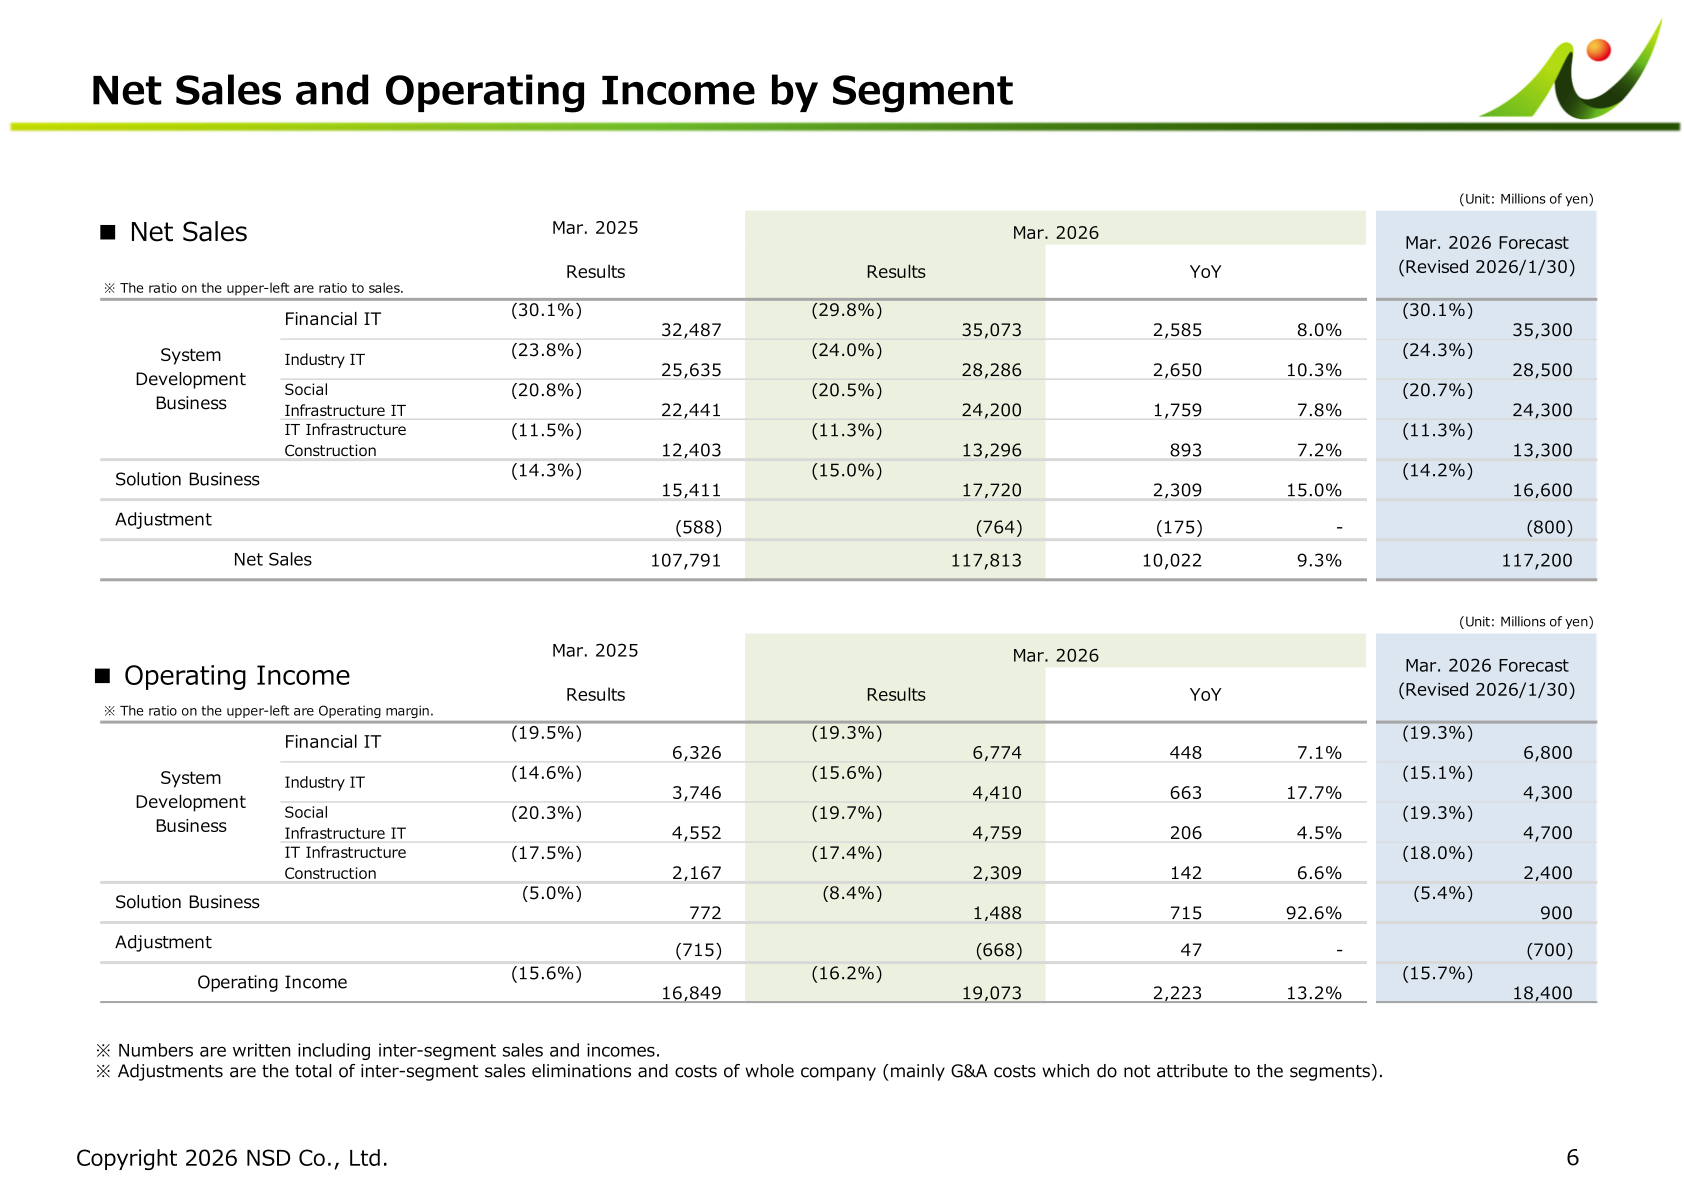
By segment, Financial IT net sales increased by 8.0% and operating income increased by 7.1% due to a significant increase in orders from major banks caused by expansion of existing projects including core system renewal, while there was an end of large-scale projects in insurance companies. Industry IT net sales increased by 10.3% due to a steady increase in orders from the manufacturing sector related to automobiles, and operating income increased by 17.7% due in part to improvement of profit margins. Social Infrastructure IT net sales increased by 7.8% due to a steady increase in orders from the telecommunication sector as well as from the public and electricity, gas, water sector, while operating income increased by 4.5% partly due to the impact of some less profitable project. IT Infrastructure Construction net sales increased by 7.2% and operating income increased by 6.6% on a steady increase in orders of infrastructure construction projects across various industries, particularly from the financial sector such as banks and the public sector. Solution Business net sales increased by 15.0% and operating income was 1.4 billion yen, approximately double that of the previous period, due to increased needs for strengthened securities in public organizations and acquisition of major clients in shareholder relation services, in addition to a surge in demand related to promotion of medical DX by the Japanese government.
| Segment (Millions of yen) | Net Sales Mar. 2026 | Net Sales YoY | Operating Income Mar. 2026 | Operating Income YoY |
|---|---|---|---|---|
| Financial IT | 35,073 | 8.0% | 6,774 | 7.1% |
| Industry IT | 28,286 | 10.3% | 4,410 | 17.7% |
| Social Infrastructure IT | 24,200 | 7.8% | 4,759 | 4.5% |
| IT Infrastructure Construction | 13,296 | 7.2% | 2,309 | 6.6% |
| Solution Business | 17,720 | 15.0% | 1,488 | 92.6% |
| Adjustment | (764) | – | (668) | – |
| Total | 117,813 | 9.3% | 19,073 | 13.2% |
Orders Received and Order Backlog
Orders received, stated on an external-customer basis, totalled 121,940 million yen, up 9.4%, and the order backlog was 32,083 million yen, up 14.8%. Financial IT accounted for 38,428 million yen of orders received, up 16.2%, and its backlog rose 31.4% to 14,023 million yen. Solution Business orders received rose 14.3% to 18,145 million yen, while the Industry IT backlog declined 2.3% to 5,368 million yen.
End-user Sectors and Solution Categories
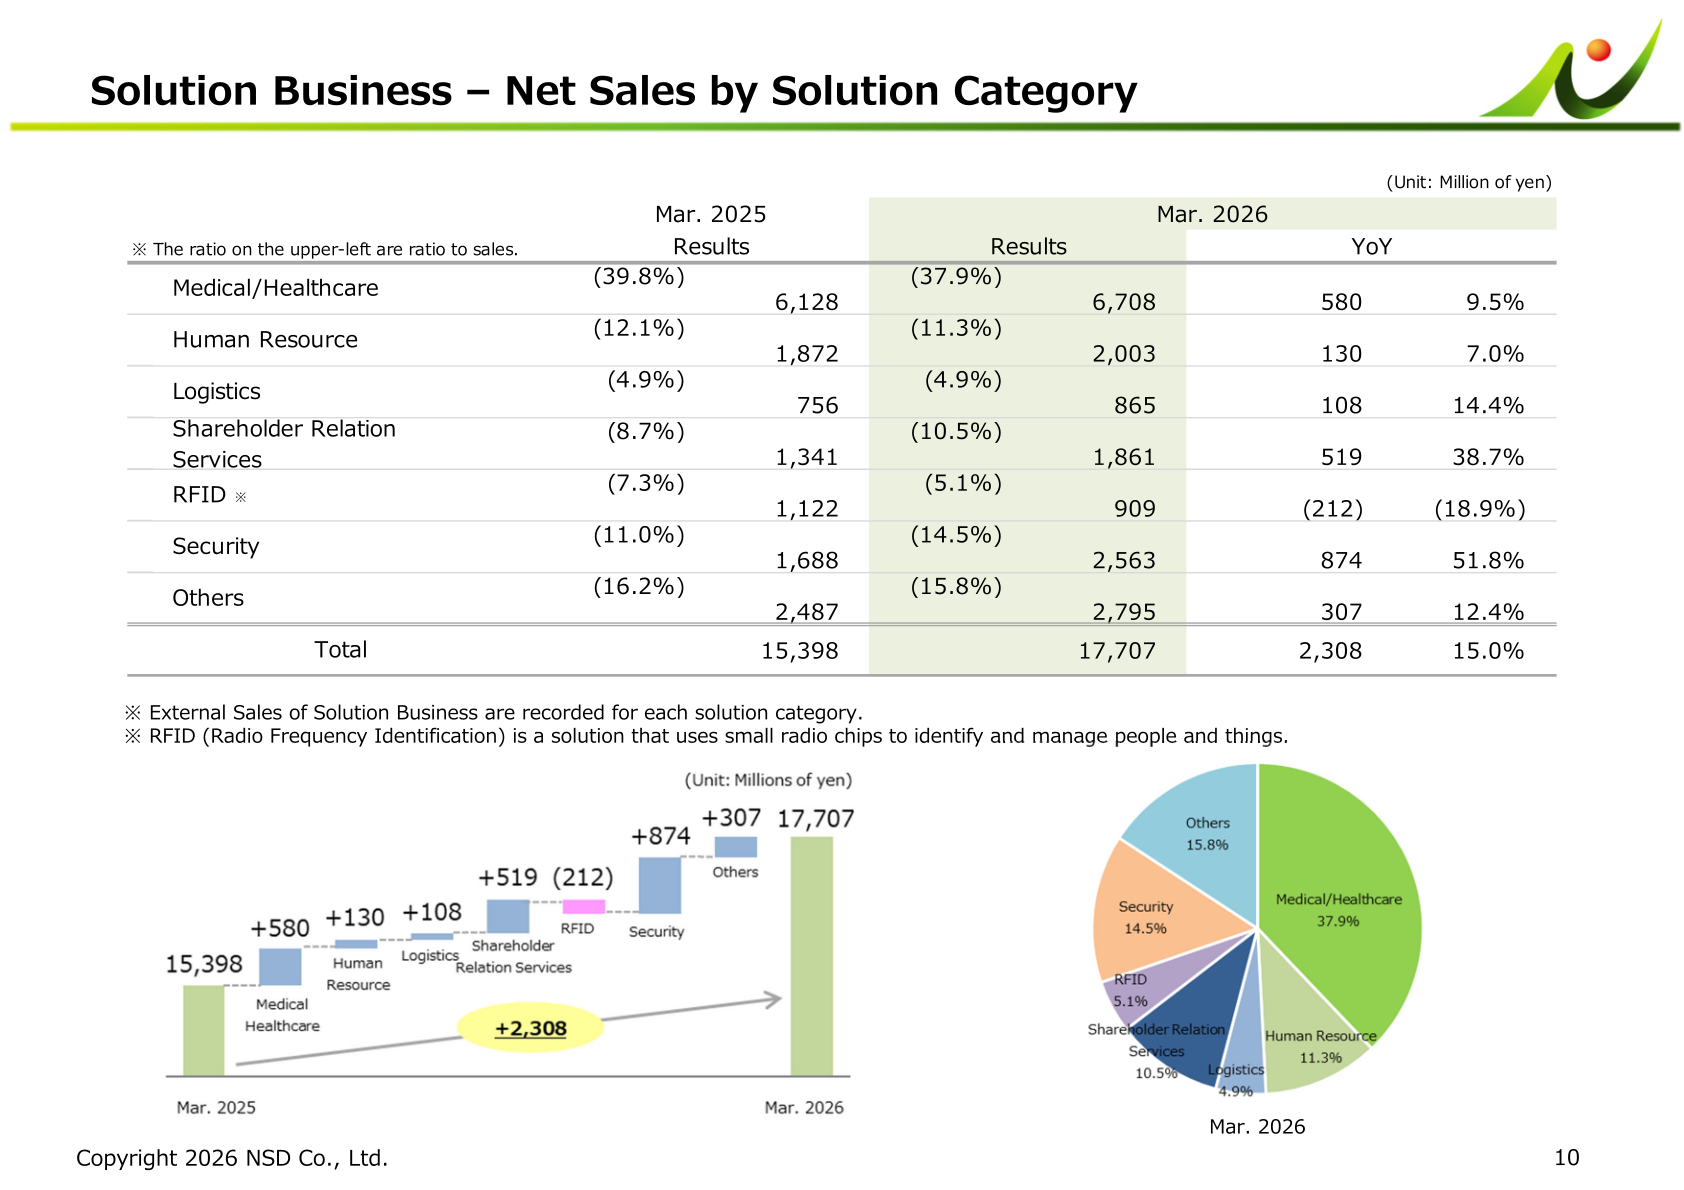
Within System Development Business external sales of 100,106 million yen, the finance sector accounted for 37,624 million yen, or 37.6% of the total, up 7.3%; the service sector 16,522 million yen, up 2.4%; manufacturing 13,885 million yen, up 17.3%; public 8,410 million yen, up 7.5%; and telecommunication 7,871 million yen, up 14.9%. Inside the financial sector, major banks accounted for 15,862 million yen, up 12.0%, and insurance companies 10,959 million yen, up 0.7%. In the Solution Business, medical/healthcare was the largest category at 6,708 million yen, up 9.5%, while security rose 51.8% to 2,563 million yen and shareholder relation services rose 38.7% to 1,861 million yen; RFID declined 18.9% to 909 million yen.
Full-Year Forecast (Fiscal Year Ending March 31, 2027)
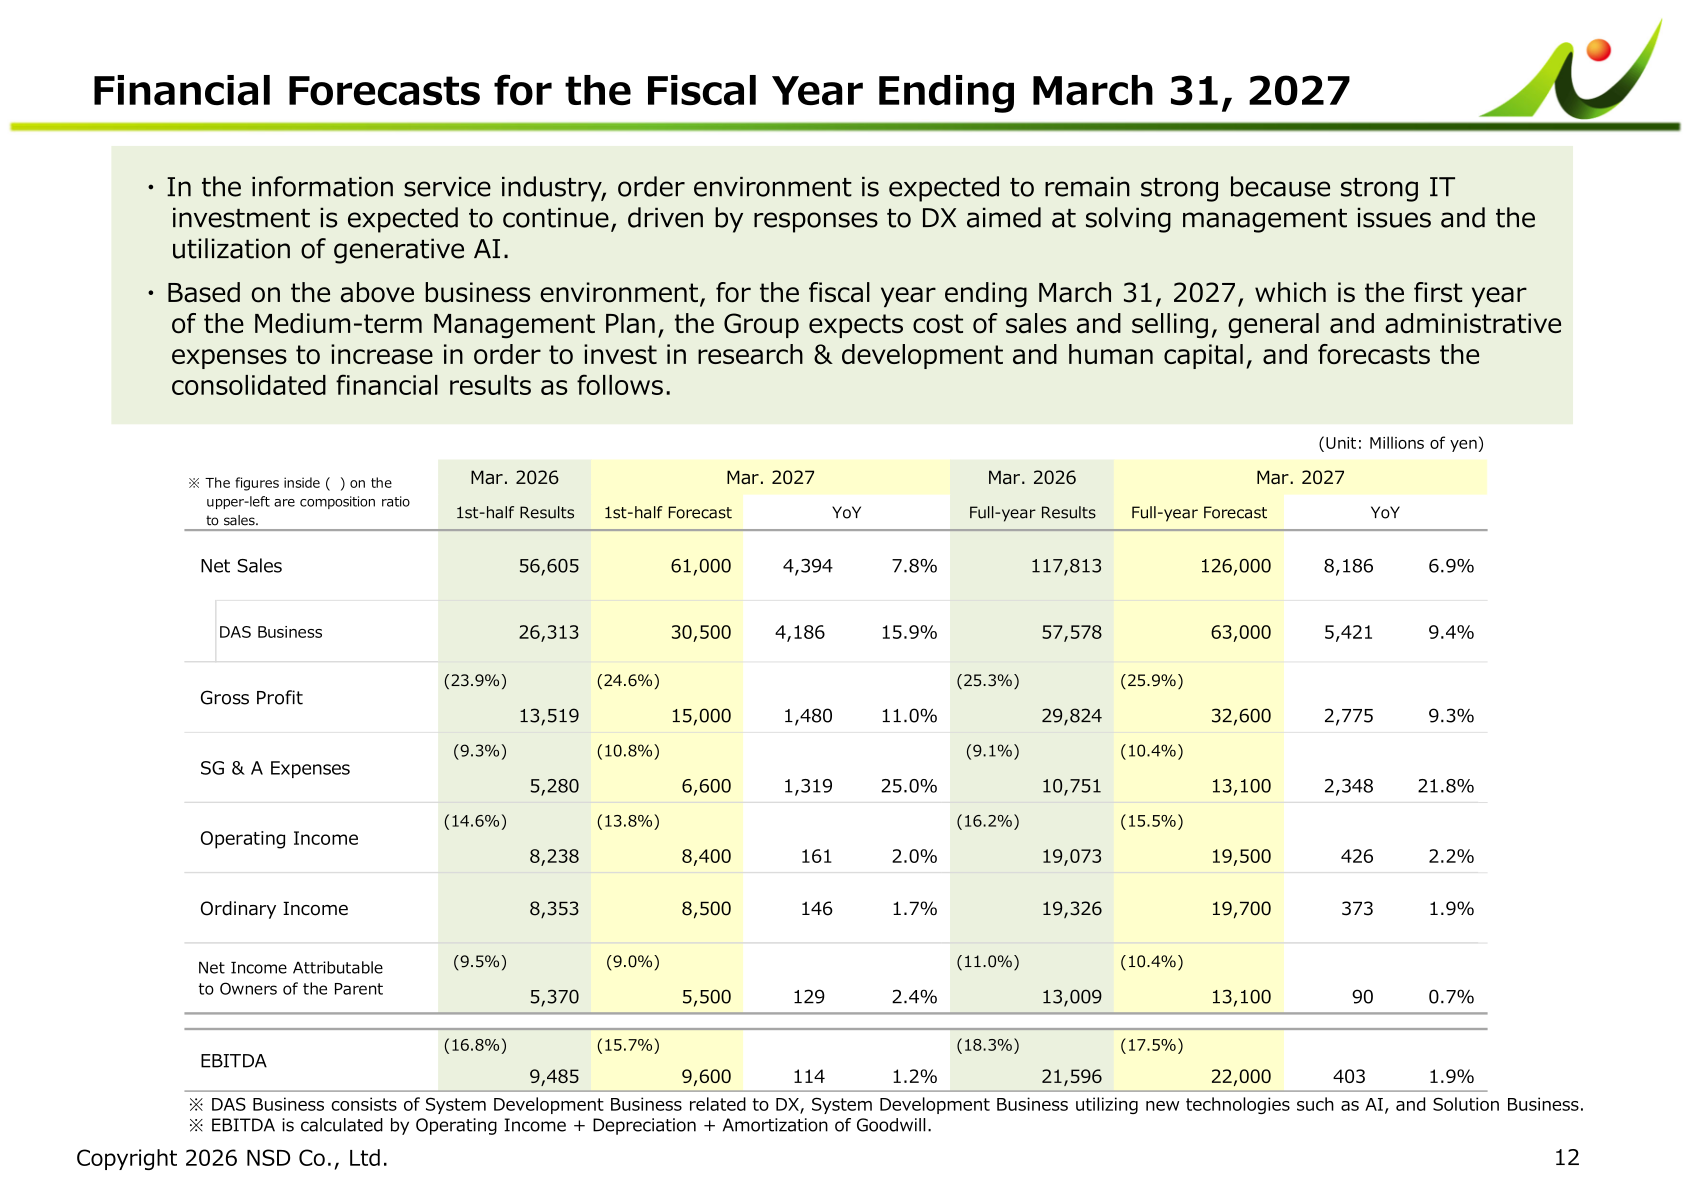
For the fiscal year ending March 31, 2027, which is the first year of the Medium-term Management Plan, NSD forecasts net sales of 126,000 million yen, up 6.9%, and operating income of 19,500 million yen, up 2.2%. The presentation states that in the information service industry the order environment is expected to remain strong because strong IT investment is expected to continue, driven by responses to DX aimed at solving management issues and the utilization of generative AI, and that the Group expects cost of sales and selling, general and administrative expenses to increase in order to invest in research & development and human capital. SG & A expenses are forecast to rise 21.8% to 13,100 million yen, and the operating margin is shown at 15.5% for the forecast against 16.2% for the year under review. By segment, the full-year forecast is net sales of 37,800 million yen for Financial IT, 29,900 million yen for Industry IT, 25,800 million yen for Social Infrastructure IT, 14,100 million yen for IT Infrastructure Construction and 19,000 million yen for the Solution Business.
| Item (Millions of yen) | Mar. 2027 Full-year Forecast | Mar. 2026 Full-year Results | YoY |
|---|---|---|---|
| Net Sales | 126,000 | 117,813 | 6.9% |
| DAS Business | 63,000 | 57,578 | 9.4% |
| Gross Profit | 32,600 | 29,824 | 9.3% |
| SG & A Expenses | 13,100 | 10,751 | 21.8% |
| Operating Income | 19,500 | 19,073 | 2.2% |
| Ordinary Income | 19,700 | 19,326 | 1.9% |
| Net Income Attributable to Owners of the Parent | 13,100 | 13,009 | 0.7% |
| EBITDA | 22,000 | 21,596 | 1.9% |
Financial Position and Cash Flows
Total assets stood at 97,442 million yen as of March 31, 2026, an increase of 6,956 million yen, including cash and deposits of 30,905 million yen, up 3,547 million yen. Total net assets were 74,799 million yen, up 6,547 million yen, with retained earnings of 69,012 million yen and treasury stock of (15,332) million yen. Cash flows from operating activities were 16,156 million yen, cash flows from investing activities were (3,084) million yen and cash flows from financing activities were (10,517) million yen, leaving free cash flow of 13,071 million yen.
Shareholder Returns
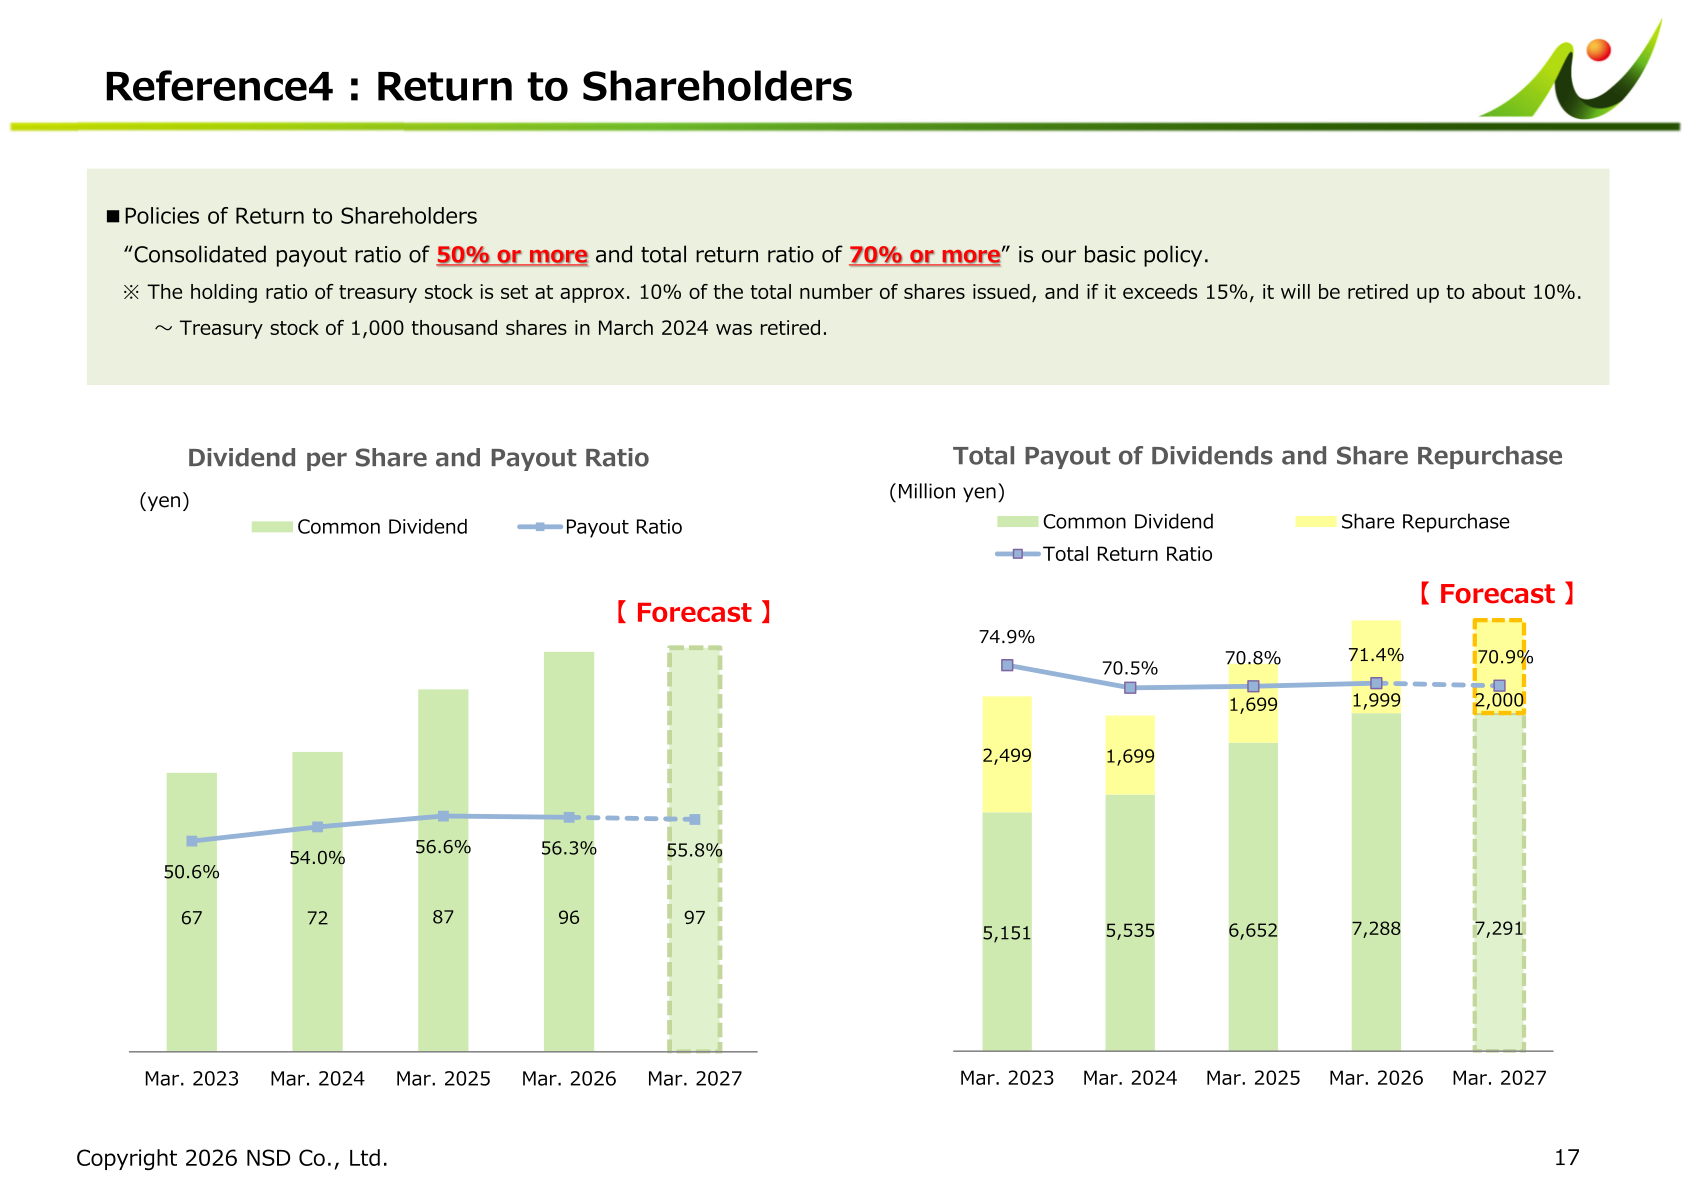
NSD states that a consolidated payout ratio of 50% or more and a total return ratio of 70% or more is its basic policy. The holding ratio of treasury stock is set at approximately 10% of the total number of shares issued, and if it exceeds 15% it will be retired up to about 10%. The dividend per share for the fiscal year ended March 31, 2026 was 96 yen, for a payout ratio of 56.3%, and the forecast for the fiscal year ending March 31, 2027 is 97 yen, for a payout ratio of 55.8%. Common dividends of 7,288 million yen and share repurchases of 1,999 million yen produced a total return ratio of 71.4% for the year. On May 8, 2026 the company resolved a share repurchase of a planned total of 750 thousand shares (maximum) for 2,000 million yen (maximum), with a repurchase period from May 11, 2026 to October 9, 2026.
| Fiscal Year | Dividend per Share (yen) | Payout Ratio | Common Dividend (Million yen) | Share Repurchase (Million yen) | Total Return Ratio |
|---|---|---|---|---|---|
| Mar. 2023 | 67 | 50.6% | 5,151 | 2,499 | 74.9% |
| Mar. 2024 | 72 | 54.0% | 5,535 | 1,699 | 70.5% |
| Mar. 2025 | 87 | 56.6% | 6,652 | 1,699 | 70.8% |
| Mar. 2026 | 96 | 56.3% | 7,288 | 1,999 | 71.4% |
| Mar. 2027 (Forecast) | 97 | 55.8% | 7,291 | 2,000 | 70.9% |
Medium-Term Management Plan and Topics
The fiscal year ended March 31, 2026 was the final year of the previous medium-term management plan. Against the plan revised on May 9, 2023, which set net sales of 110.0 billion yen, DAS Business sales of 50.0 billion yen, operating income of 16.5 billion yen, ordinary income of 16.5 billion yen, net income of 10.5 billion yen, EBITDA of 19.2 billion yen and ROE of 16.6%, the results were net sales of 117.8 billion yen, DAS Business sales of 57.5 billion yen, operating income of 19.0 billion yen, ordinary income of 19.3 billion yen, net income of 13.0 billion yen, EBITDA of 21.5 billion yen and ROE of 18.4%. On May 8, 2026 NSD announced a Medium-term Management Plan covering the fiscal years from Mar. 2027 to Mar. 2029, under which it will shift the System Development Business to upstream processes, further strengthen the DAS Business, implement proactive investments in research & development and human capital, and continue shareholder returns policies. On management based on cost of capital, the presentation shows ROE of 18.4% for March 2026 against a cost of capital of about 7%, together with PBR of 2.82x, a stock price of 2,740.5 yen and market capitalization of 208.0 billion yen. Other topics disclosed during the year include the launch of the private generative AI platform “BizInsight” in July 2025, selection as a constituent of the “JPX-Nikkei Index 400” for the fourth consecutive year in August 2025, and the opening of the NSD Sapporo office in March 2026.
This article is an analysis based on publicly available information and is not a recommendation to buy or sell any specific securities. Investment decisions are your own responsibility.
![[Obayashi] Investors’ Guide 2026 — The Complete 24-Article Breakdown](https://japan-equity.com/wp-content/uploads/2026/07/hub_cover-1024x1024.png)
![[Obayashi] IR & SR Policy — Feeding Dialogue Back into Management](https://japan-equity.com/wp-content/uploads/2026/07/p32_sq-1024x1024.jpg)
![[Obayashi] Domestic Civil Engineering — Resilience Spending Supports 9.6% Margin](https://japan-equity.com/wp-content/uploads/2026/07/p11_sq-1024x1024.jpg)
![[Obayashi] Overseas Construction — Orders Reach ¥1.2tn](https://japan-equity.com/wp-content/uploads/2026/07/p15_sq-1024x1024.jpg)
![[Obayashi] Share Price & External Ratings — vs TOPIX, ESG Index Inclusion](https://japan-equity.com/wp-content/uploads/2026/07/p40_sq-1024x1024.jpg)
![[Construction] ¥75.5tn Investment, Shrinking Workforce — Big-5 Market Share](https://japan-equity.com/wp-content/uploads/2026/07/p12_sq-1024x1024.jpg)



![[Obayashi] Capital Policy & Shareholder Returns — ROE 10%+, DOE ~5%, ¥100bn Buyback](https://japan-equity.com/wp-content/uploads/2026/07/p27_sq-1024x1024.jpg)
![[Obayashi] Reducing Cross-Shareholdings — ¥285.2bn Sold in Five Years](https://japan-equity.com/wp-content/uploads/2026/07/p29_sq-1024x1024.jpg)
![[Obayashi] ¥750bn Investment Plan — ¥300bn to Development, ¥190bn to Tech/DX](https://japan-equity.com/wp-content/uploads/2026/07/p30_sq-1024x1024.jpg)
![[Obayashi] MTP2022 KPIs — Operating Profit ~2x Target, ROE 14.4%](https://japan-equity.com/wp-content/uploads/2026/07/p25_sq-1024x1024.jpg)
![[Obayashi] Cash Allocation — ¥420bn Investment CF Over Five Years](https://japan-equity.com/wp-content/uploads/2026/07/p26_sq-1024x1024.jpg)
![[Obayashi] Green Energy — 44 Plants, 344MW, and the Green Hydrogen Challenge](https://japan-equity.com/wp-content/uploads/2026/07/p21_sq-1024x1024.jpg)
![[Obayashi] Tackling the Labor Shortage — Robotics Construction®](https://japan-equity.com/wp-content/uploads/2026/07/p14_sq-1024x1024.jpg)
