
This article is based on publicly available IR materials and is not a recommendation to buy or sell any specific securities.
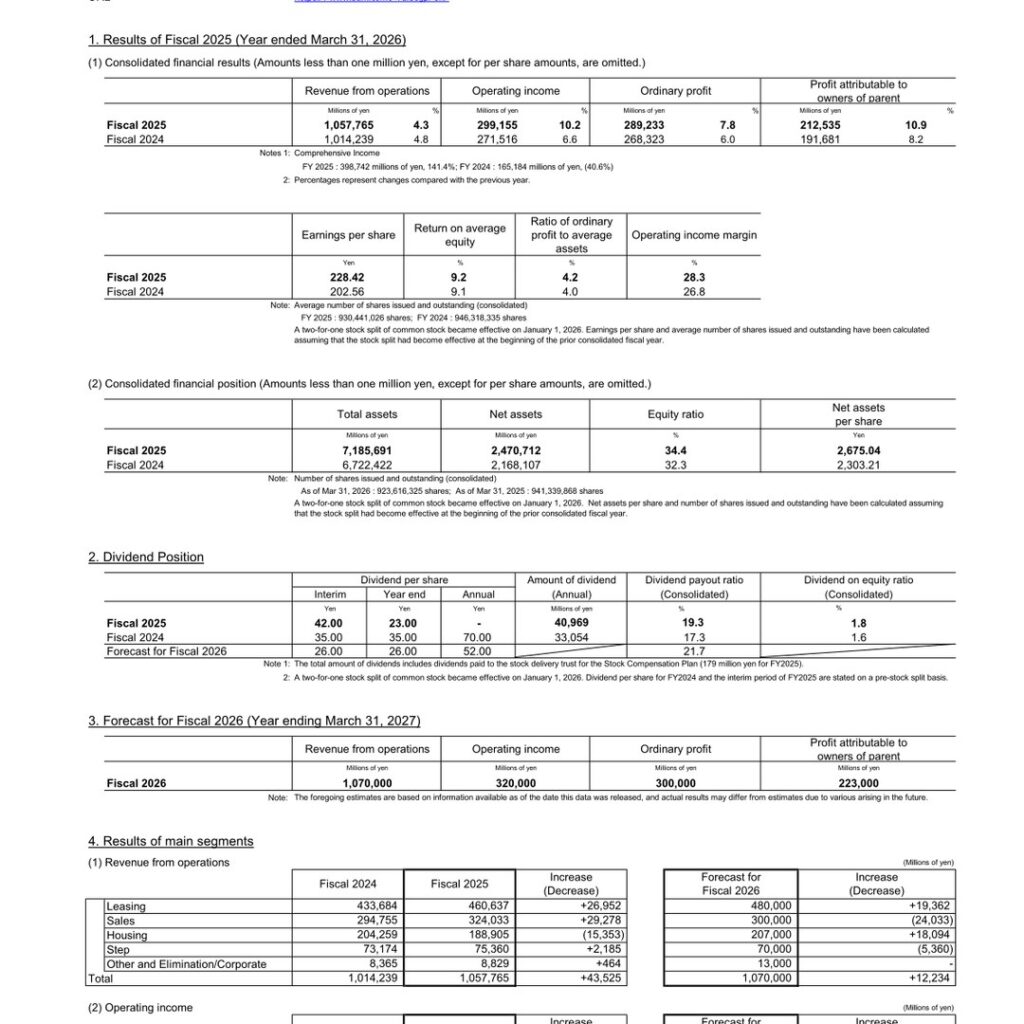
Note: Sumitomo Realty & Development does not publish an English results presentation for this fiscal year; this article is based on the company’s English-language financial summary. For the fiscal year ended March 31, 2026 (FY2025), Sumitomo Realty & Development recorded record-high revenue from operations, operating income, ordinary profit and profit attributable to owners of parent, marking the fifth consecutive year of record ordinary profit and the 13th consecutive year of record profit. The mainstay Leasing Business, centered on office buildings in Tokyo, achieved its largest-ever profit increase and drove overall performance, while the Sales Business (condominium sales) and the Step Business also posted record profits.
Consolidated Results (Full-Year Actual)
Revenue from operations was 1,057,765 million yen (up 4.3% year on year), operating income was 299,155 million yen (up 10.2%), ordinary profit was 289,233 million yen (up 7.8%), and profit attributable to owners of parent was 212,535 million yen (up 10.9%). Non-operating income/loss deteriorated by 6.7 billion yen year on year, mainly due to an increase in interest expenses. Extraordinary income/loss improved by 8.8 billion yen year on year, as a gain on sale of investment securities was recorded, while a provision for share awards attributable to prior years of service was also recognized in connection with the introduction of the Stock Compensation Plan to Reward Long Service and Dedication for employees.
| Item | FY2025 | FY2024 | YoY Change |
|---|---|---|---|
| Revenue from operations (Millions of yen) | 1,057,765 | 1,014,239 | +4.3% |
| Operating income (Millions of yen) | 299,155 | 271,516 | +10.2% |
| Ordinary profit (Millions of yen) | 289,233 | 268,323 | +7.8% |
| Profit attributable to owners of parent (Millions of yen) | 212,535 | 191,681 | +10.9% |
| Comprehensive income (Millions of yen) | 398,742 | 165,184 | +141.4% |
| Earnings per share (Yen) | 228.42 | 202.56 | – |
| Return on average equity (%) | 9.2 | 9.1 | – |
| Ratio of ordinary profit to average assets (%) | 4.2 | 4.0 | – |
| Operating income margin (%) | 28.3 | 26.8 | – |
| Item | Mar 31, 2026 (FY2025) | Mar 31, 2025 (FY2024) |
|---|---|---|
| Total assets (Millions of yen) | 7,185,691 | 6,722,422 |
| Net assets (Millions of yen) | 2,470,712 | 2,168,107 |
| Equity ratio (%) | 34.4 | 32.3 |
| Net assets per share (Yen) | 2,675.04 | 2,303.21 |
Segment Results
Results by segment for FY2025, compared with the forecast for FY2026, are as follows (the figures for FY2024 are presented in the materials based on the new segment classifications introduced from FY2025, and are not clearly broken out by segment in the source data used for this article). The Leasing segment, mainly office buildings in Tokyo, achieved record profit with its largest-ever profit increase. The Sales segment (condominium sales) achieved high profitability amid rising selling prices, and the Step segment saw a substantial increase in the average price per transaction, due partly to higher prices for existing condominiums.
| Segment | FY2025 (Actual) | FY2026 (Forecast) | Change |
|---|---|---|---|
| Leasing (Millions of yen) | 460,637 | 480,000 | +19,362 |
| Sales (Millions of yen) | 324,033 | 300,000 | (24,033) |
| Housing (Millions of yen) | 188,905 | 207,000 | +18,094 |
| Step (Millions of yen) | 75,360 | 70,000 | (5,360) |
| Total revenue from operations (Millions of yen) | 1,057,765 | 1,070,000 | +12,234 |
| Segment | FY2025 (Actual) | FY2026 (Forecast) | Change |
|---|---|---|---|
| Leasing (Millions of yen) | 210,181 | 224,000 | +13,818 |
| Sales (Millions of yen) | 76,223 | 81,000 | +4,776 |
| Housing (Millions of yen) | 13,420 | 17,000 | +3,579 |
| Step (Millions of yen) | 23,601 | 22,000 | (1,601) |
| Total operating income (Millions of yen) | 299,155 | 320,000 | +20,844 |
FY2026 Forecast
For FY2026 (the fiscal year ending March 31, 2027), the Company expects the Leasing Business, centered on office building leasing in Tokyo, to continue driving overall performance, with revenue from operations, operating income, ordinary profit and profit all expected to reach new record highs.
| Item | FY2026 Forecast | FY2025 (Actual) |
|---|---|---|
| Revenue from operations (Millions of yen) | 1,070,000 | 1,057,765 |
| Operating income (Millions of yen) | 320,000 | 299,155 |
| Ordinary profit (Millions of yen) | 300,000 | 289,233 |
| Profit attributable to owners of parent (Millions of yen) | 223,000 | 212,535 |
Shareholder Returns
Note: A two-for-one stock split of common stock became effective on January 1, 2026. Dividend per share for FY2024 and the interim period of FY2025 are stated on a pre-stock-split basis; this is stated in the materials as the reason no annual per-share total is presented for FY2025. Total dividends for a given year include dividends paid to the stock delivery trust for the Stock Compensation Plan (179 million yen for FY2025, per the materials).
| Item | FY2025 (Actual) | FY2024 (Actual) | FY2026 (Forecast) |
|---|---|---|---|
| Interim dividend per share (Yen) | 42.00 | 35.00 | 26.00 |
| Year-end dividend per share (Yen) | 23.00 | 35.00 | 26.00 |
| Annual dividend per share (Yen) | – | 70.00 | 52.00 |
| Total dividends, annual (Millions of yen) | This cannot be confirmed from the materials. | 33,054 | This cannot be confirmed from the materials. |
| Dividend payout ratio, consolidated (%) | This cannot be confirmed from the materials. | 17.3 | 21.7 |
| Dividend on equity ratio, consolidated (%) | 1.8 | 1.6 | This cannot be confirmed from the materials. |
Medium-Term Plan / Topics
Since April 2025, the Company has been implementing its 10th Medium-term Management Plan. In FY2025, the first year of the Plan, the Company achieved record-high ordinary profit for the fifth consecutive year and record-high profit for the 13th consecutive year, achieving approximately one-third of its three-year cumulative targets for revenue from operations, operating income, ordinary profit and profit, marking a solid start toward the Plan’s goals.
| Item | Three-Year Cumulative Target FY2025-FY2027 (Billions of yen) | FY2025 Results (Billions of yen) | Achievement Rate |
|---|---|---|---|
| Revenue from operations | 3,200 | 1,057.7 | 33% |
| Operating income | 930 | 299.1 | 32% |
| Ordinary profit | 900 | 289.2 | 32% |
| Profit attributable to owners of parent | 650 | 212.5 | 33% |
The Company also made progress in reducing strategic shareholdings. At the end of FY2025, shares of 56 issuers (acquisition cost of 82.2 billion yen, approximate market value of 288.2 billion yen) were placed into a trust for orderly disposition and are now held as pure investment shares. As a result, the Company achieved its target of reducing the ratio of the book value of strategic shareholdings to shareholders’ equity to 10% or less, two years ahead of schedule (five years earlier than originally targeted).
| Item | Mar 31, 2025 | Mar 31, 2026 | Change vs. Mar 31, 2025 |
|---|---|---|---|
| Acquisition cost (Billions of yen) | 246.6 | 158.1 | (88.4) |
| Ratio to shareholders’ equity (%) | 12.9 | 7.8 | (5.1)pt |
| Fair value, reference (Billions of yen) | 558.8 | 516.4 | (42.3) |
| Ratio to net assets (%) | 25.8 | 20.9 | (4.9)pt |
On the same day, the Company released “At the End of the First Year of the 10th Medium-term Management Plan: Key Challenges Ahead and Our Response,” identifying the following key challenges: (1) Office Rent Increases to Outpace Rising Interest Rates; (2) Measures to Address Soaring Construction Costs and Extended Construction Periods; (3) Outlook for the Business Environment for Condominium Sales and Our Countermeasures; (4) Updates on the Progress of Our Mumbai, India Business; and (5) Balancing Growth Investments and Returns to Shareholders and Employees, as well as Progress in Strengthening Corporate Governance. The specific content of the Company’s response to each challenge cannot be confirmed from the materials used for this article.
This article is an analysis based on publicly available information and is not a recommendation to buy or sell any specific securities. Investment decisions are your own responsibility.
![[Obayashi] Investors’ Guide 2026 — The Complete 24-Article Breakdown](https://japan-equity.com/wp-content/uploads/2026/07/hub_cover-1024x1024.png)
![[Obayashi] IR & SR Policy — Feeding Dialogue Back into Management](https://japan-equity.com/wp-content/uploads/2026/07/p32_sq-1024x1024.jpg)
![[Obayashi] Real Estate Development — 18.7% Margin, ¥287.7bn Unrealized Gains](https://japan-equity.com/wp-content/uploads/2026/07/p20_sq-1024x1024.jpg)
![[Obayashi] Domestic Civil Engineering — Resilience Spending Supports 9.6% Margin](https://japan-equity.com/wp-content/uploads/2026/07/p11_sq-1024x1024.jpg)
![[Obayashi] Share Price & External Ratings — vs TOPIX, ESG Index Inclusion](https://japan-equity.com/wp-content/uploads/2026/07/p40_sq-1024x1024.jpg)
![[Construction] ¥75.5tn Investment, Shrinking Workforce — Big-5 Market Share](https://japan-equity.com/wp-content/uploads/2026/07/p12_sq-1024x1024.jpg)



![[Obayashi] Capital Policy & Shareholder Returns — ROE 10%+, DOE ~5%, ¥100bn Buyback](https://japan-equity.com/wp-content/uploads/2026/07/p27_sq-1024x1024.jpg)
![[Obayashi] Reducing Cross-Shareholdings — ¥285.2bn Sold in Five Years](https://japan-equity.com/wp-content/uploads/2026/07/p29_sq-1024x1024.jpg)
![[Obayashi] ¥750bn Investment Plan — ¥300bn to Development, ¥190bn to Tech/DX](https://japan-equity.com/wp-content/uploads/2026/07/p30_sq-1024x1024.jpg)
![[Obayashi] MTP2022 KPIs — Operating Profit ~2x Target, ROE 14.4%](https://japan-equity.com/wp-content/uploads/2026/07/p25_sq-1024x1024.jpg)
![[Obayashi] Cash Allocation — ¥420bn Investment CF Over Five Years](https://japan-equity.com/wp-content/uploads/2026/07/p26_sq-1024x1024.jpg)
![[Obayashi] Green Energy — 44 Plants, 344MW, and the Green Hydrogen Challenge](https://japan-equity.com/wp-content/uploads/2026/07/p21_sq-1024x1024.jpg)
![[Obayashi] Tackling the Labor Shortage — Robotics Construction®](https://japan-equity.com/wp-content/uploads/2026/07/p14_sq-1024x1024.jpg)
