
This article is based on publicly available IR materials and is not a recommendation to buy or sell any specific securities.
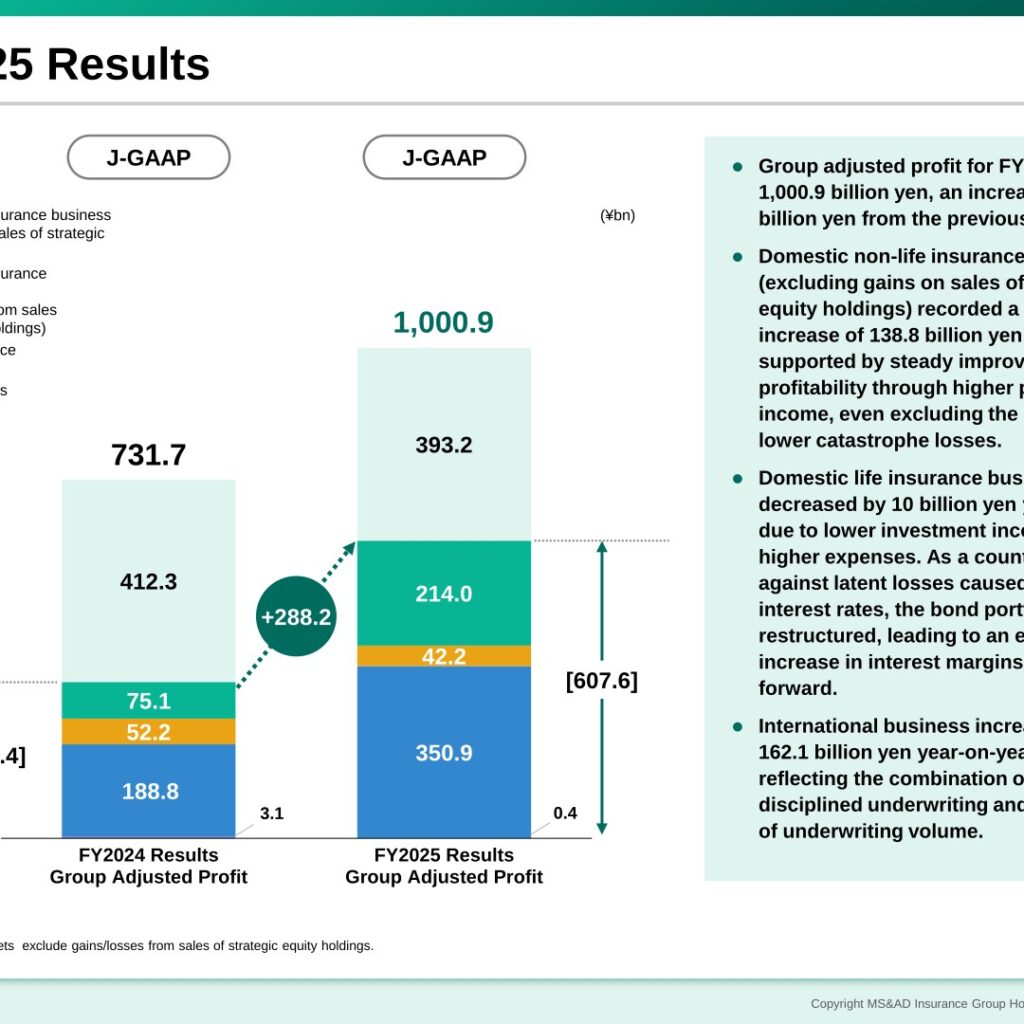
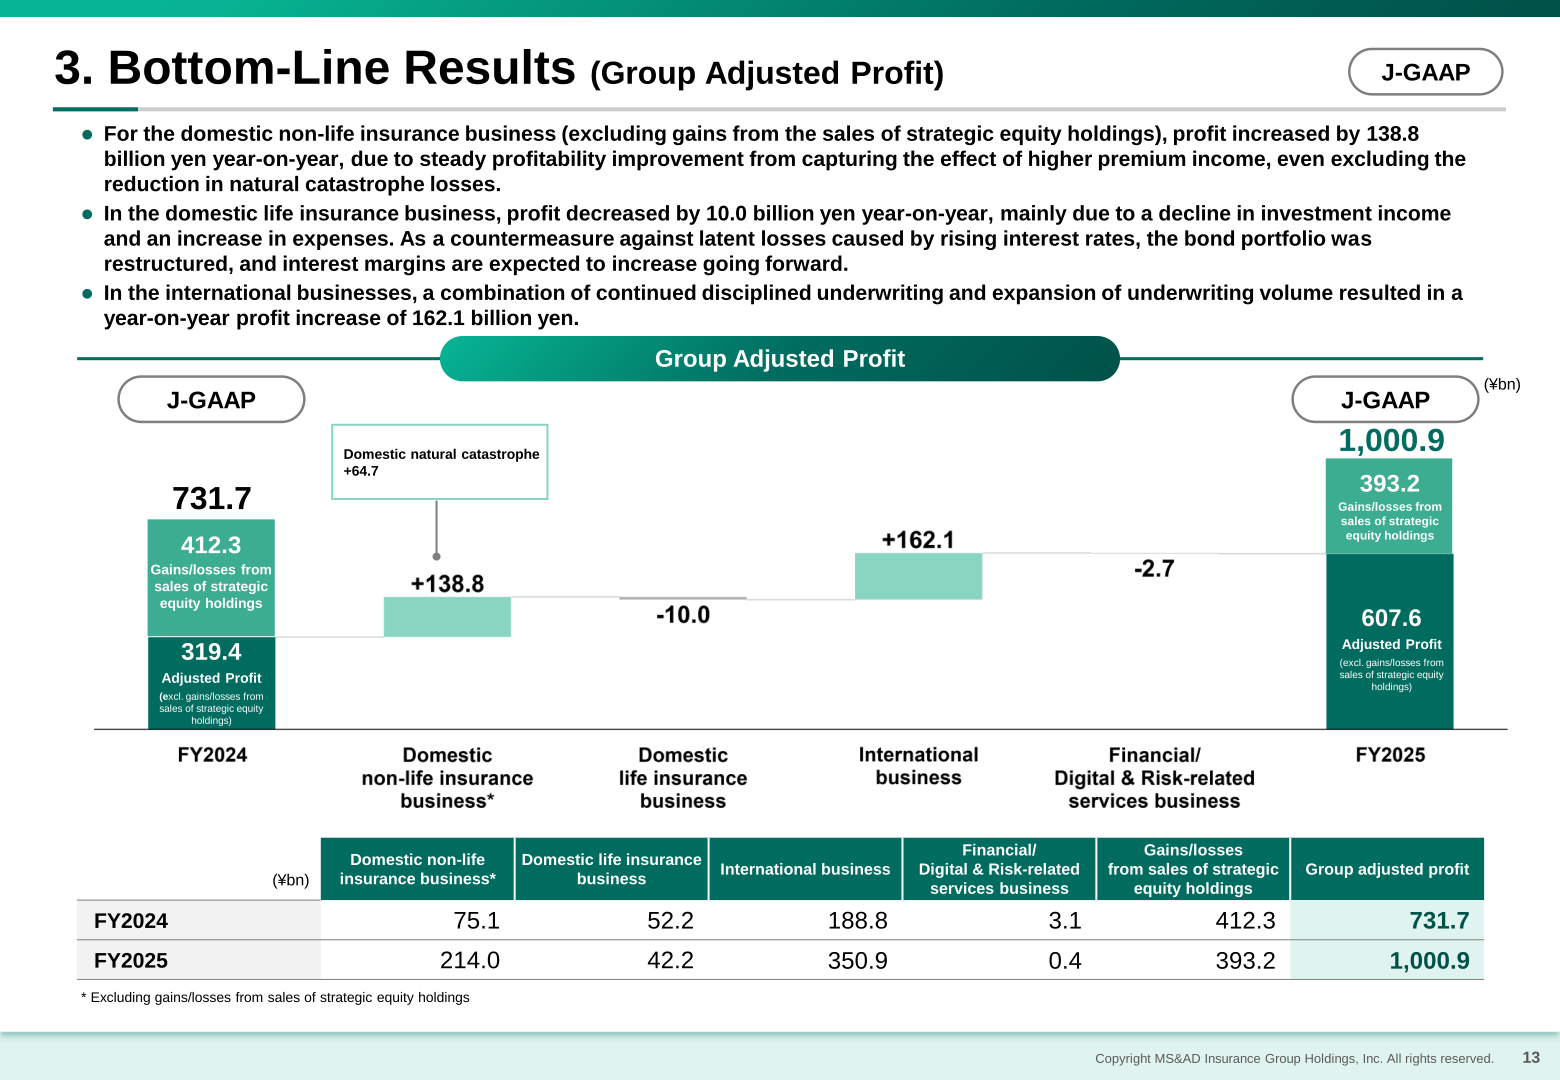
MS&AD Insurance Group Holdings reported group adjusted profit (J-GAAP) of 1,000.9 billion yen for FY2025, up 269.1 billion yen year-on-year; excluding gains from sales of strategic equity holdings, group adjusted profit rose 288.2 billion yen to 607.6 billion yen. Net income increased 95.6 billion yen (+13.8%) year-on-year to 787.3 billion yen. Growth was driven by higher underwriting premiums and lower natural catastrophe losses in the domestic non-life insurance business, and by expanded underwriting volume in the international business, while the domestic life insurance business declined on lower investment income and higher expenses. For FY2026, the company forecasts (IFRS) adjusted profit of 800.0 billion yen, down 118.7 billion yen year-on-year, while adjusted profit excluding gains from sales of strategic equity holdings is expected to increase 6.5 billion yen to 532.0 billion yen.
Consolidated Results (Full-Year Actual)
Net premiums written in non-life insurance increased 330.4 billion yen (+7.1%) year-on-year to 5,004.7 billion yen, mainly due to significant growth at overseas insurance subsidiaries; net premiums written by domestic non-life insurance companies increased 122.6 billion yen to 3,269.6 billion yen, driven by automobile and fire insurance. Premium income from domestic life insurance companies increased 100.6 billion yen (+6.1%) year-on-year, primarily due to increased sales following product revisions at MSP Life. Group adjusted profit and net income both increased year-on-year, as summarized below (J-GAAP).
| Item | FY2025 | FY2024 | Change |
|---|---|---|---|
| Net premiums written (non-life insurance, ¥bn) | 5,004.7 | 4,674.3 | +330.4 (+7.1%) |
| Premium income (life insurance, ¥bn) | 1,741.0 | 1,640.3 | +100.6 (+6.1%) |
| Group adjusted profit (¥bn) | 1,000.9 | 731.7 | +269.1 |
| Group adjusted profit excl. gains from sales of strategic equity holdings (¥bn) | 607.6 | 319.4 | +288.2 |
| Net income (¥bn) | 787.3 | 691.6 | +95.6 (+13.8%) |
Segment Results
By business segment (J-GAAP, group adjusted profit basis), the domestic non-life insurance business (excluding gains from sales of strategic equity holdings) increased 138.8 billion yen year-on-year, reflecting steady profitability improvement from higher premium income even excluding the reduction in natural catastrophe losses. The domestic life insurance business decreased 10.0 billion yen year-on-year, mainly due to lower investment income and higher expenses at MSA Life; as a countermeasure against latent losses caused by rising interest rates, the bond portfolio was restructured, which is expected to increase interest margins going forward. The international business increased 162.1 billion yen year-on-year on continued disciplined underwriting and expanded underwriting volume. By company, net income at domestic non-life insurance companies (MSI+ADI) increased 49.3 billion yen year-on-year, mainly due to higher premium income, reduced natural catastrophe losses, and increased dividend and interest income; net income at domestic life insurance companies decreased 74.9 billion yen year-on-year, mainly due to losses on sales resulting from the replacement of bonds with unrealized losses at MSA Life; net income at overseas insurance subsidiaries increased 77.4 billion yen year-on-year, mainly due to higher premium income, a reduction in natural catastrophe losses, and improvement in general losses.
| Segment | Metric | FY2025 | FY2024 |
|---|---|---|---|
| Domestic non-life insurance business (excl. gains from sales of strategic equity holdings) | Group adjusted profit (¥bn) | 214.0 | 75.1 |
| Domestic life insurance business | Group adjusted profit (¥bn) | 42.2 | 52.2 |
| International business | Group adjusted profit (¥bn) | 350.9 | 188.8 |
| Financial/Digital & Risk-related services business (Others) | Group adjusted profit (¥bn) | 0.4 | 3.1 |
| Gains/losses from sales of strategic equity holdings | Group adjusted profit (¥bn) | 393.2 | 412.3 |
| Domestic non-life insurance companies (MSI+ADI) | Net income (¥bn) | 618.0 | 568.6 |
| Domestic life insurance companies | Net income (¥bn) | -19.6 | 55.3 |
| Overseas insurance subsidiaries | Net income (¥bn) | 261.8 | 184.4 |
FY2026 Forecast
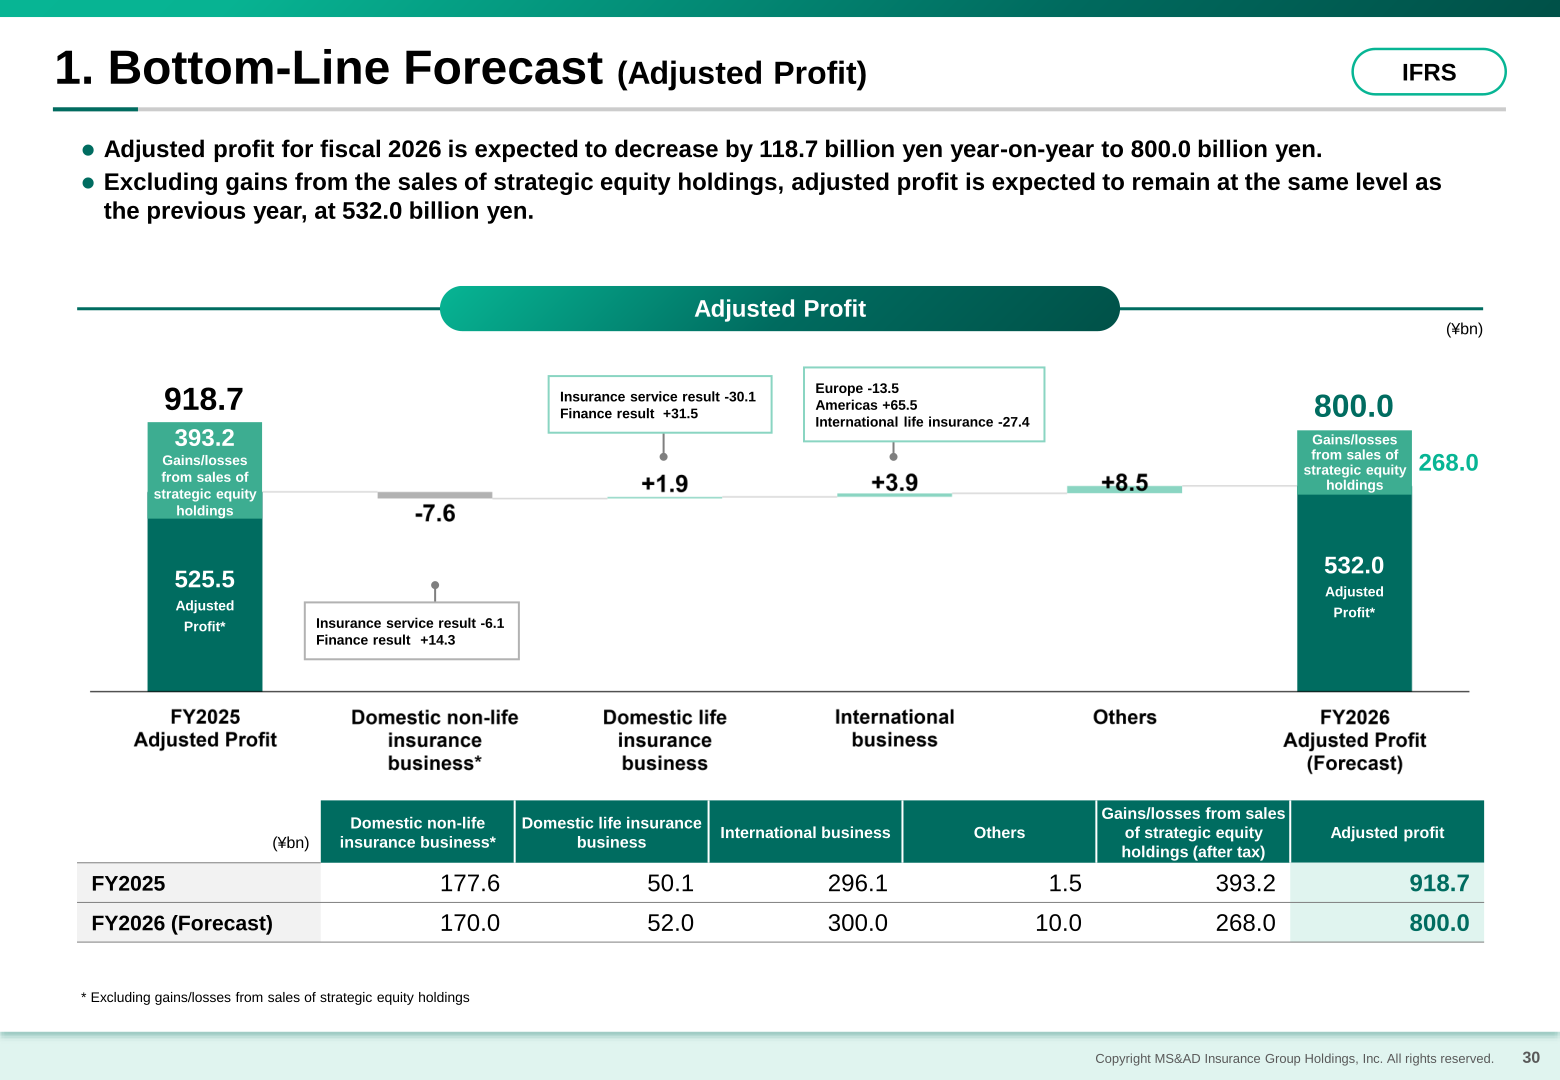
For FY2026, MS&AD forecasts (IFRS) adjusted profit of 800.0 billion yen, down 118.7 billion yen year-on-year, mainly due to a decrease in gains from sales of strategic equity holdings; excluding those gains, adjusted profit is expected to remain roughly flat at 532.0 billion yen. Net income is forecast to decrease 85.6 billion yen year-on-year to 425.0 billion yen. Domestic non-life insurance companies are expected to see net income decrease 105.9 billion yen year-on-year, mainly as natural catastrophe losses return to normal levels (planned domestic natural catastrophe loss of 150.0 billion yen and overseas natural catastrophe loss of 64.0 billion yen, versus 35.1 billion yen of actual FY2025 natural catastrophe loss before tax). Domestic life insurance companies are expected to remain at a similar level as increased profit at MSA Life offsets decreased profit at MSP Life. Net income at overseas insurance subsidiaries is expected to increase 49.5 billion yen year-on-year, mainly due to the inclusion of equity earnings from WRB in the Americas. Major forecast assumptions (IFRS) include a Nikkei stock average of 51,064 yen, USD/JPY of 160, and an effective corporate tax rate of 28.9%.
| Item | Forecast (FY2026) | FY2025 (Actual) |
|---|---|---|
| Insurance revenue (¥bn) | 7,000.0 | 6,436.0 |
| Adjusted profit (¥bn) | 800.0 | 918.7 |
| Adjusted profit excl. gains from sales of strategic equity holdings (¥bn) | 532.0 | 525.5 |
| Domestic non-life insurance business adjusted profit (¥bn) | 438.0 | 570.9 |
| Domestic life insurance business adjusted profit (¥bn) | 52.0 | 50.1 |
| International business adjusted profit (¥bn) | 300.0 | 296.1 |
| Net income (¥bn) | 425.0 | 510.6 |
Shareholder Returns
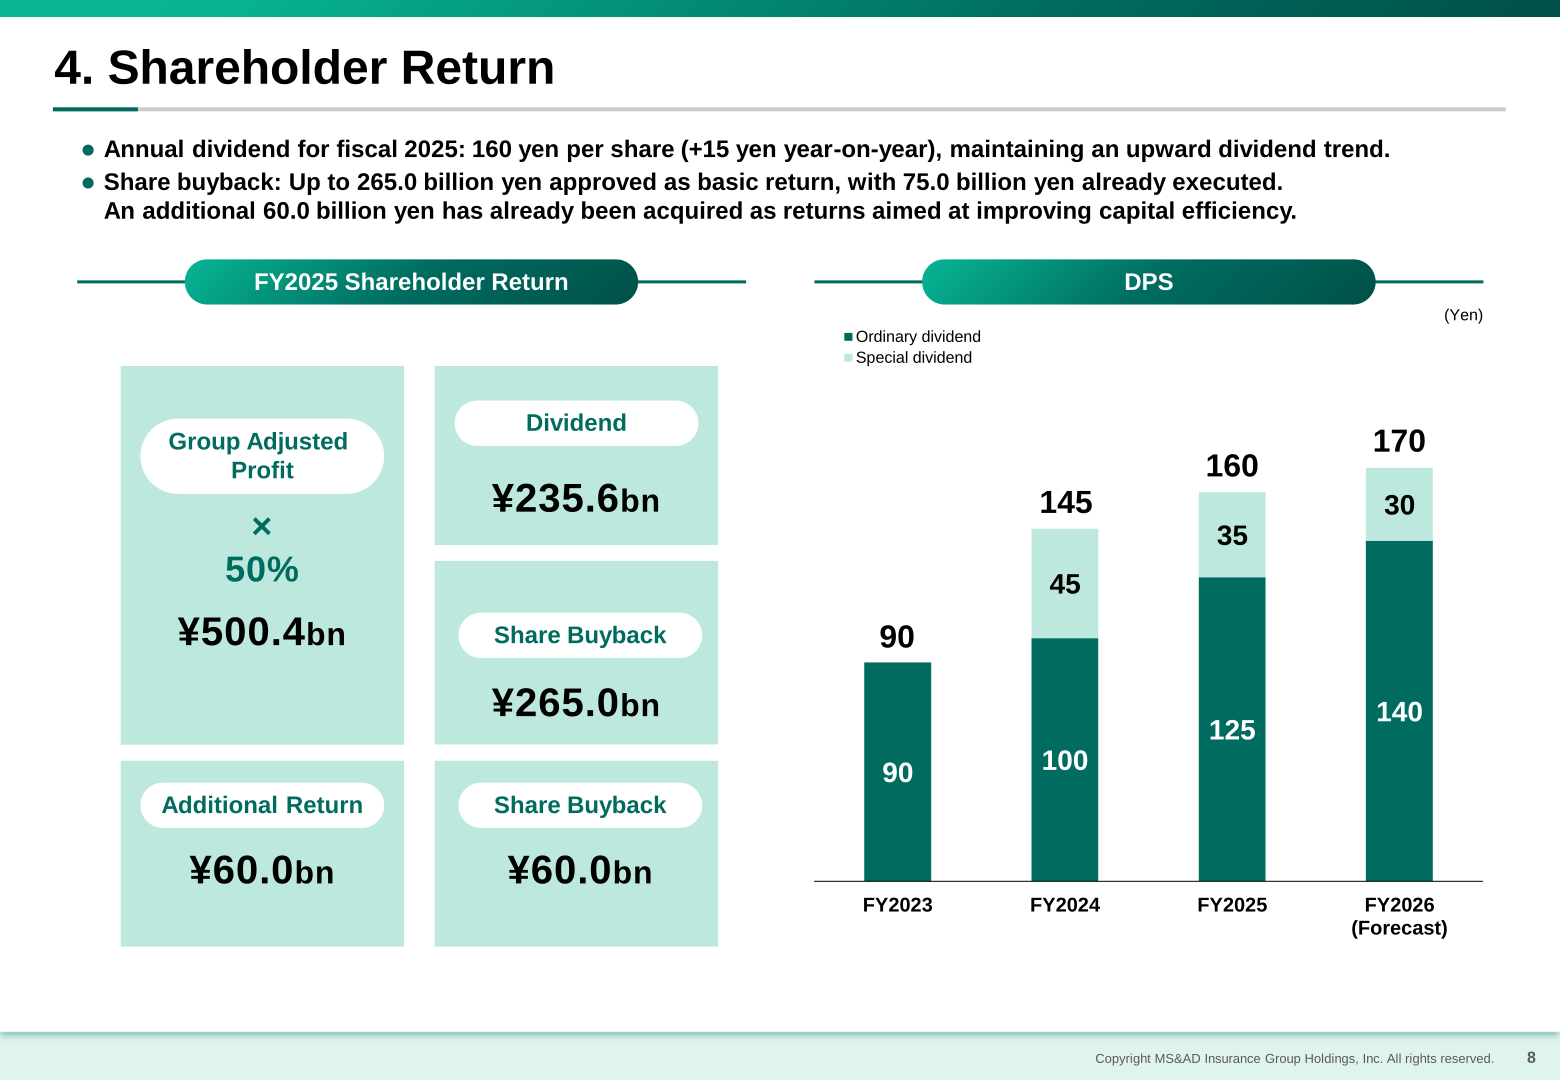
The annual dividend for FY2025 is 160 yen per share, an increase of 15 yen year-on-year and 5 yen from the previous forecast, comprising an interim dividend of 77.5 yen and a year-end dividend of 82.5 yen. As a basic return to shareholders, the company approved a share buyback of up to 265.0 billion yen, of which 75.0 billion yen had already been executed, and additionally acquired 60.0 billion yen as a return aimed at improving capital efficiency. For FY2026, the annual dividend is forecast at 170 yen per share, comprising an ordinary dividend of 140 yen and a special dividend of 30 yen, and the company plans to implement basic returns of 80.0 billion yen via share buyback during the interim period.
| Item | FY2025 (Actual) | FY2026 (Forecast) |
|---|---|---|
| Annual dividend per share (yen) | 160 (interim 77.5 / year-end 82.5) | 170 (ordinary 140 + special 30) |
| Share buyback — basic return | Up to ¥265.0bn approved (¥75.0bn already executed) | Plan to implement ¥80.0bn during the interim period |
| Additional capital-efficiency return (share buyback) | ¥60.0bn already acquired | This cannot be confirmed from the materials. |
Capital Soundness — Economic Solvency Ratio (ESR)
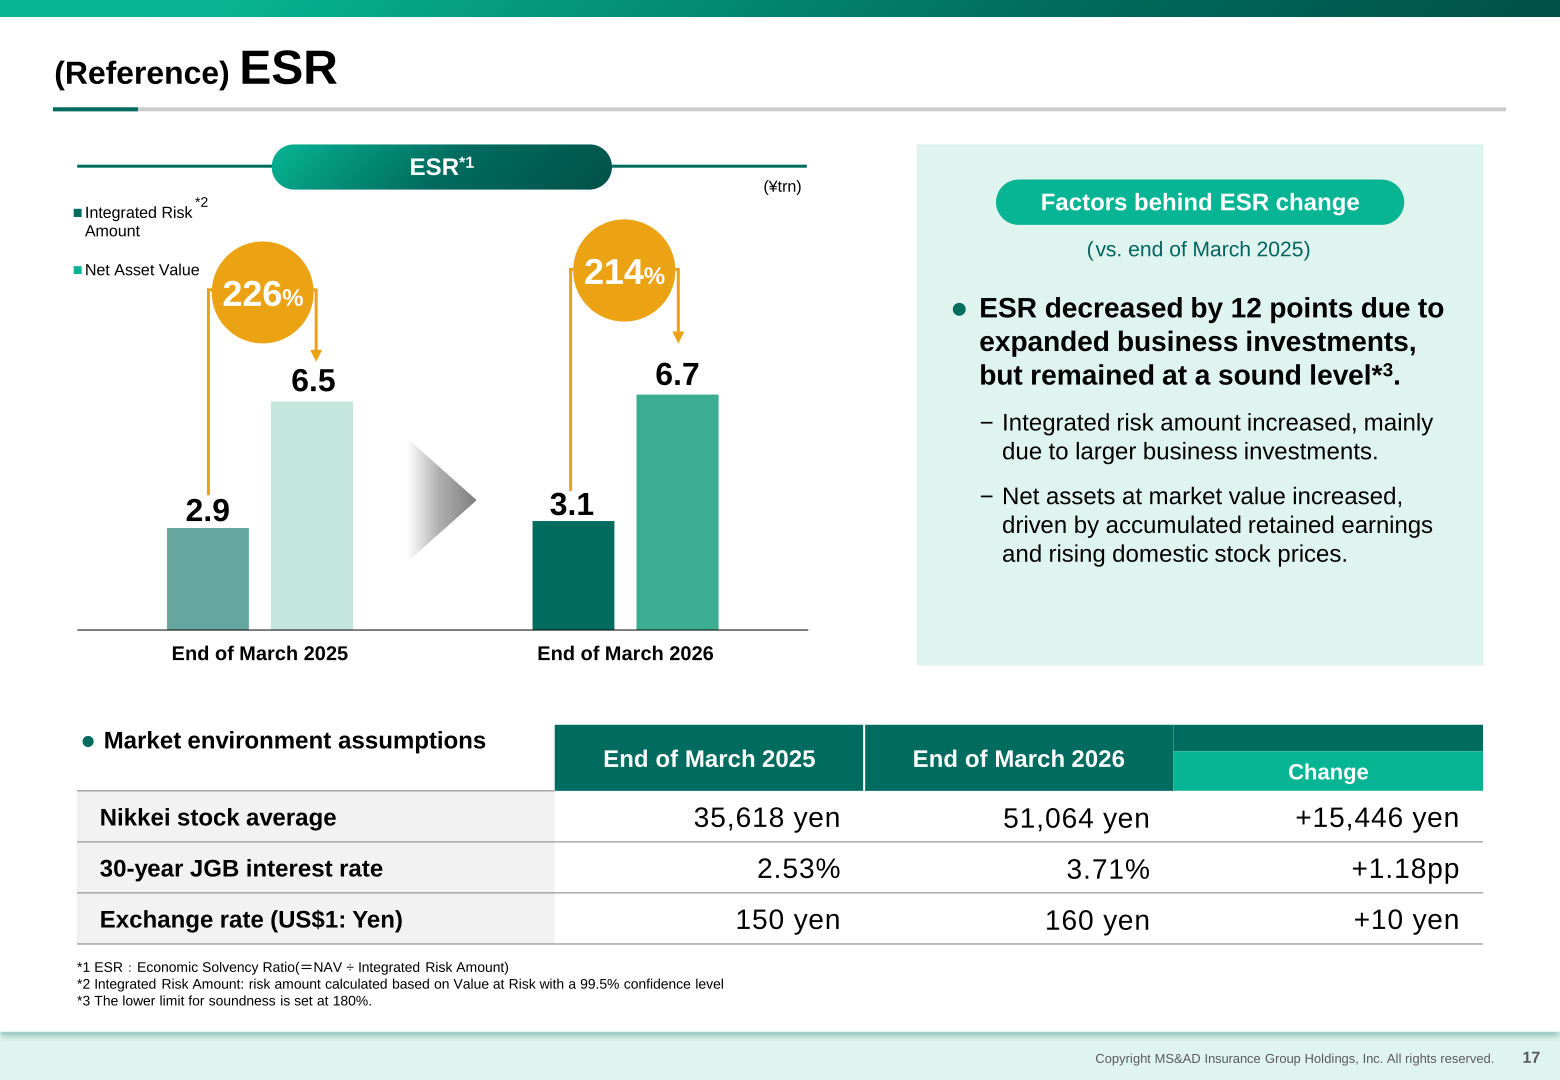
ESR (Economic Solvency Ratio, defined as net asset value divided by the integrated risk amount) decreased 12 points to 214% at the end of March 2026, from 226% at the end of March 2025, due to expanded business investments increasing the integrated risk amount (from 2.9 trillion yen to 3.1 trillion yen). Net asset value at market value increased (from 6.5 trillion yen to 6.7 trillion yen), driven by accumulated retained earnings and rising domestic stock prices. ESR remained above the company’s soundness floor of 180%.
This article is an analysis based on publicly available information and is not a recommendation to buy or sell any specific securities. Investment decisions are your own responsibility.
![[Obayashi] Investors’ Guide 2026 — The Complete 24-Article Breakdown](https://japan-equity.com/wp-content/uploads/2026/07/hub_cover-1024x1024.png)
![[Obayashi] IR & SR Policy — Feeding Dialogue Back into Management](https://japan-equity.com/wp-content/uploads/2026/07/p32_sq-1024x1024.jpg)
![[Obayashi] Domestic Civil Engineering — Resilience Spending Supports 9.6% Margin](https://japan-equity.com/wp-content/uploads/2026/07/p11_sq-1024x1024.jpg)
![[Obayashi] Overseas Construction — Orders Reach ¥1.2tn](https://japan-equity.com/wp-content/uploads/2026/07/p15_sq-1024x1024.jpg)
![[Obayashi] Share Price & External Ratings — vs TOPIX, ESG Index Inclusion](https://japan-equity.com/wp-content/uploads/2026/07/p40_sq-1024x1024.jpg)
![[Construction] ¥75.5tn Investment, Shrinking Workforce — Big-5 Market Share](https://japan-equity.com/wp-content/uploads/2026/07/p12_sq-1024x1024.jpg)



![[Obayashi] Capital Policy & Shareholder Returns — ROE 10%+, DOE ~5%, ¥100bn Buyback](https://japan-equity.com/wp-content/uploads/2026/07/p27_sq-1024x1024.jpg)
![[Obayashi] Reducing Cross-Shareholdings — ¥285.2bn Sold in Five Years](https://japan-equity.com/wp-content/uploads/2026/07/p29_sq-1024x1024.jpg)
![[Obayashi] ¥750bn Investment Plan — ¥300bn to Development, ¥190bn to Tech/DX](https://japan-equity.com/wp-content/uploads/2026/07/p30_sq-1024x1024.jpg)
![[Obayashi] MTP2022 KPIs — Operating Profit ~2x Target, ROE 14.4%](https://japan-equity.com/wp-content/uploads/2026/07/p25_sq-1024x1024.jpg)
![[Obayashi] Cash Allocation — ¥420bn Investment CF Over Five Years](https://japan-equity.com/wp-content/uploads/2026/07/p26_sq-1024x1024.jpg)
![[Obayashi] Green Energy — 44 Plants, 344MW, and the Green Hydrogen Challenge](https://japan-equity.com/wp-content/uploads/2026/07/p21_sq-1024x1024.jpg)
![[Obayashi] Tackling the Labor Shortage — Robotics Construction®](https://japan-equity.com/wp-content/uploads/2026/07/p14_sq-1024x1024.jpg)
