
This article is based on publicly available IR materials and is not a recommendation to buy or sell any specific securities.
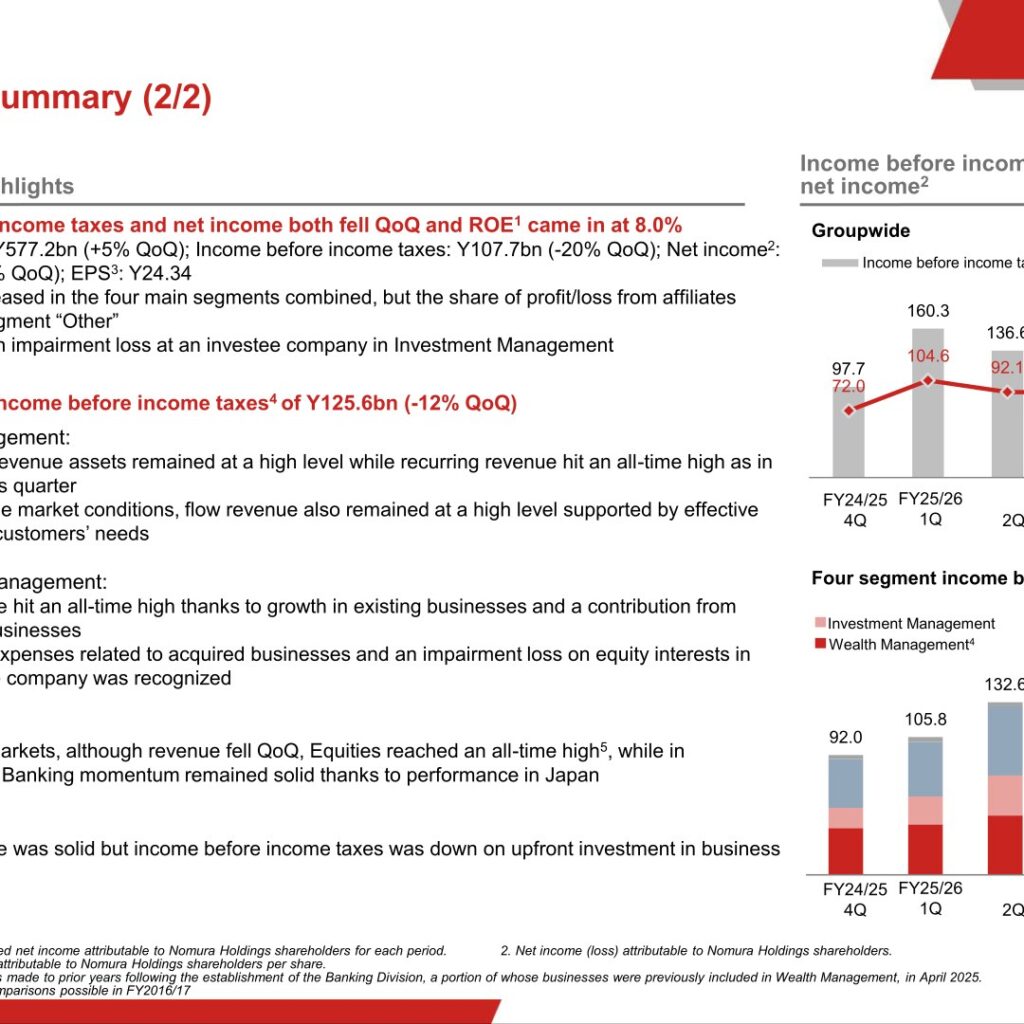
Nomura Holdings, Inc. reported record results for the fiscal year ended March 2026 (FY2025/26). Net revenue was Y2,167.7bn (+15% YoY), income before income taxes was Y539.8bn (+14% YoY), and net income attributable to Nomura Holdings, Inc. (“NHI”) shareholders was Y362.1bn (+6% YoY), setting a record high for the second straight year. Full-year ROE was 10.1%, meeting the quantitative target in the company’s 2030 Vision for the second year in a row. Combined income before income taxes of the four business segments reached an all-time high of Y506.9bn (+16% YoY), with Wealth Management and Wholesale both achieving their highest income before income taxes since their respective establishments.
Consolidated Results (FY2025/26 Full Year)
Net revenue rose 15% YoY to Y2,167.7bn, while non-interest expenses increased 15% YoY to Y1,627.9bn. Income before income taxes increased 14% YoY to Y539.8bn, and net income attributable to NHI shareholders increased 6% YoY to Y362.1bn. Diluted EPS was Y118.99, up 7% YoY. The full-year effective tax rate was 30.6%, compared with 26.4% in FY2024/25.
| Item | FY2024/25 | FY2025/26 | YoY |
|---|---|---|---|
| Net revenue | Y1,892.5bn | Y2,167.7bn | 15% |
| Non-interest expenses | Y1,420.5bn | Y1,627.9bn | 15% |
| Income before income taxes | Y472.0bn | Y539.8bn | 14% |
| Net income (attributable to NHI shareholders) | Y340.7bn | Y362.1bn | 6% |
| Diluted EPS | Y111.03 | Y118.99 | 7% |
| BPS (NHI shareholders’ equity per share) | Y1,174.10 | Y1,277.99 | 11% |
| ROE | 10.0% | 10.1% | – |
| Effective tax rate | 26.4% | 30.6% | – |
Segment Results
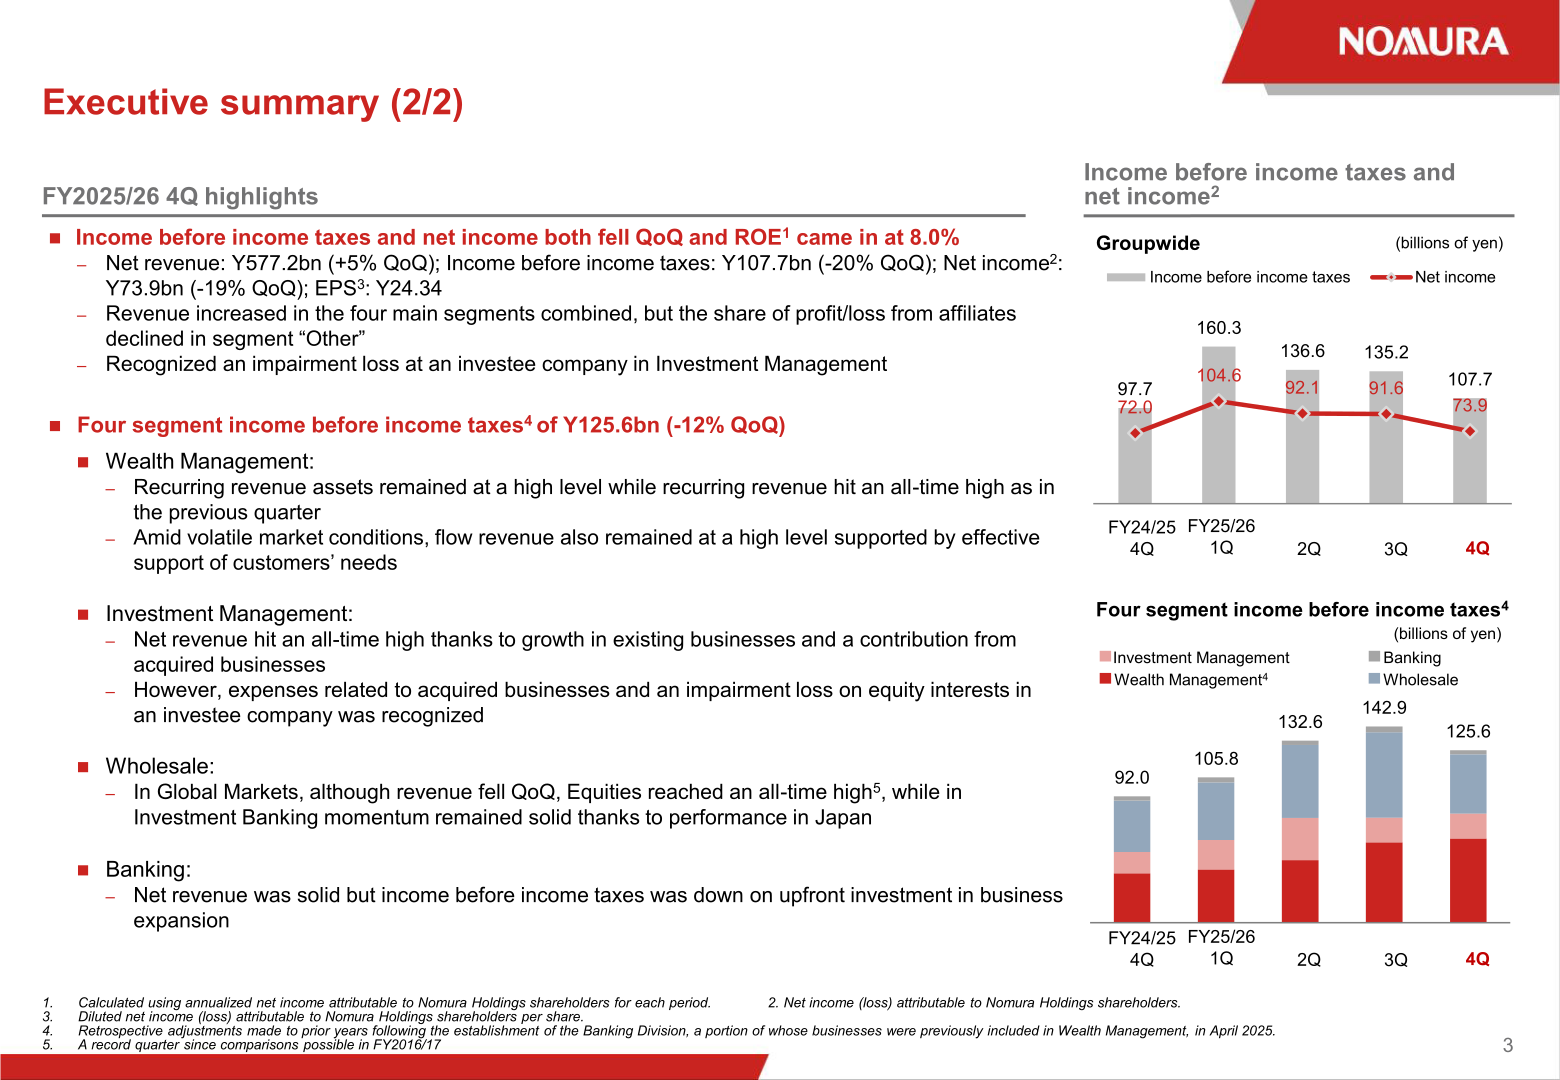
Combined income before income taxes of the four business segments (Wealth Management, Investment Management, Wholesale and Banking) reached an all-time high of Y506.9bn, up 16% YoY. Wealth Management’s asset management-based business model gained further momentum, with substantial growth in major KPIs. Investment Management’s assets under management rose by more than 50% over the year to around Y136.9trn, with a substantial increase in the stable business revenue base. Wholesale saw revenue growth in all regions, with both Global Markets and Investment Banking achieving record-high revenues. Banking saw solid growth in its business base and made steady progress toward the scheduled launch of a deposit sweep service in FY2026/27.
| Segment | FY2024/25 Income before income taxes | FY2025/26 Income before income taxes | YoY |
|---|---|---|---|
| Wealth Management | Y166.2bn | Y204.0bn | 23% |
| Investment Management | Y89.6bn | Y88.3bn | -1% |
| Wholesale | Y166.3bn | Y200.6bn | 21% |
| Banking | Y16.4bn | Y14.0bn | -14% |
| Four segment total | Y438.4bn | Y506.9bn | 16% |
| Other | Y35.1bn | Y24.6bn | -30% |
| Unrealized gain (loss) on investments held for operating purposes | Y-1.5bn | Y8.3bn | – |
| Income before income taxes (Consolidated) | Y472.0bn | Y539.8bn | 14% |
Wealth Management: Full-year net revenue was Y487.9bn (+13% YoY) and income before income taxes was Y204.0bn (+23% YoY), the highest level since the division was established in the fiscal year ended March 2002. The recurring revenue cost coverage ratio rose to 72%, mainly reflecting revenue growth, while disciplined cost control was maintained. Net inflows of recurring revenue assets remained at a high level (+Y422.8bn in the fourth quarter), the 16th consecutive quarter of strong net inflows, and recurring revenue reached a record high. In the fourth quarter, total sales were Y11,675.0bn, up 75% QoQ, driven by more than a doubling of stock sales on major tender offers (around Y4trn) and primary deals.
Investment Management: Full-year net revenue was Y258.5bn (+34% YoY) and income before income taxes was Y88.3bn (-1% YoY). Assets under management reached an all-time high of Y136.9trn. Business revenue, which constitutes stable revenue, reached a record high, driven by growth in existing businesses and the expansion of international businesses through acquisition. Costs increased due to expenses attributable to acquired businesses, as well as a fourth-quarter impairment loss on the company’s equity interest in an investee company (a minority interest in a forestry asset management company).
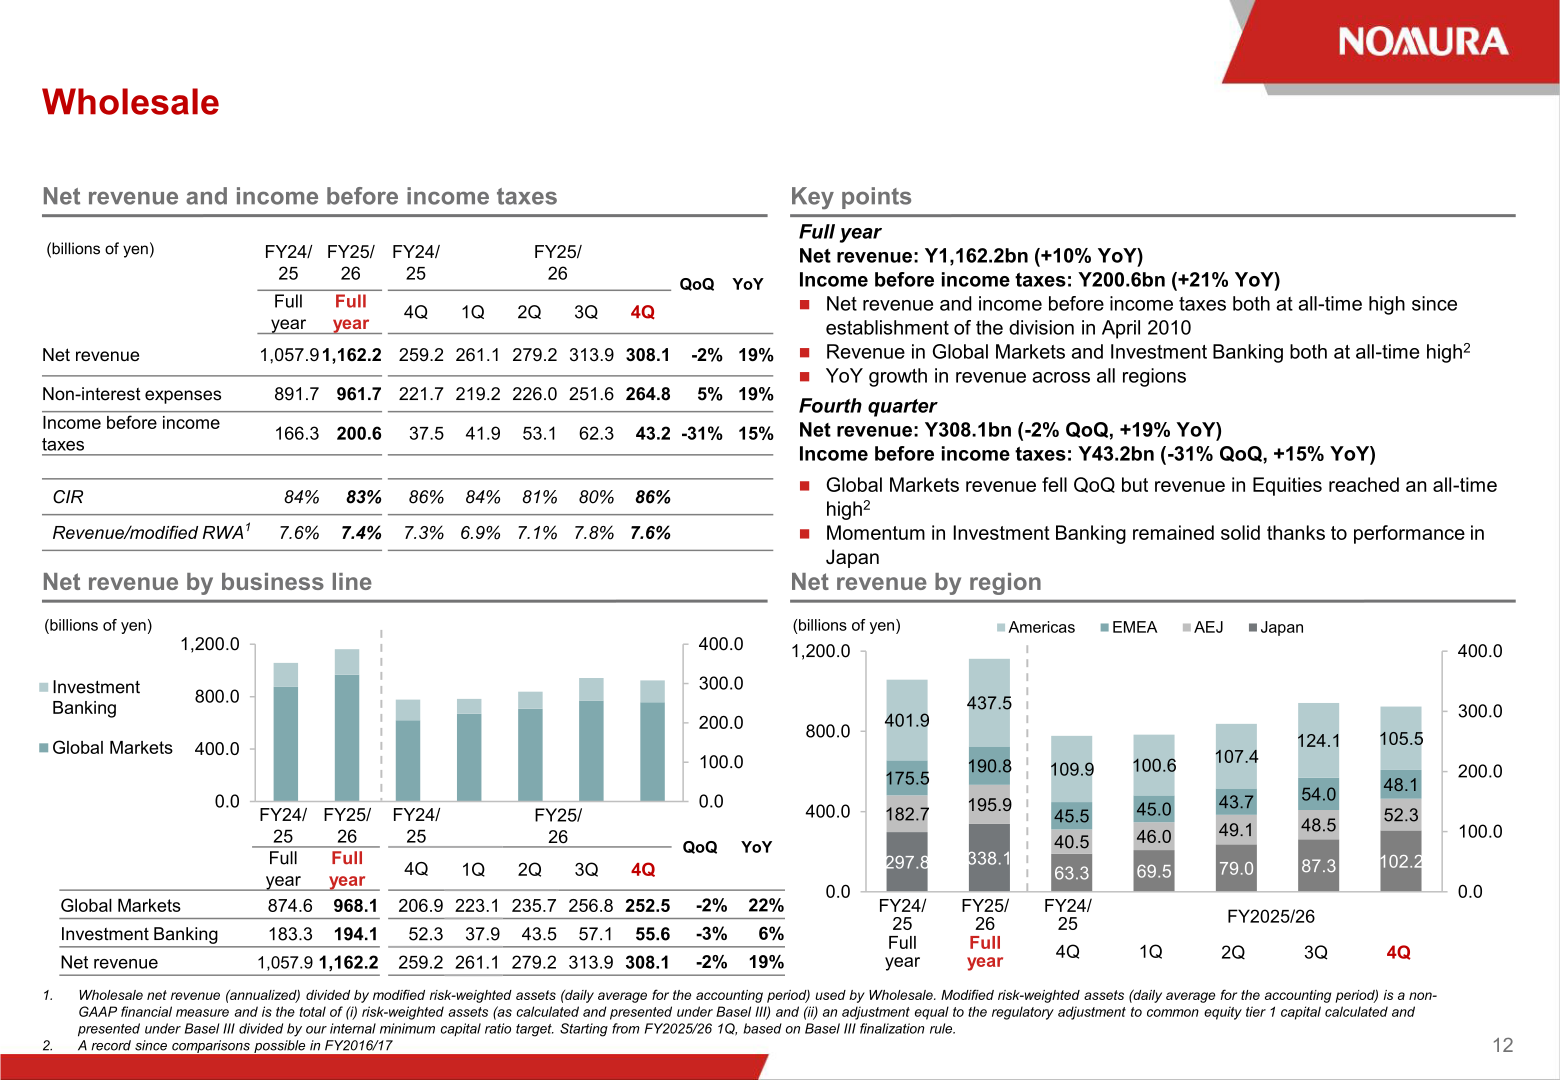
Wholesale: Full-year net revenue was Y1,162.2bn (+10% YoY) and income before income taxes was Y200.6bn (+21% YoY), both at all-time highs since the division’s establishment in April 2010, with revenue growth across all regions. Within Wholesale, Global Markets net revenue was Y968.1bn (+11% YoY), with both Fixed Income and Equities revenue at all-time highs. Investment Banking net revenue was Y194.1bn (+6% YoY), with Japan and international net revenues both at their highest levels since comparisons became possible in FY2016/17. Nomura ranked No.1 in M&A-Japan for FY2025/26 (global ranking 16th) and achieved a 4-year streak at No.1 in ECM-Japan, receiving the House of the Year award, Top in the Overall Category.
Banking: Full-year net revenue was Y53.9bn (+14% YoY), while income before income taxes declined 14% YoY to Y14.0bn on upfront investment in business expansion. Account openings and loan executions were both at high levels amid an increased profile of the loan business, and the investment trust balance grew on both market factors and the establishment of new trusts. The division continued to make steady advances toward the scheduled launch of a deposit sweep service in FY2026/27.
Non-Interest Expenses
Non-interest expenses for FY2025/26 totaled Y1,627.9bn, up from Y1,420.5bn in FY2024/25. Compensation and benefits rose 13% YoY on an increase in bonus provisions linked to performance and the effect of a business acquisition. Commissions and floor brokerage rose 25% YoY on higher trading volume, a temporary increase due to changes in accounting presentation, and the effect of a business acquisition.
| Item | FY2024/25 | FY2025/26 |
|---|---|---|
| Compensation and benefits | Y732.4bn | Y829.5bn |
| Commissions and floor brokerage | Y177.5bn | Y221.9bn |
| Information processing and communications | Y227.0bn | Y248.4bn |
| Occupancy and related depreciation | Y70.2bn | Y71.5bn |
| Business development expenses | Y27.1bn | Y33.7bn |
| Other | Y186.4bn | Y222.9bn |
| Total non-interest expenses | Y1,420.5bn | Y1,627.9bn |
Financial Position and Capital Ratios
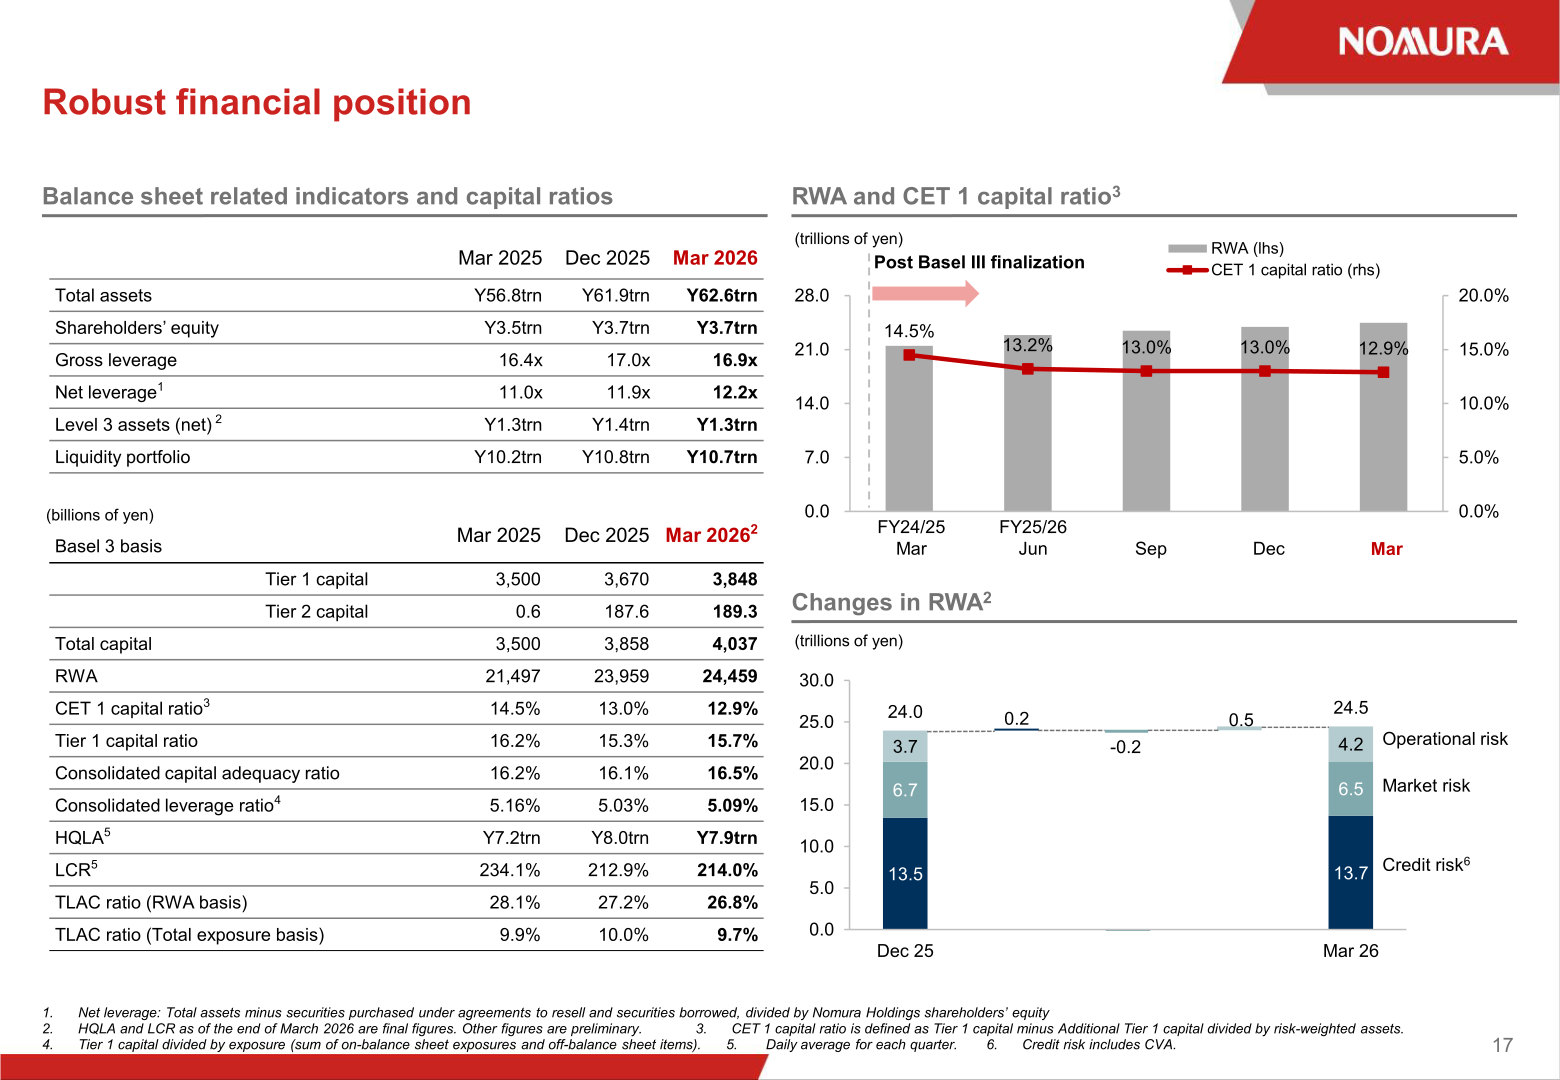
Nomura’s financial position remained robust. Total assets were Y62.6trn at March 31, 2026, up from Y56.8trn a year earlier, and total NHI shareholders’ equity was Y3.7trn, up from Y3.5trn. On a post-Basel III finalization basis, the CET1 capital ratio was 12.9% at March 2026, compared with 14.5% at March 2025, and the Tier 1 capital ratio was 15.7%. The consolidated capital adequacy ratio was 16.5%, the consolidated leverage ratio was 5.09%, and the liquidity coverage ratio (LCR) was 214.0%.
| Item | Mar 2025 | Mar 2026 |
|---|---|---|
| Total assets | Y56.8trn | Y62.6trn |
| NHI shareholders’ equity | Y3.5trn | Y3.7trn |
| Gross leverage | 16.4x | 16.9x |
| Net leverage | 11.0x | 12.2x |
| CET 1 capital ratio | 14.5% | 12.9% |
| Tier 1 capital ratio | 16.2% | 15.7% |
| Consolidated capital adequacy ratio | 16.2% | 16.5% |
| Consolidated leverage ratio | 5.16% | 5.09% |
| LCR | 234.1% | 214.0% |
| TLAC ratio (RWA basis) | 28.1% | 26.8% |
Shareholder Returns
Nomura pursued proactive shareholder returns in FY2025/26: dividend per share was Y24 for the year-end dividend, for an annual dividend of Y51, with a dividend payout ratio of 41%.
This article is an analysis based on publicly available information and is not a recommendation to buy or sell any specific securities. Investment decisions are your own responsibility.
![[Obayashi] Investors’ Guide 2026 — The Complete 24-Article Breakdown](https://japan-equity.com/wp-content/uploads/2026/07/hub_cover-1024x1024.png)
![[Obayashi] IR & SR Policy — Feeding Dialogue Back into Management](https://japan-equity.com/wp-content/uploads/2026/07/p32_sq-1024x1024.jpg)
![[Obayashi] Real Estate Development — 18.7% Margin, ¥287.7bn Unrealized Gains](https://japan-equity.com/wp-content/uploads/2026/07/p20_sq-1024x1024.jpg)
![[Obayashi] Domestic Civil Engineering — Resilience Spending Supports 9.6% Margin](https://japan-equity.com/wp-content/uploads/2026/07/p11_sq-1024x1024.jpg)
![[Obayashi] Share Price & External Ratings — vs TOPIX, ESG Index Inclusion](https://japan-equity.com/wp-content/uploads/2026/07/p40_sq-1024x1024.jpg)
![[Construction] ¥75.5tn Investment, Shrinking Workforce — Big-5 Market Share](https://japan-equity.com/wp-content/uploads/2026/07/p12_sq-1024x1024.jpg)



![[Obayashi] Capital Policy & Shareholder Returns — ROE 10%+, DOE ~5%, ¥100bn Buyback](https://japan-equity.com/wp-content/uploads/2026/07/p27_sq-1024x1024.jpg)
![[Obayashi] Reducing Cross-Shareholdings — ¥285.2bn Sold in Five Years](https://japan-equity.com/wp-content/uploads/2026/07/p29_sq-1024x1024.jpg)
![[Obayashi] ¥750bn Investment Plan — ¥300bn to Development, ¥190bn to Tech/DX](https://japan-equity.com/wp-content/uploads/2026/07/p30_sq-1024x1024.jpg)
![[Obayashi] MTP2022 KPIs — Operating Profit ~2x Target, ROE 14.4%](https://japan-equity.com/wp-content/uploads/2026/07/p25_sq-1024x1024.jpg)
![[Obayashi] Cash Allocation — ¥420bn Investment CF Over Five Years](https://japan-equity.com/wp-content/uploads/2026/07/p26_sq-1024x1024.jpg)
![[Obayashi] Green Energy — 44 Plants, 344MW, and the Green Hydrogen Challenge](https://japan-equity.com/wp-content/uploads/2026/07/p21_sq-1024x1024.jpg)
![[Obayashi] Tackling the Labor Shortage — Robotics Construction®](https://japan-equity.com/wp-content/uploads/2026/07/p14_sq-1024x1024.jpg)
