
This article is based on publicly available IR materials and is not a recommendation to buy or sell any specific securities.
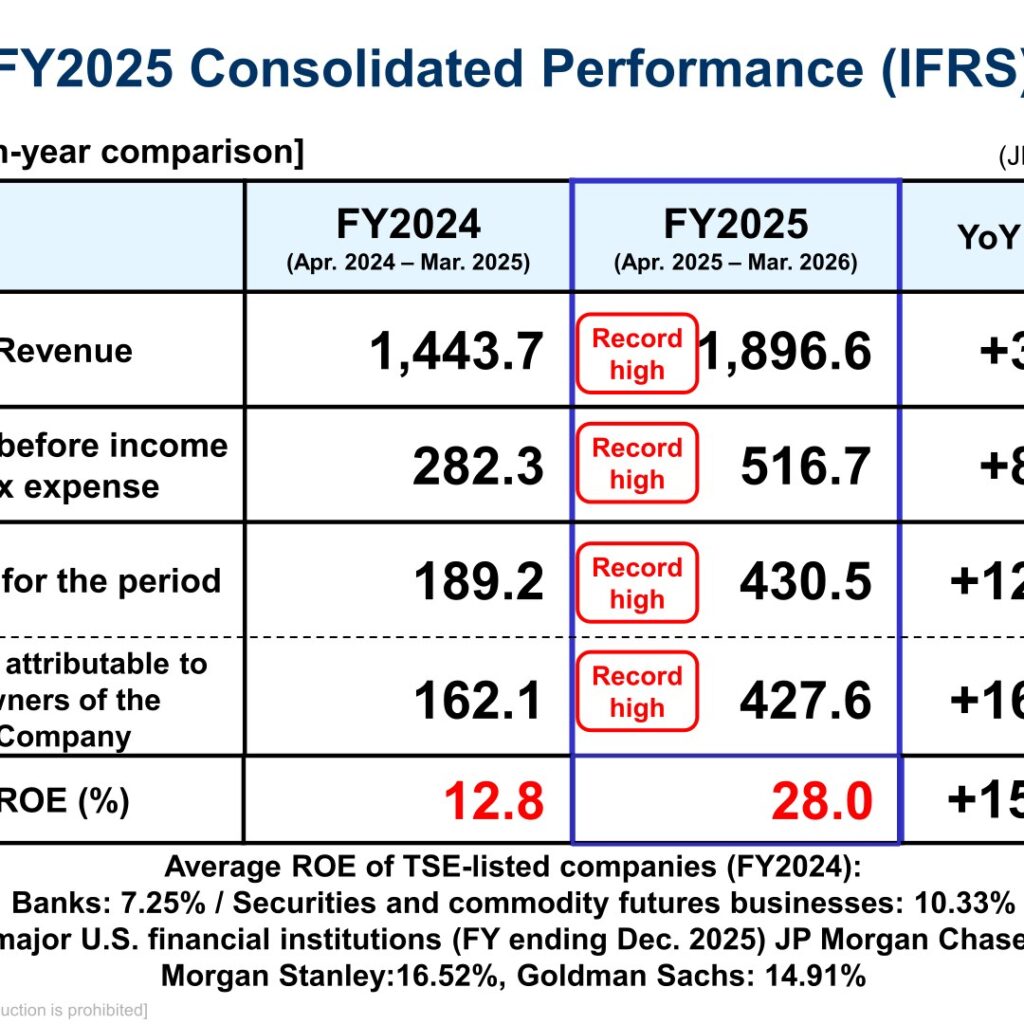
SBI Holdings reported FY2025 (Apr. 2025 – Mar. 2026) revenue of JPY 1,896.6bn, up 31.4% year on year and a record high, with consolidated profit before income tax expense up 83.0% YoY to a record-high JPY 516.7bn, a result that exceeded the JPY 500bn target set in the medium-term vision announced in May 2025. Profit attributable to owners of the Company rose 163.7% YoY to JPY 427.6bn and ROE reached 28.0%, against a 15% ROE target set for FY2028, the Group’s 30th anniversary. The year-end dividend for FY2025 is to be JPY75 per share, which together with the interim dividend of JPY20 per share already distributed brings the annual dividend to JPY95 per share, an increase of JPY10 on FY2024. Dividend amounts are presented after reflecting a 2-for-1 stock split of common shares effective December 1, 2025.
Consolidated Results (Full-Year Actual)
All four headline profit and loss lines were record highs. Revenue increased 31.4% YoY to JPY 1,896.6bn, profit before income tax expense rose 83.0% to JPY 516.7bn, profit for the period rose 127.6% to JPY 430.5bn, and profit attributable to owners of the Company rose 163.7% to JPY 427.6bn. ROE improved by 15.2 points to 28.0%. For reference, the presentation cites the FY2024 average ROE of TSE-listed companies at 7.25% for banks and 10.33% for securities and commodity futures businesses, and ROE for the fiscal year ending December 2025 of 16.69% at JP Morgan Chase, 16.52% at Morgan Stanley and 14.91% at Goldman Sachs.
| Item (JPY billion, IFRS) | FY2025 (Apr. 2025 – Mar. 2026) | FY2024 (Apr. 2024 – Mar. 2025) | YoY (%) |
|---|---|---|---|
| Revenue | 1,896.6 | 1,443.7 | +31.4 |
| Profit before income tax expense | 516.7 | 282.3 | +83.0 |
| Profit for the period | 430.5 | 189.2 | +127.6 |
| Profit attributable to owners of the Company | 427.6 | 162.1 | +163.7 |
| ROE (%) | 28.0 | 12.8 | +15.2p |
Segment Results
Revenue rose year on year in all five segments, and the Financial Services Business, Asset Management Business, Crypto-asset Business and Next Gen Business each posted record-high revenue. Profit before income tax expense in the Financial Services Business more than doubled to a record-high JPY 425.0bn, the Asset Management Business rose 58.5% to JPY 8.6bn, and the Next Gen Business swung to a record-high profit of JPY 22.0bn from a loss of JPY 9.9bn. The PE Investment Business declined 13.9% to JPY 82.0bn and the Crypto-asset Business was broadly flat at JPY 21.2bn. From FY2025 the accounting for valuation gains and losses on unlisted operating investment securities held by the Financial Services Business has been changed and is now recognized in the PE Investment Business, and FY2024 figures were reclassified accordingly; the Investment Business was renamed the PE Investment Business as of April 2025.
| Segment (JPY billion) | Revenue FY2025 | Revenue FY2024 | Revenue YoY (%) | Profit before income tax expense FY2025 | Profit before income tax expense FY2024 | Profit YoY (%) |
|---|---|---|---|---|---|---|
| Financial Services Business | 1,582.5 | 1,174.1 | +34.8 | 425.0 | 197.3 | +115.4 |
| Asset Management Business | 41.6 | 33.8 | +23.1 | 8.6 | 5.4 | +58.5 |
| PE Investment Business | 158.3 | 140.8 | +12.4 | 82.0 | 95.3 | -13.9 |
| Crypto-asset Business | 89.6 | 80.8 | +10.9 | 21.2 | 21.2 | -0.1 |
| Next Gen Business | 56.2 | 30.7 | +83.2 | 22.0 | -9.9 | ― |
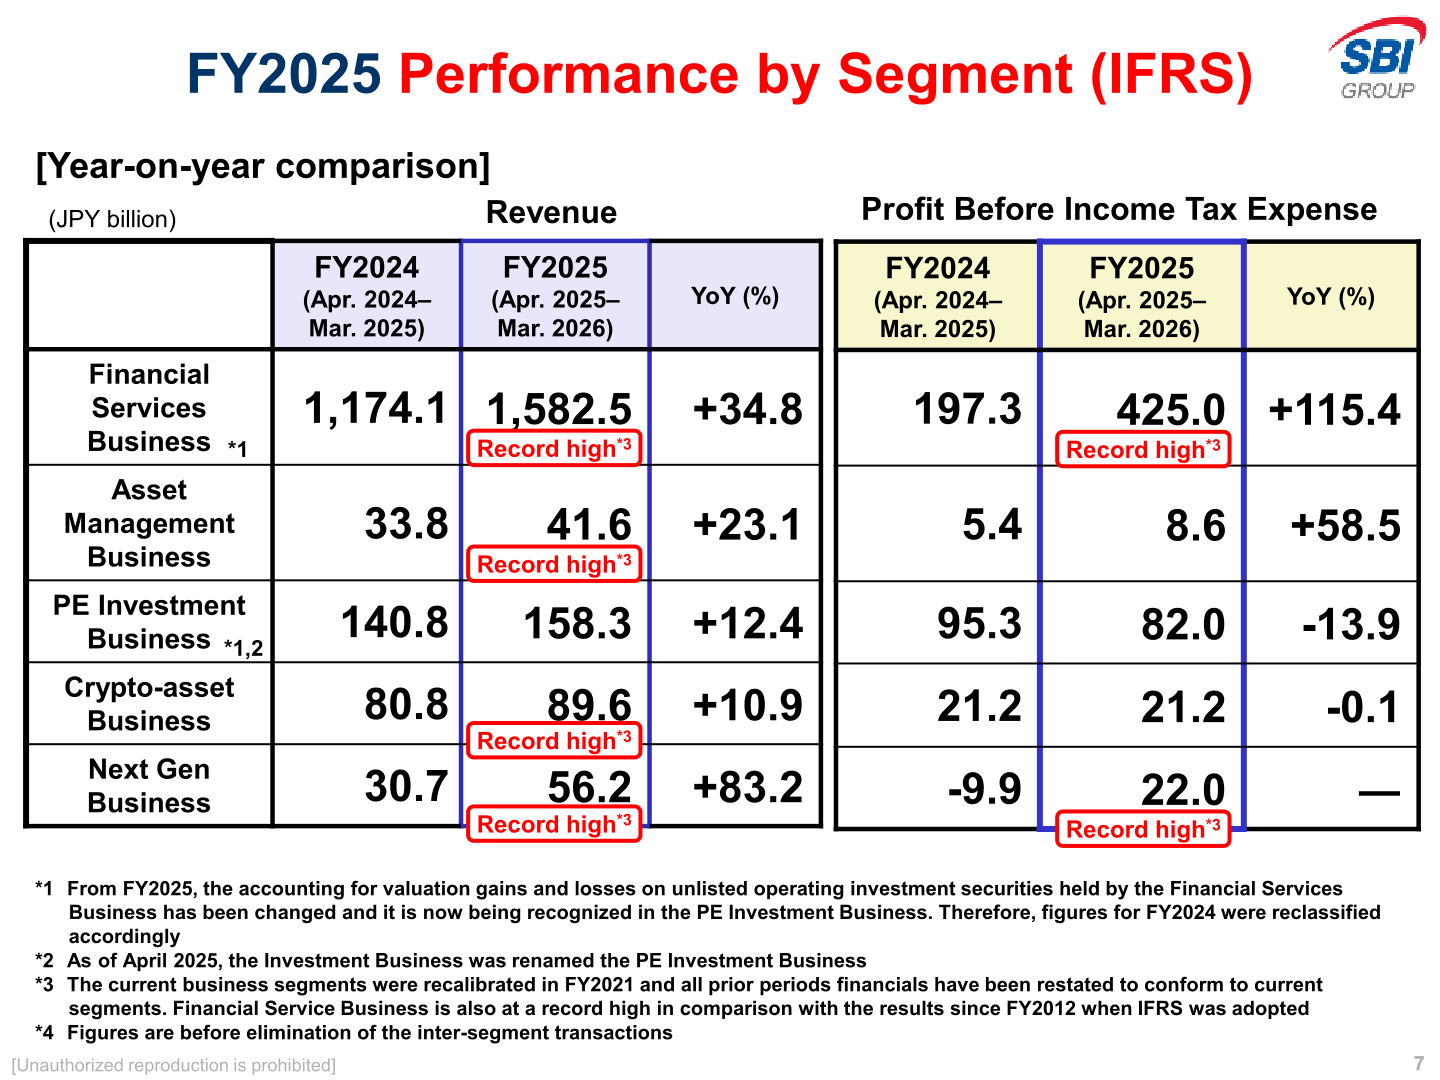
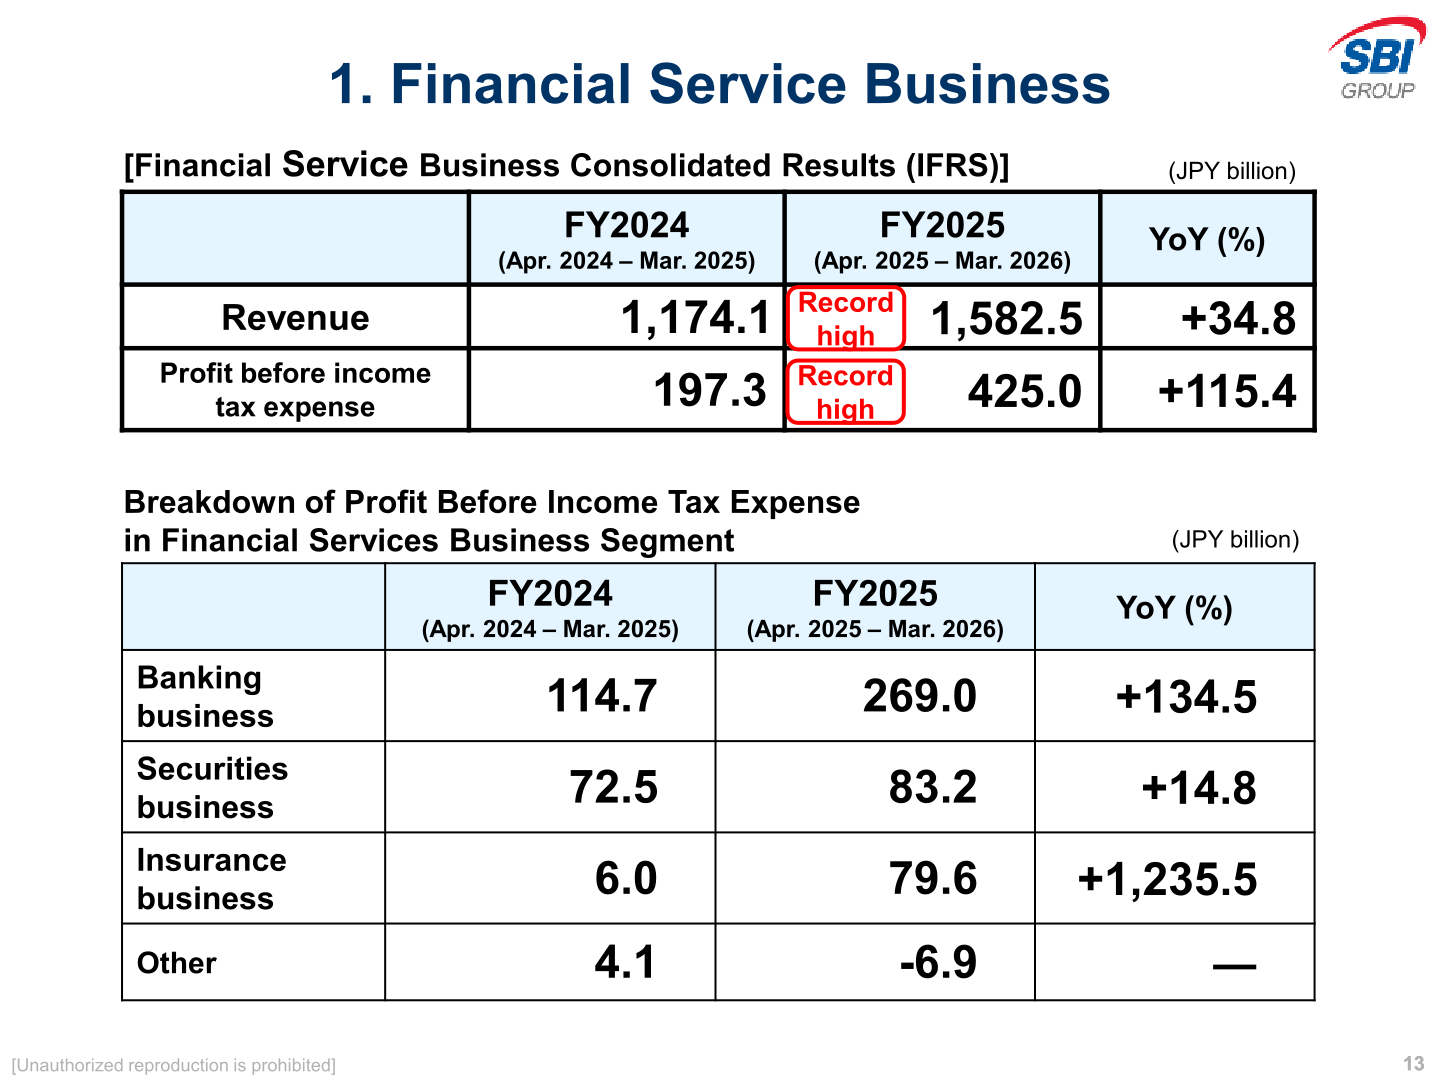
Within the Financial Services Business, the banking business lifted profit before income tax expense 134.5% YoY to JPY 269.0bn, the securities business rose 14.8% to JPY 83.2bn, and the insurance business rose 1,235.5% to JPY 79.6bn, while Other was a loss of JPY 6.9bn. SBI Shinsei Bank’s profit attributable to owners of the company (J-GAAP) was approx. JPY 113.4bn, due to an increase in lending margins associated with the expansion of the balance of operating assets, as well as increases in housing loans and loan-related fees and a decrease in income taxes, among other factors. SBI SECURITIES posted record-high consolidated operating revenue of JPY 284.6bn (+19.1% YoY) and operating income of JPY 86.8bn (+12.6% YoY) under J-GAAP, with profit attributable to owners of the parent of JPY 53.6bn (+11.9% YoY) even after a total extraordinary loss of approximately JPY 19.5bn for compensation related to unauthorized access and provision of reserve for financial instruments transaction liabilities.
| Financial Services Business — profit before income tax expense (JPY billion) | FY2025 (Apr. 2025 – Mar. 2026) | FY2024 (Apr. 2024 – Mar. 2025) | YoY (%) |
|---|---|---|---|
| Banking business | 269.0 | 114.7 | +134.5 |
| Securities business | 83.2 | 72.5 | +14.8 |
| Insurance business | 79.6 | 6.0 | +1,235.5 |
| Other | -6.9 | 4.1 | ― |
In the Asset Management Business, AUM at each company increased steadily backed by a favorable domestic stock market and SBI Global Asset Management Group’s AUM exceeded JPY 12tn; SBI Global Asset Management’s consolidated revenue (J-GAAP) rose 140.8% to JPY 27.9bn and profit attributable to owners of the Company rose 86.6% to JPY 3.1bn. In the PE Investment Business, profit/loss from the change in fair value and profit/loss on sales of investment securities was JPY 91.0bn versus JPY 100.9bn a year earlier, and the segment recorded 17 IPO and M&A deals among investee companies in FY2025. In the Crypto-asset Business, the number of accounts held by SBI VC Trade (combined total of VCTRADE and BITPOINT services) reached 1,931 thousand as of March 2026. In the Next Gen Business, valuation gains were generated on a crypto asset acquired and held as validator rewards in the Web3-related business, and Mynavi, which became an equity method affiliate in Nov. 2024, contributed JPY 5.2bn to the segment’s financial results as equity in earnings of affiliates.
FY2026 Forecast
A consolidated full-year earnings forecast for FY2026 is not presented in this results presentation; this cannot be confirmed from the materials. The only forward figure disclosed by segment is in the PE Investment Business, where the number of IPO and M&A deals of investee companies is shown as 17 for FY2025 results and 29 for FY2026 prospects. The Group also states a 15% ROE target for FY2028, its 30th anniversary.
Shareholder Returns
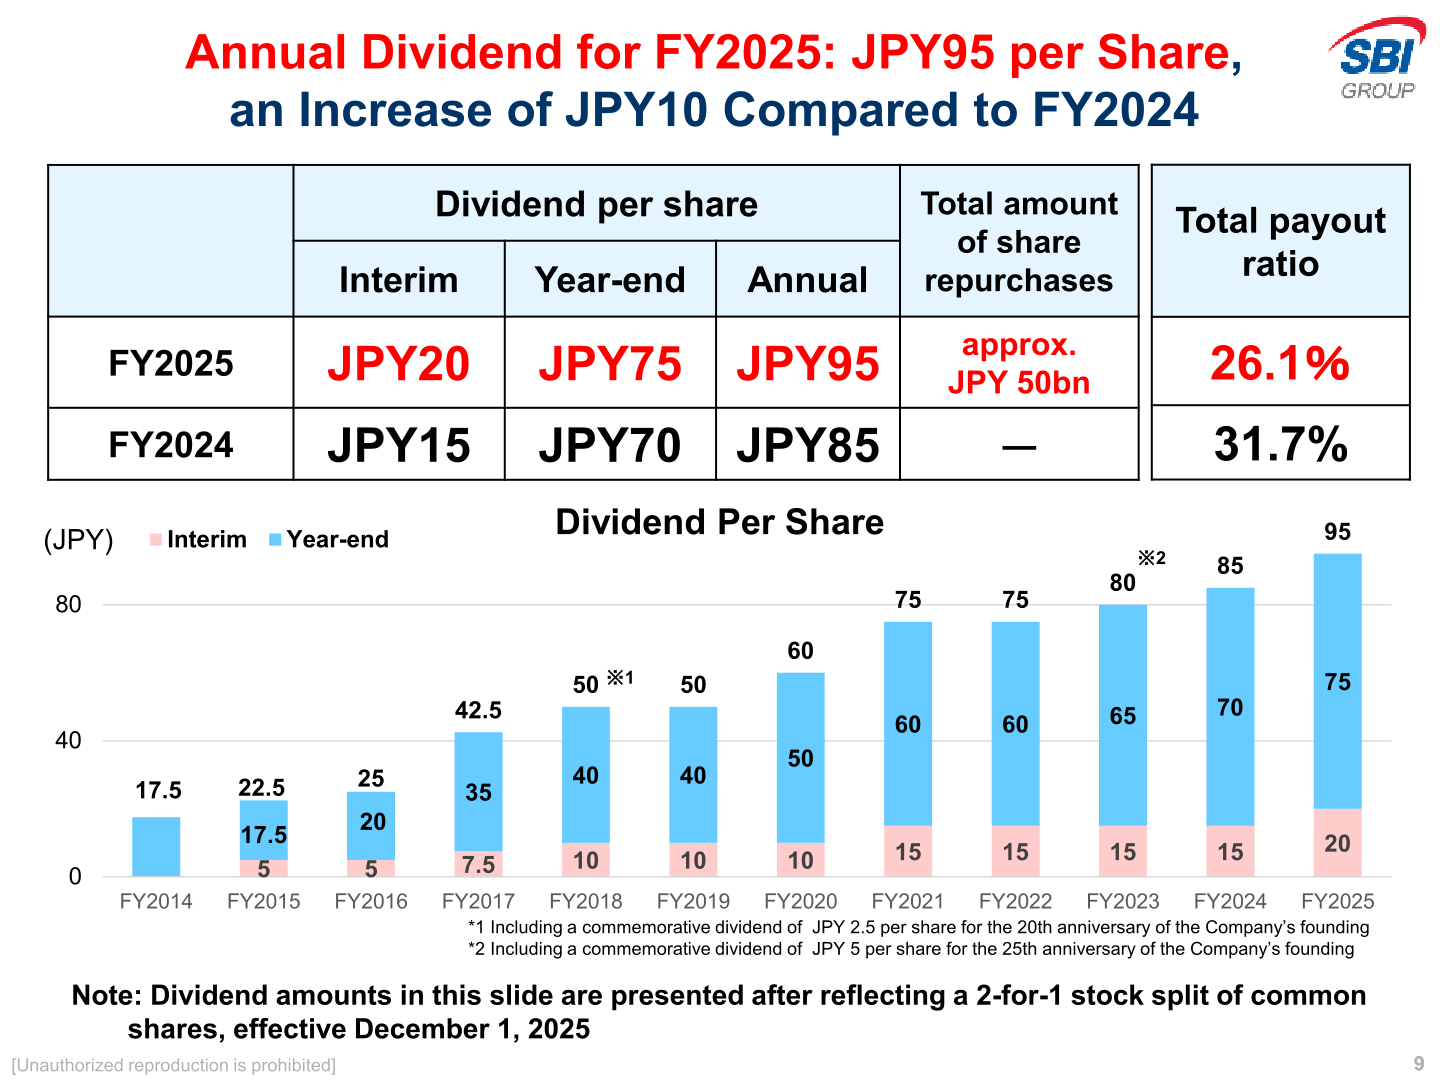
The annual dividend for FY2025 is JPY95 per share, comprising an interim dividend of JPY20 and a year-end dividend of JPY75, up JPY10 from JPY85 in FY2024, with a total payout ratio of 26.1% versus 31.7% in FY2024. The Company also repurchased approximately JPY 50bn of its own shares: 14,690,200 shares for a total cost of JPY49,999,903,700 between December 2, 2025 and February 17, 2026 (based on the trade date). The Company’s basic policy is to determine a total shareholder return ratio, being the sum of dividend payouts and share buybacks, of approx. 30% of the profit before income tax expense attributable to the Financial Services Business excluding extraordinary factors such as gain on sales of subsidiaries’ stocks, for the time being. The amount of total shareholder return on FY2025 results was JPY 111.7bn, equal to 26.3% of the Financial Services Business profit before income tax expense of JPY 425.0bn. For FY2025, share repurchase was implemented reflecting the gain of JPY 141.6bn from the sale of SBI Sumishin Net Bank recorded in 3Q FY2025, with a portion of it returned to shareholders through share repurchase.
| Shareholder returns | FY2025 | FY2024 |
|---|---|---|
| Interim dividend per share | JPY20 | JPY15 |
| Year-end dividend per share | JPY75 | JPY70 |
| Annual dividend per share | JPY95 | JPY85 |
| Total amount of share repurchases | approx. JPY 50bn | ― |
| Total payout ratio | 26.1% | 31.7% |
Three Key Strategic Objectives
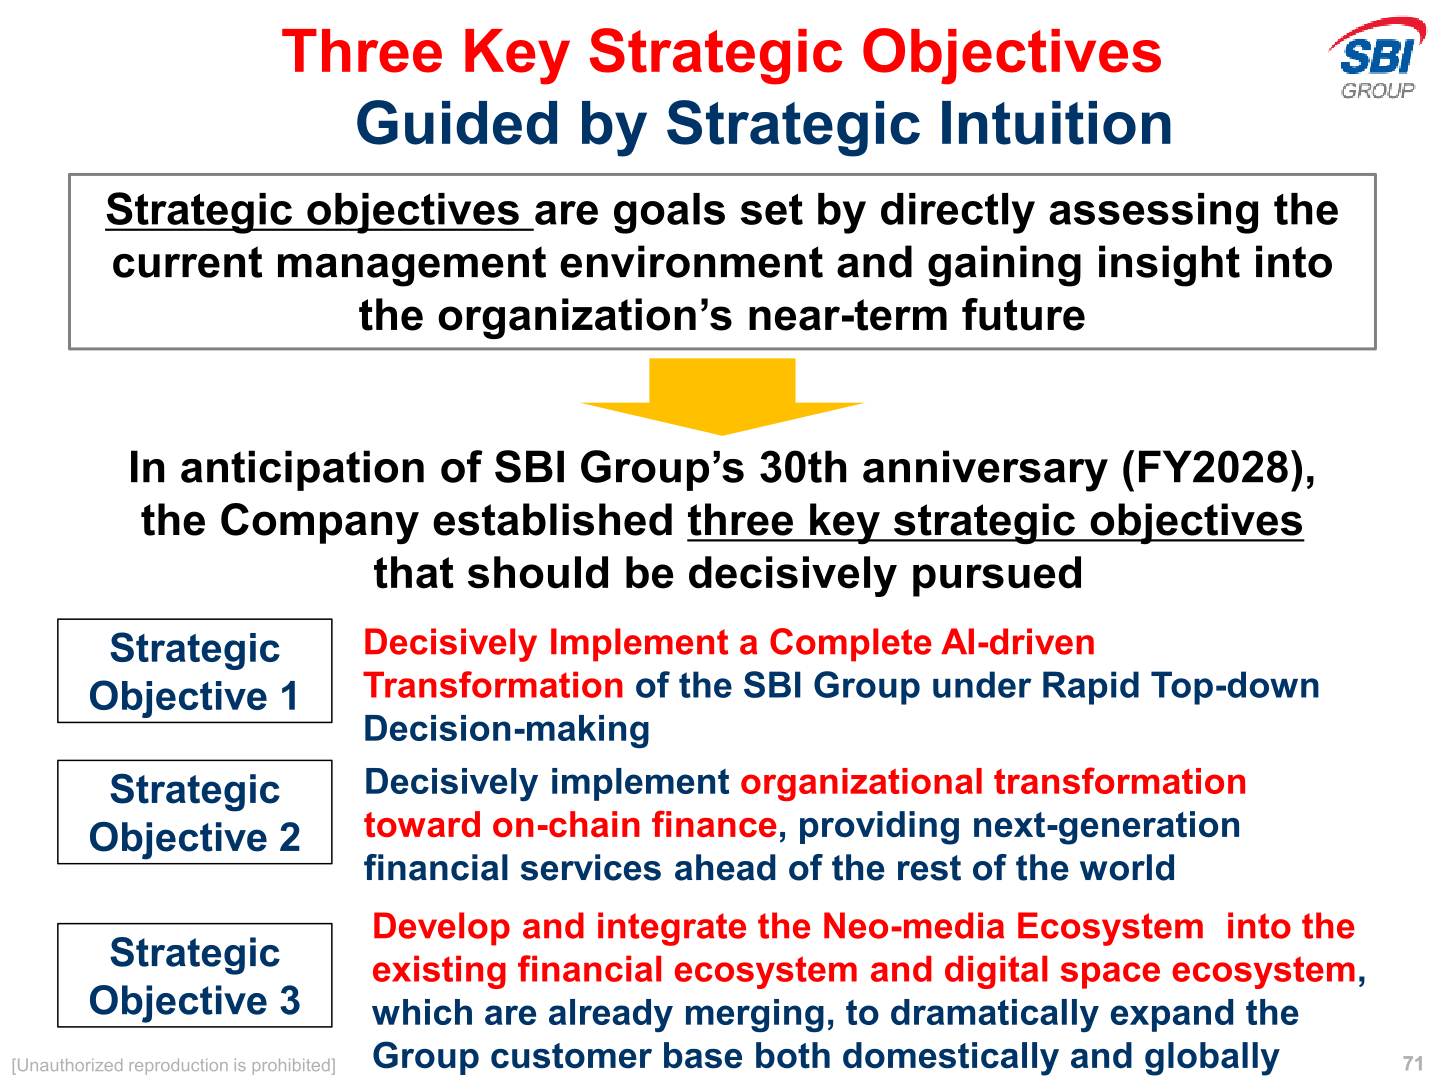
In anticipation of SBI Group’s 30th anniversary (FY2028), the Company established three key strategic objectives that should be decisively pursued. Strategic Objective 1 is to decisively implement a complete AI-driven transformation of the SBI Group under rapid top-down decision-making. Strategic Objective 2 is to decisively implement organizational transformation toward on-chain finance, providing next-generation financial services ahead of the rest of the world. Strategic Objective 3 is to develop and integrate the Neo-media Ecosystem into the existing financial ecosystem and digital space ecosystem, which are already merging, to dramatically expand the Group customer base both domestically and globally.
This article is an analysis based on publicly available information and is not a recommendation to buy or sell any specific securities. Investment decisions are your own responsibility.
![[Obayashi] Investors’ Guide 2026 — The Complete 24-Article Breakdown](https://japan-equity.com/wp-content/uploads/2026/07/hub_cover-1024x1024.png)
![[Obayashi] IR & SR Policy — Feeding Dialogue Back into Management](https://japan-equity.com/wp-content/uploads/2026/07/p32_sq-1024x1024.jpg)
![[Obayashi] Real Estate Development — 18.7% Margin, ¥287.7bn Unrealized Gains](https://japan-equity.com/wp-content/uploads/2026/07/p20_sq-1024x1024.jpg)
![[Obayashi] Domestic Civil Engineering — Resilience Spending Supports 9.6% Margin](https://japan-equity.com/wp-content/uploads/2026/07/p11_sq-1024x1024.jpg)
![[Obayashi] Share Price & External Ratings — vs TOPIX, ESG Index Inclusion](https://japan-equity.com/wp-content/uploads/2026/07/p40_sq-1024x1024.jpg)
![[Construction] ¥75.5tn Investment, Shrinking Workforce — Big-5 Market Share](https://japan-equity.com/wp-content/uploads/2026/07/p12_sq-1024x1024.jpg)



![[Obayashi] Capital Policy & Shareholder Returns — ROE 10%+, DOE ~5%, ¥100bn Buyback](https://japan-equity.com/wp-content/uploads/2026/07/p27_sq-1024x1024.jpg)
![[Obayashi] Reducing Cross-Shareholdings — ¥285.2bn Sold in Five Years](https://japan-equity.com/wp-content/uploads/2026/07/p29_sq-1024x1024.jpg)
![[Obayashi] ¥750bn Investment Plan — ¥300bn to Development, ¥190bn to Tech/DX](https://japan-equity.com/wp-content/uploads/2026/07/p30_sq-1024x1024.jpg)
![[Obayashi] MTP2022 KPIs — Operating Profit ~2x Target, ROE 14.4%](https://japan-equity.com/wp-content/uploads/2026/07/p25_sq-1024x1024.jpg)
![[Obayashi] Cash Allocation — ¥420bn Investment CF Over Five Years](https://japan-equity.com/wp-content/uploads/2026/07/p26_sq-1024x1024.jpg)
![[Obayashi] Green Energy — 44 Plants, 344MW, and the Green Hydrogen Challenge](https://japan-equity.com/wp-content/uploads/2026/07/p21_sq-1024x1024.jpg)
![[Obayashi] Tackling the Labor Shortage — Robotics Construction®](https://japan-equity.com/wp-content/uploads/2026/07/p14_sq-1024x1024.jpg)
