
This article is based on publicly available IR materials and is not a recommendation to buy or sell any specific securities.
Note: Tokyo Electron labels the fiscal year ended March 31, 2026 as ‘FY2026’ in its own materials; the tables and figures below follow the company’s labels.
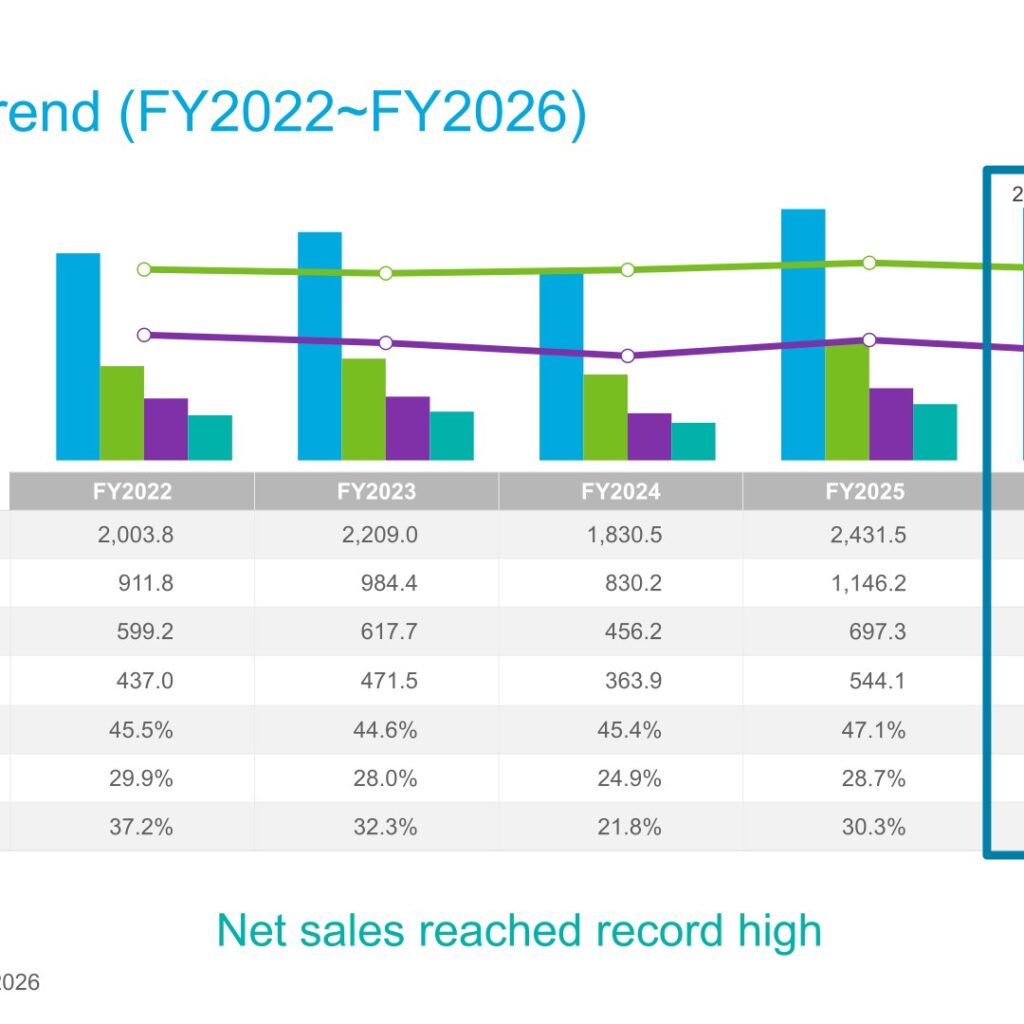
Tokyo Electron reported record-high net sales of 2,443.5 billion yen and record-high net income attributable to owners of parent of 574.4 billion yen for FY2026 (the fiscal year ended March 2026), up 0.5% and 5.6% year-on-year respectively. Operating income declined 10.4% YoY to 624.9 billion yen as gross profit margin and the SG&A ratio moved against the company, reflecting product mix and increased R&D investment. For FY2027, the company forecasts H1 net sales of 1,570.0 billion yen and H1 net income of 328.0 billion yen, citing AI server-driven demand for DRAM and leading-edge logic investment, while monitoring geopolitical risks including a potential blockade in the Strait of Hormuz.
Consolidated Results (Full-Year Actual)
FY2026 results exceeded the company’s own reference estimates announced on February 6, 2026 across major line items: net sales of 2,443.5 billion yen versus a reference estimate of 2,410.0 billion yen, operating income of 624.9 billion yen versus 593.0 billion yen, and net income of 574.4 billion yen versus 550.0 billion yen. Gross profit margin fell 1.8 points YoY to 45.3%, and SG&A expenses rose 7.6% YoY to 482.9 billion yen, including an 11.1% increase in R&D expenses to 277.8 billion yen. Q4 FY2026 net sales were 711.8 billion yen (+28.9% vs. FY2026 Q3, +8.6% vs. FY2025 Q4), with net income of 214.2 billion yen (+80.8% vs. FY2026 Q3, +49.9% vs. FY2025 Q4).
| Item | FY2025 (Actual) | FY2026 (Actual) | YoY Change |
|---|---|---|---|
| Net sales (billion yen) | 2,431.5 | 2,443.5 | +0.5% |
| Gross profit (billion yen) | 1,146.2 | 1,107.8 | -3.4% |
| Gross profit margin | 47.1% | 45.3% | -1.8pts |
| SG&A expenses (billion yen) | 448.9 | 482.9 | +7.6% |
| Operating income (billion yen) | 697.3 | 624.9 | -10.4% |
| Operating margin | 28.7% | 25.6% | -3.1pts |
| Income before income taxes (billion yen) | 706.1 | 748.1 | +6.0% |
| Net income attributable to owners of parent (billion yen) | 544.1 | 574.4 | +5.6% |
| EPS (Yen) | 1,182.40 | 1,254.57 | +6.1% |
| R&D expenses (billion yen) | 250.0 | 277.8 | +11.1% |
| Capital expenditures (billion yen) | 162.1 | 216.0 | +33.2% |
| Depreciation and amortization (billion yen) | 62.1 | 80.9 | +30.3% |
Business Results by Application (SPE and Field Solutions)
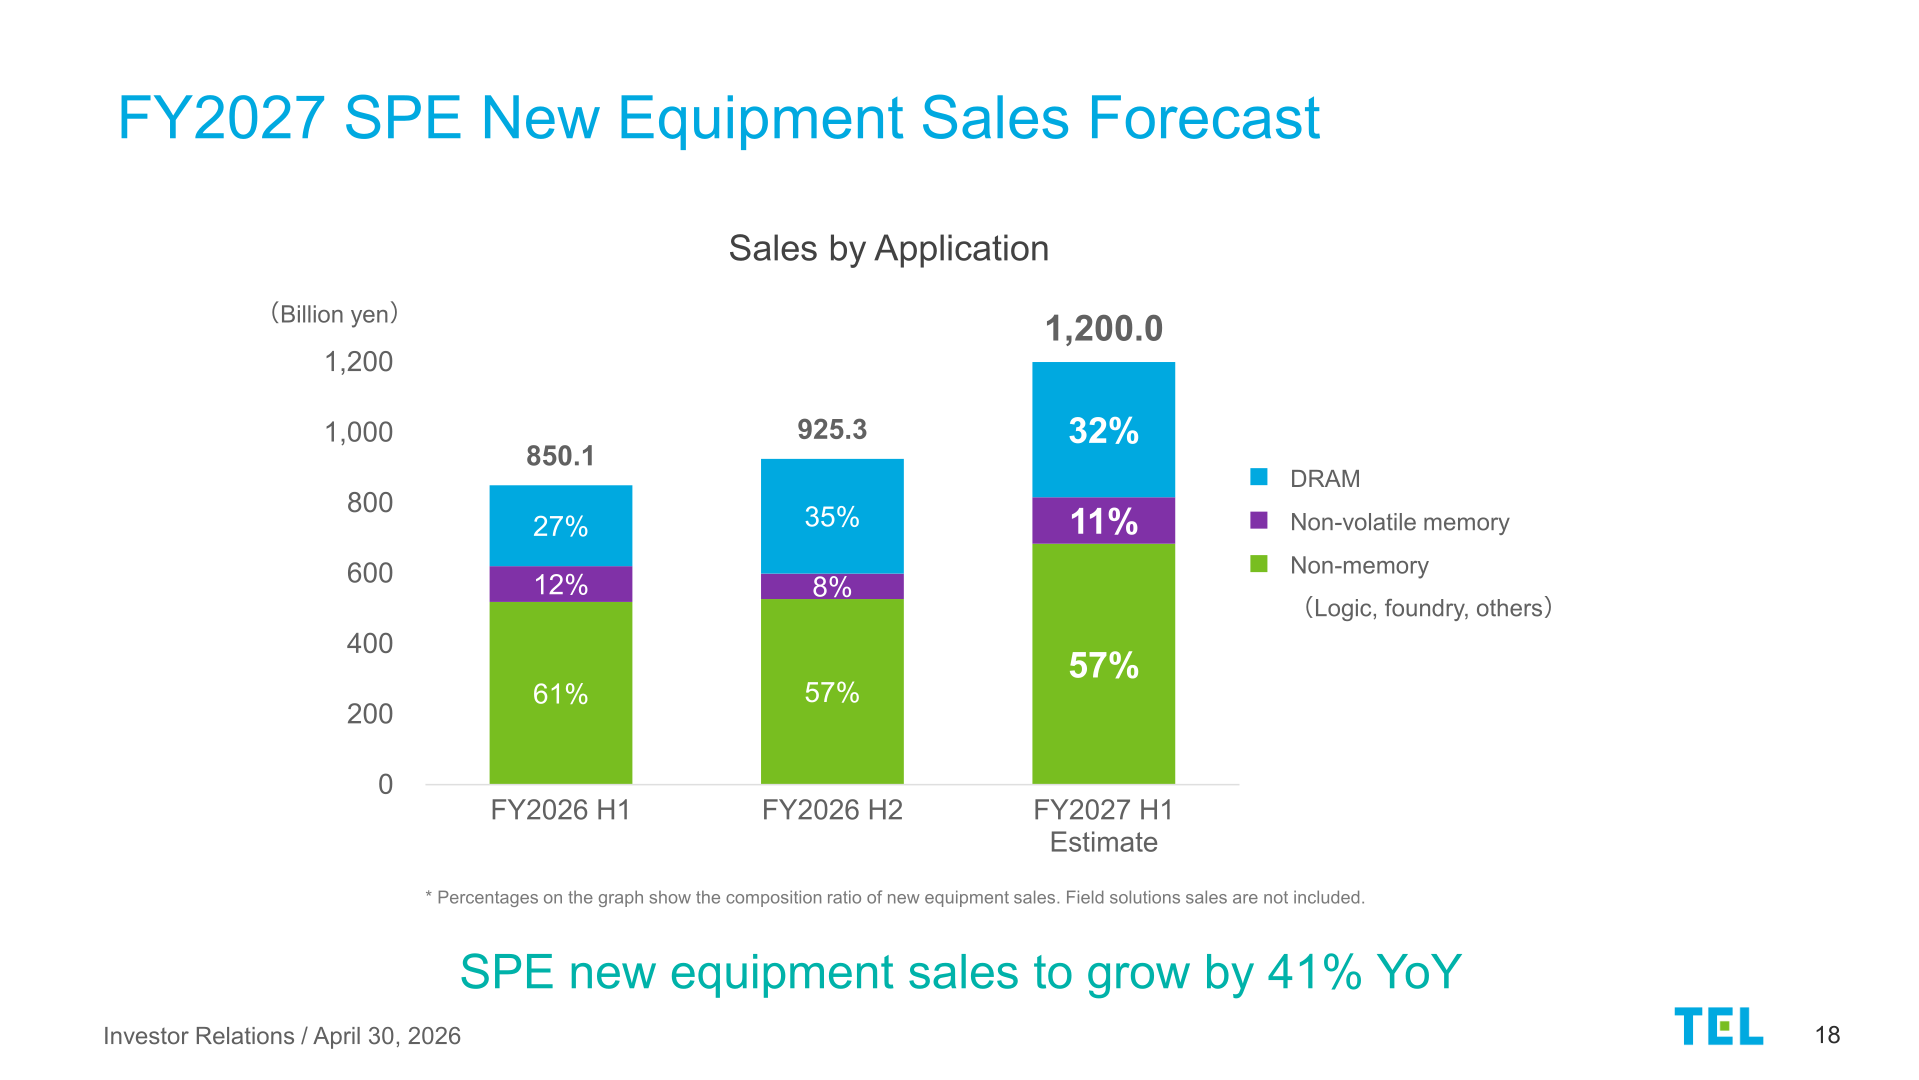
Tokyo Electron does not disclose separate business segments; results are presented by application for new Semiconductor Production Equipment (SPE) sales and for Field Solutions. Total SPE new equipment sales were 1,775.4 billion yen in FY2026. DRAM accounted for 59% of the mix (down from 62% in FY2025) amid continued strong investment in HBM and leading-edge technologies; non-volatile memory rose to 10% (from 7%) as customers’ fab utilization improved and investment showed a gradual recovery; non-memory (logic, foundry, others) held steady at 31% on robust leading-edge equipment investment. Field Solutions sales for FY2026 were 626.0 billion yen, up 16.3% YoY, as customers’ fab utilization climbed further and parts & services and modifications delivered solid growth.
| Item | FY2025 | FY2026 |
|---|---|---|
| Total SPE new equipment sales (billion yen) | 1,861.1 | 1,775.4 |
| DRAM (share of new equipment sales) | 62% | 59% |
| Non-volatile memory (share of new equipment sales) | 7% | 10% |
| Non-memory – Logic, foundry, others (share of new equipment sales) | 31% | 31% |
| Field Solutions sales (billion yen) | 538.3 | 626.0 |
| — Parts and services (billion yen) | 389.1 | 435.9 |
| — Used equipment and modification (billion yen) | 149.1 | 190.0 |
FY2027 Forecast
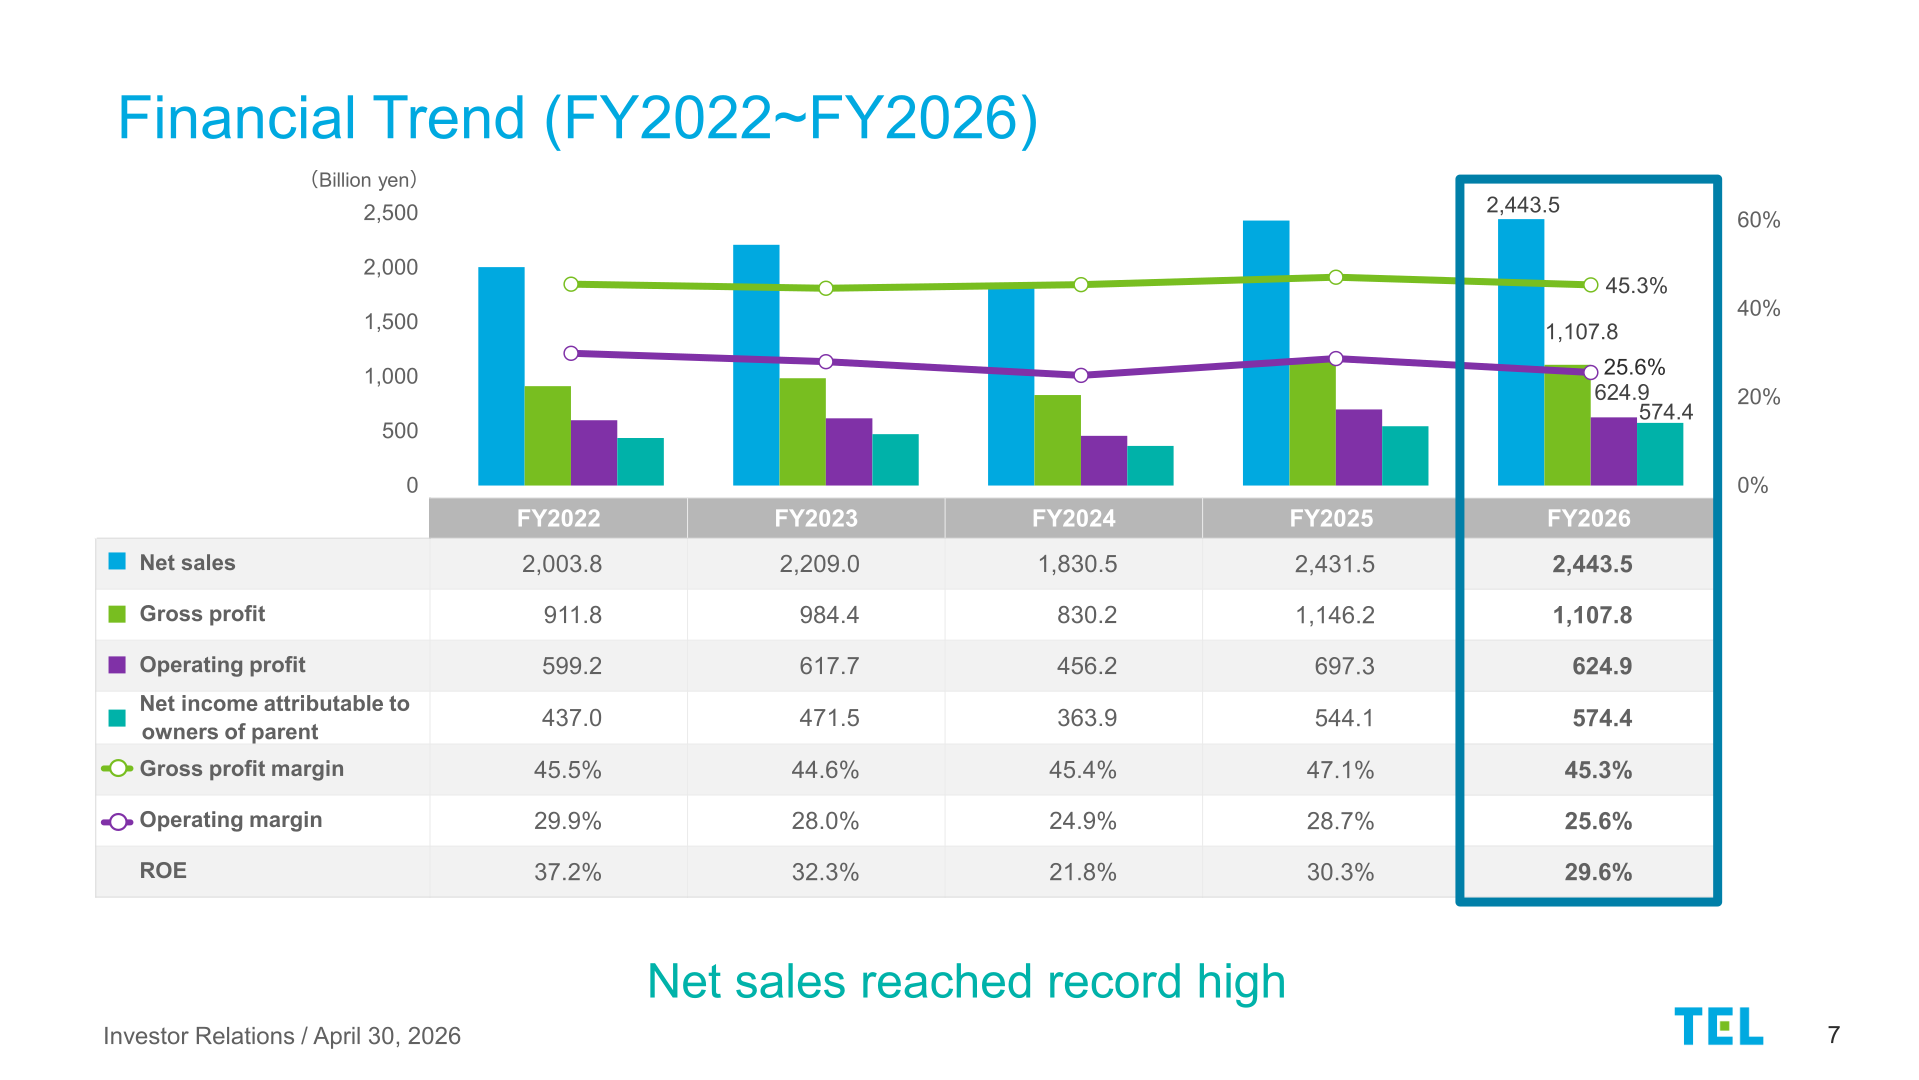
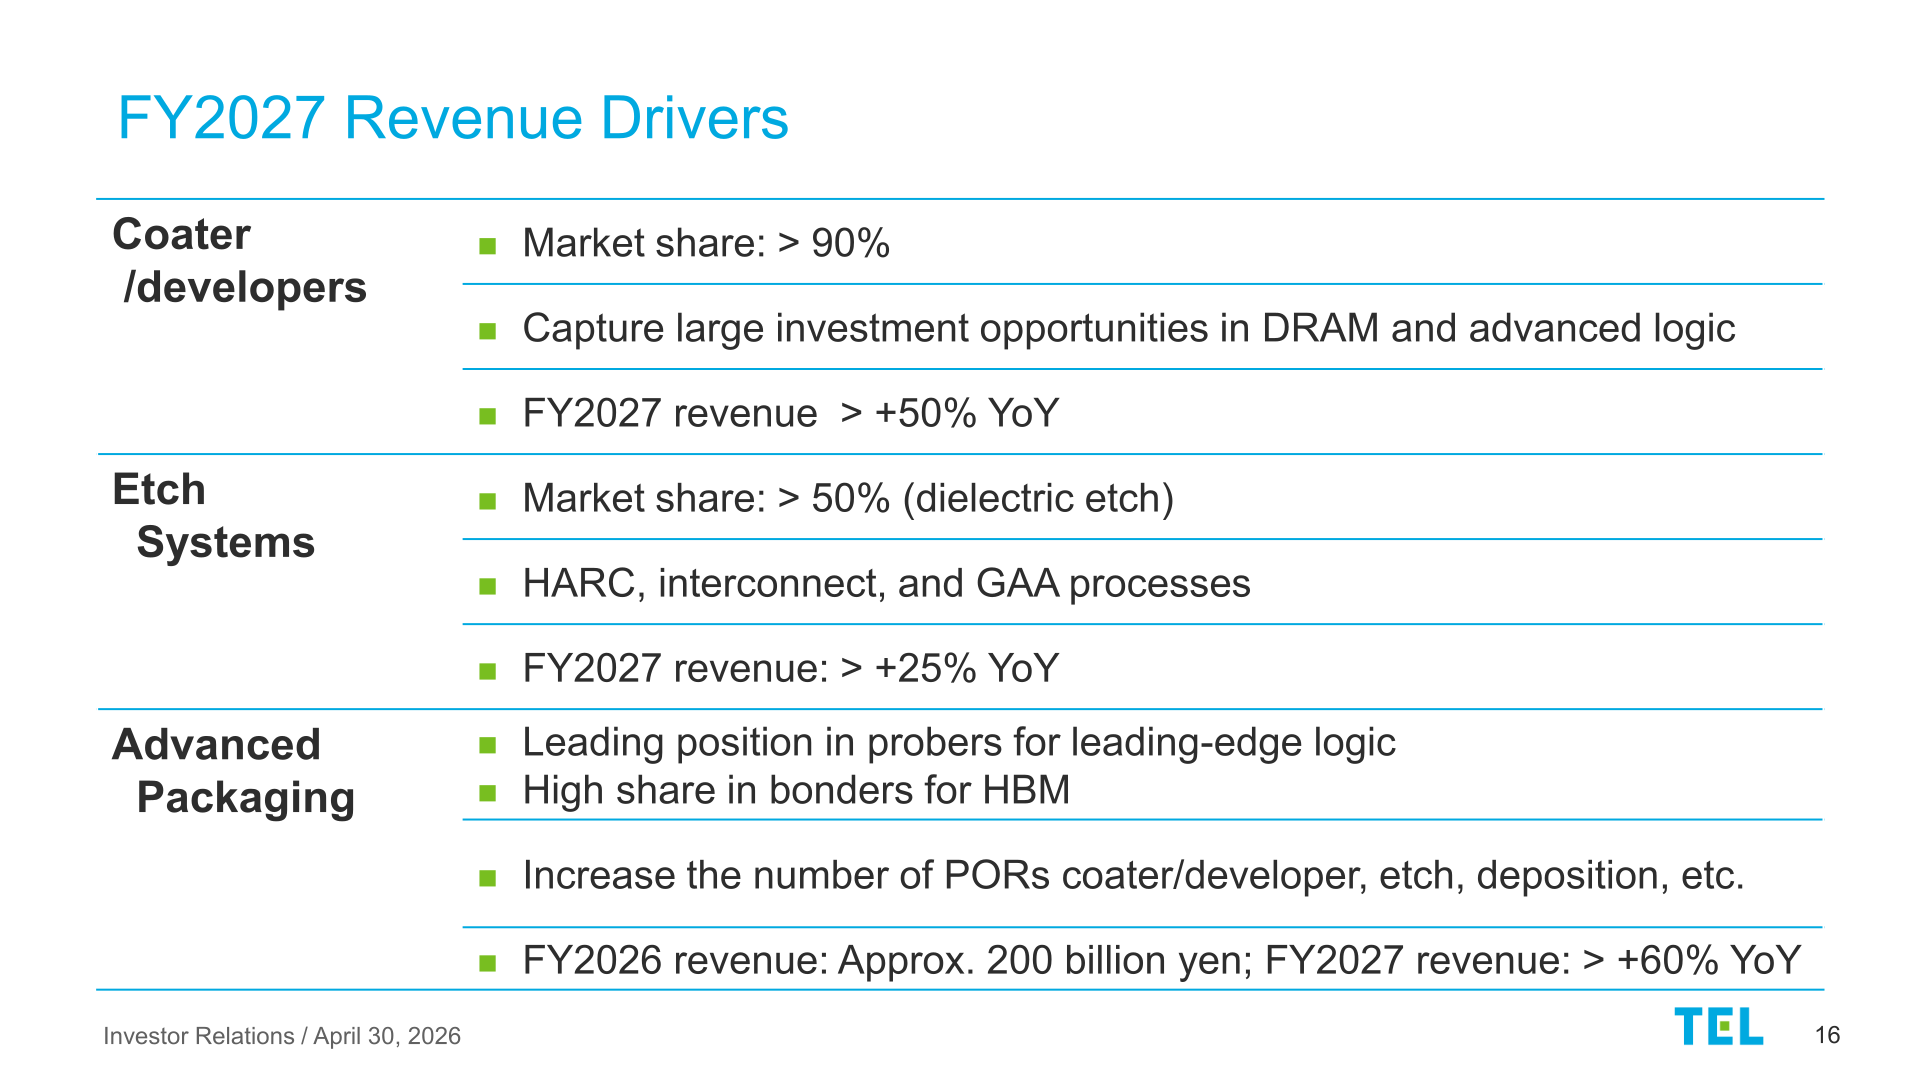
Tokyo Electron forecasts H1 FY2027 net sales of 1,570.0 billion yen, gross profit of 715.0 billion yen (45.5% margin), operating income of 431.0 billion yen (27.5% margin), and net income of 328.0 billion yen. The company describes this as a forecast record high for H1 net sales, gross profit and operating profit, driven by AI server demand, with incremental shipments for DRAM and leading-edge logic expected in the latter part of CY2026. The company states it is monitoring the impact of a potential blockade in the Strait of Hormuz. Tokyo Electron’s WFE market outlook for CY2026-27 (as of April 2026) projects a range of $150 billion-$170 billion per year, representing 20%+ growth versus CY2025, with leading-edge applications forecast to grow 30%+; the company also flags geopolitical risks requiring close monitoring. By product category, coater/developers (market share above 90%) are expected to see FY2027 revenue growth of more than +50% YoY; etch systems (market share above 50% in dielectric etch) more than +25% YoY; and Advanced Packaging FY2027 revenue growth of more than +60% YoY from an FY2026 base of approximately 200 billion yen.
| Item | FY2026 (Full Year Actual) | FY2027 H1 (Estimate) |
|---|---|---|
| Net sales (billion yen) | 2,443.5 | 1,570.0 |
| Gross profit (billion yen) | 1,107.8 | 715.0 |
| Gross profit margin | 45.3% | 45.5% |
| SG&A expenses (billion yen) | 482.9 | 284.0 |
| — R&D (billion yen) | 277.8 | 160.0 |
| — Other than R&D (billion yen) | 205.0 | 124.0 |
| Operating income (billion yen) | 624.9 | 431.0 |
| Operating margin | 25.6% | 27.5% |
| Income before income taxes (billion yen) | 748.1 | 437.0 |
| Net income attributable to owners of parent (billion yen) | 574.4 | 328.0 |
| Net income per share (Yen) | 1,254.57 | 721.12 |
Shareholder Returns
Tokyo Electron’s H1 FY2027 (interim) dividend per share is expected to be 361 yen, based on a dividend payout ratio of 50% and a policy of annual DPS of not less than 50 yen. The company states it will flexibly consider share buybacks and will review its dividend policy if it does not generate net income for two consecutive fiscal years. Combined with share buybacks, the company’s total return amount is expected to be a record high; the FY2026 year-end dividend is provisional and pending approval by the Board of Directors.
| Period | Dividend per Share (Yen) |
|---|---|
| H1 FY2024 | 148 |
| H2 FY2024 | 245 |
| H1 FY2025 | 265 |
| H2 FY2025 | 327 |
| H1 FY2026 | 264 |
| H2 FY2026 | 364 |
| H1 FY2027 (Estimate) | 361 |
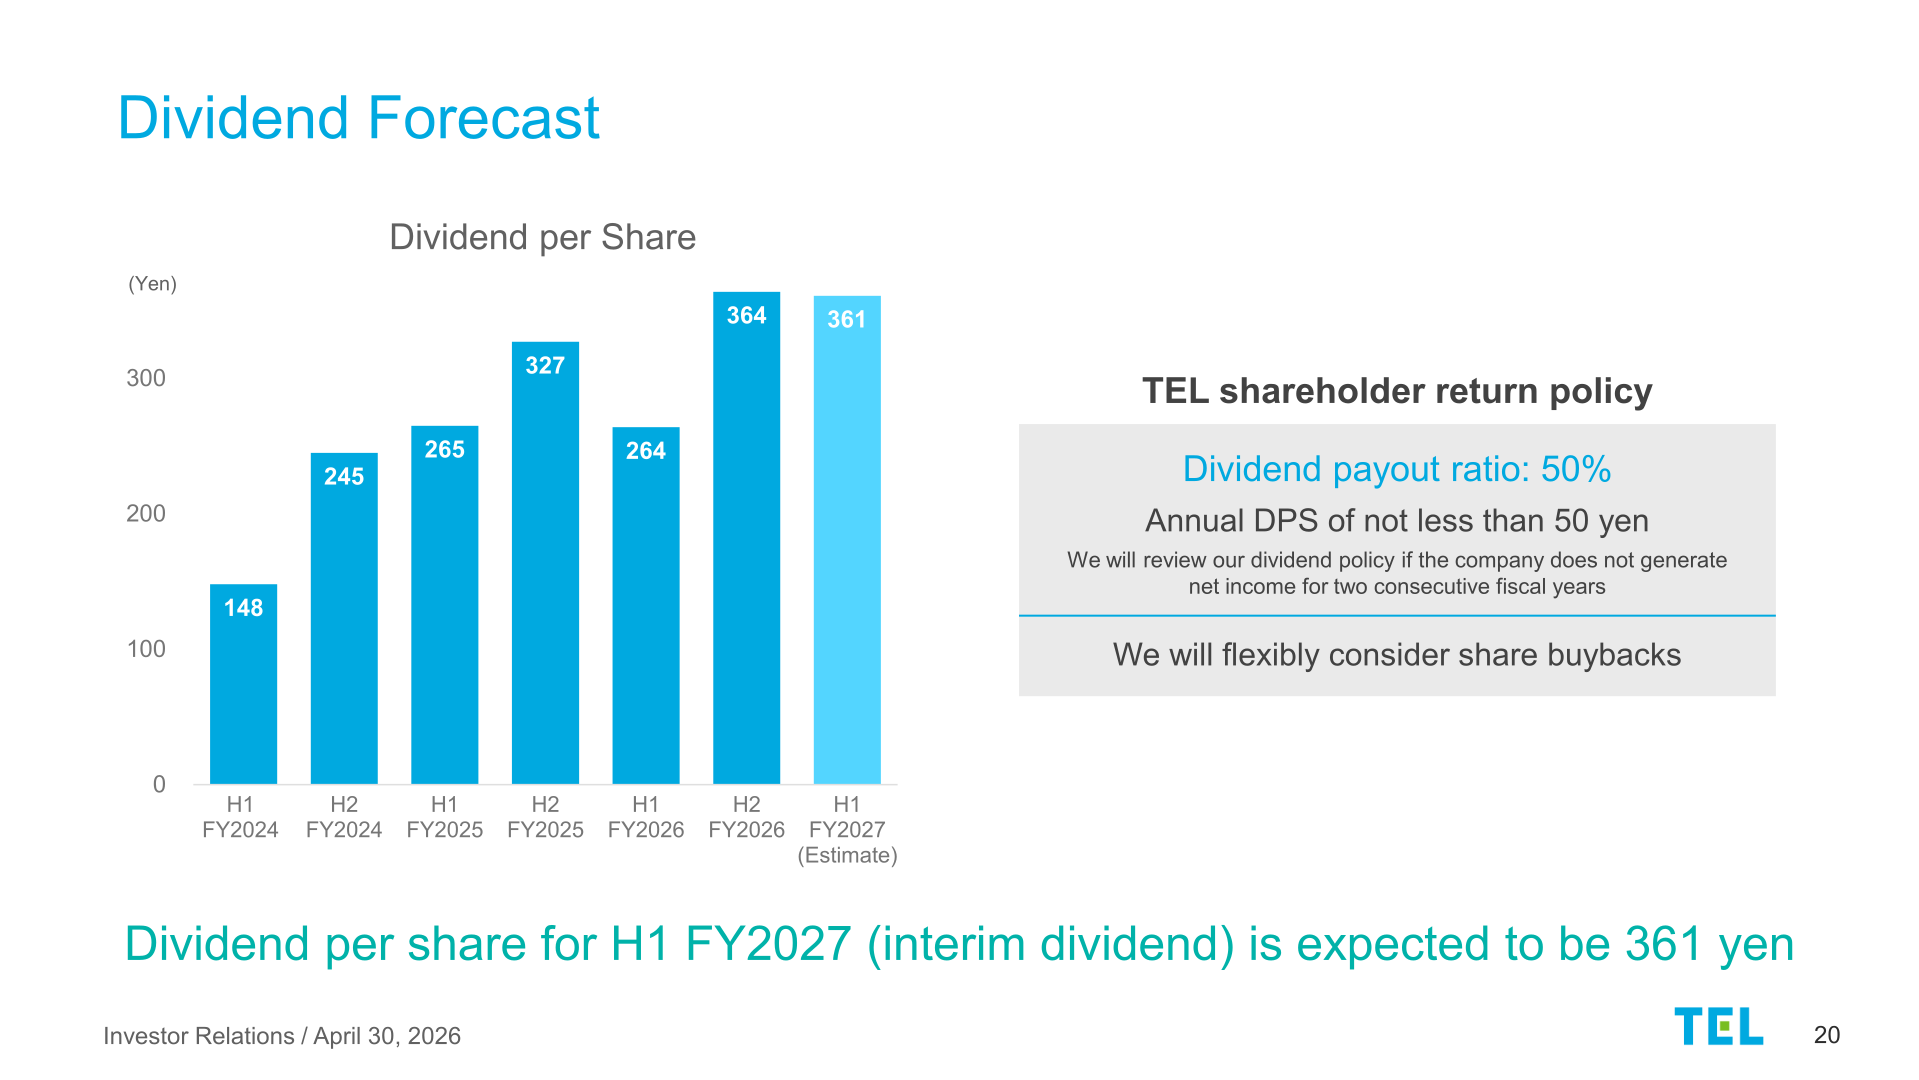
Business Highlights and Growth Position
FY2026 business highlights cited by the company include record-high net sales and net income; completion of new infrastructure including R&D centers in Miyagi and Kumamoto and a production & logistics center in Iwate, with a new production building under construction at Miyagi implementing TEL’s Smart Production concept; and PORs (process-of-record wins) in growth sectors, including a leading position in major memory processes such as DRAM capacitors and HBM interconnects, and PORs in multiple Advanced Packaging products.
This article is an analysis based on publicly available information and is not a recommendation to buy or sell any specific securities. Investment decisions are your own responsibility.
![[Obayashi] Investors’ Guide 2026 — The Complete 24-Article Breakdown](https://japan-equity.com/wp-content/uploads/2026/07/hub_cover-1024x1024.png)
![[Obayashi] IR & SR Policy — Feeding Dialogue Back into Management](https://japan-equity.com/wp-content/uploads/2026/07/p32_sq-1024x1024.jpg)
![[Obayashi] Real Estate Development — 18.7% Margin, ¥287.7bn Unrealized Gains](https://japan-equity.com/wp-content/uploads/2026/07/p20_sq-1024x1024.jpg)
![[Obayashi] Domestic Civil Engineering — Resilience Spending Supports 9.6% Margin](https://japan-equity.com/wp-content/uploads/2026/07/p11_sq-1024x1024.jpg)
![[Obayashi] Share Price & External Ratings — vs TOPIX, ESG Index Inclusion](https://japan-equity.com/wp-content/uploads/2026/07/p40_sq-1024x1024.jpg)
![[Construction] ¥75.5tn Investment, Shrinking Workforce — Big-5 Market Share](https://japan-equity.com/wp-content/uploads/2026/07/p12_sq-1024x1024.jpg)



![[Obayashi] Capital Policy & Shareholder Returns — ROE 10%+, DOE ~5%, ¥100bn Buyback](https://japan-equity.com/wp-content/uploads/2026/07/p27_sq-1024x1024.jpg)
![[Obayashi] Reducing Cross-Shareholdings — ¥285.2bn Sold in Five Years](https://japan-equity.com/wp-content/uploads/2026/07/p29_sq-1024x1024.jpg)
![[Obayashi] ¥750bn Investment Plan — ¥300bn to Development, ¥190bn to Tech/DX](https://japan-equity.com/wp-content/uploads/2026/07/p30_sq-1024x1024.jpg)
![[Obayashi] MTP2022 KPIs — Operating Profit ~2x Target, ROE 14.4%](https://japan-equity.com/wp-content/uploads/2026/07/p25_sq-1024x1024.jpg)
![[Obayashi] Cash Allocation — ¥420bn Investment CF Over Five Years](https://japan-equity.com/wp-content/uploads/2026/07/p26_sq-1024x1024.jpg)
![[Obayashi] Green Energy — 44 Plants, 344MW, and the Green Hydrogen Challenge](https://japan-equity.com/wp-content/uploads/2026/07/p21_sq-1024x1024.jpg)
![[Obayashi] Tackling the Labor Shortage — Robotics Construction®](https://japan-equity.com/wp-content/uploads/2026/07/p14_sq-1024x1024.jpg)
