
This article is based on publicly available IR materials and is not a recommendation to buy or sell any specific securities.
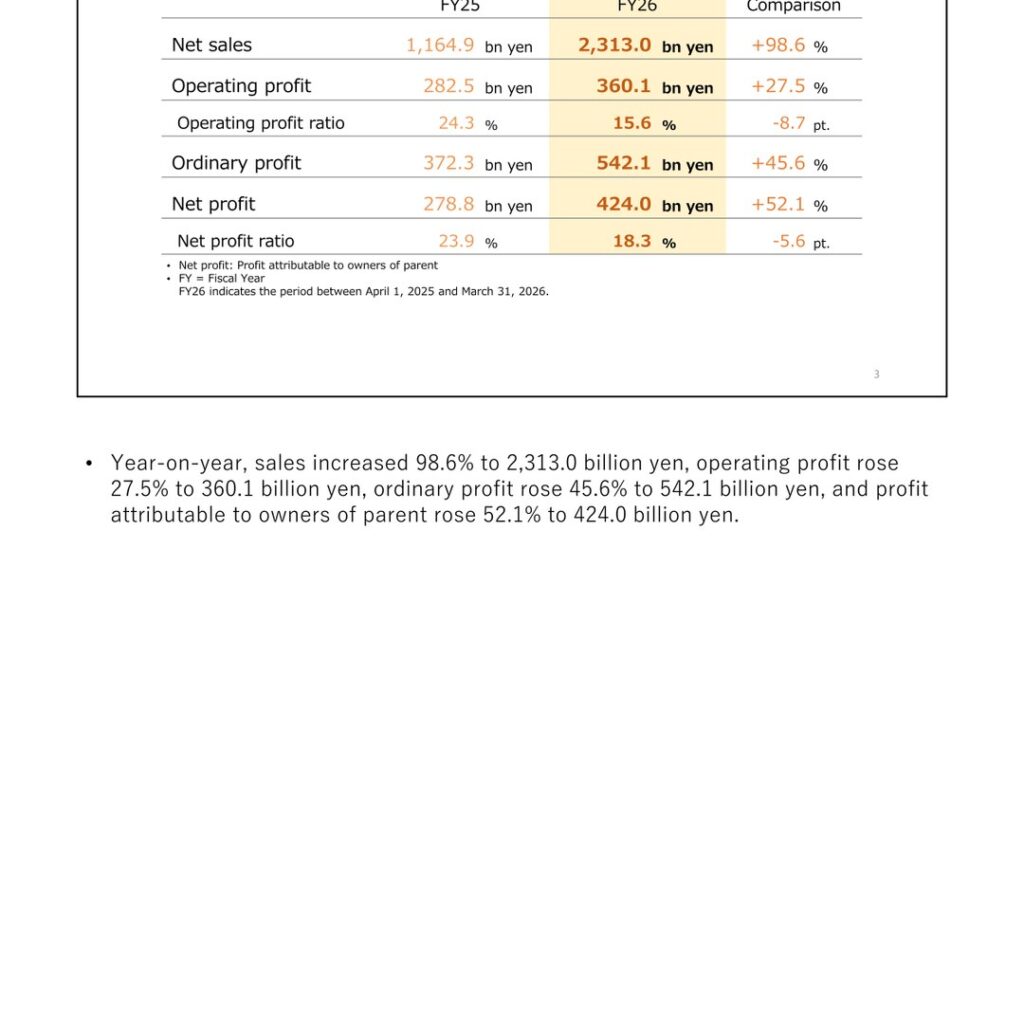
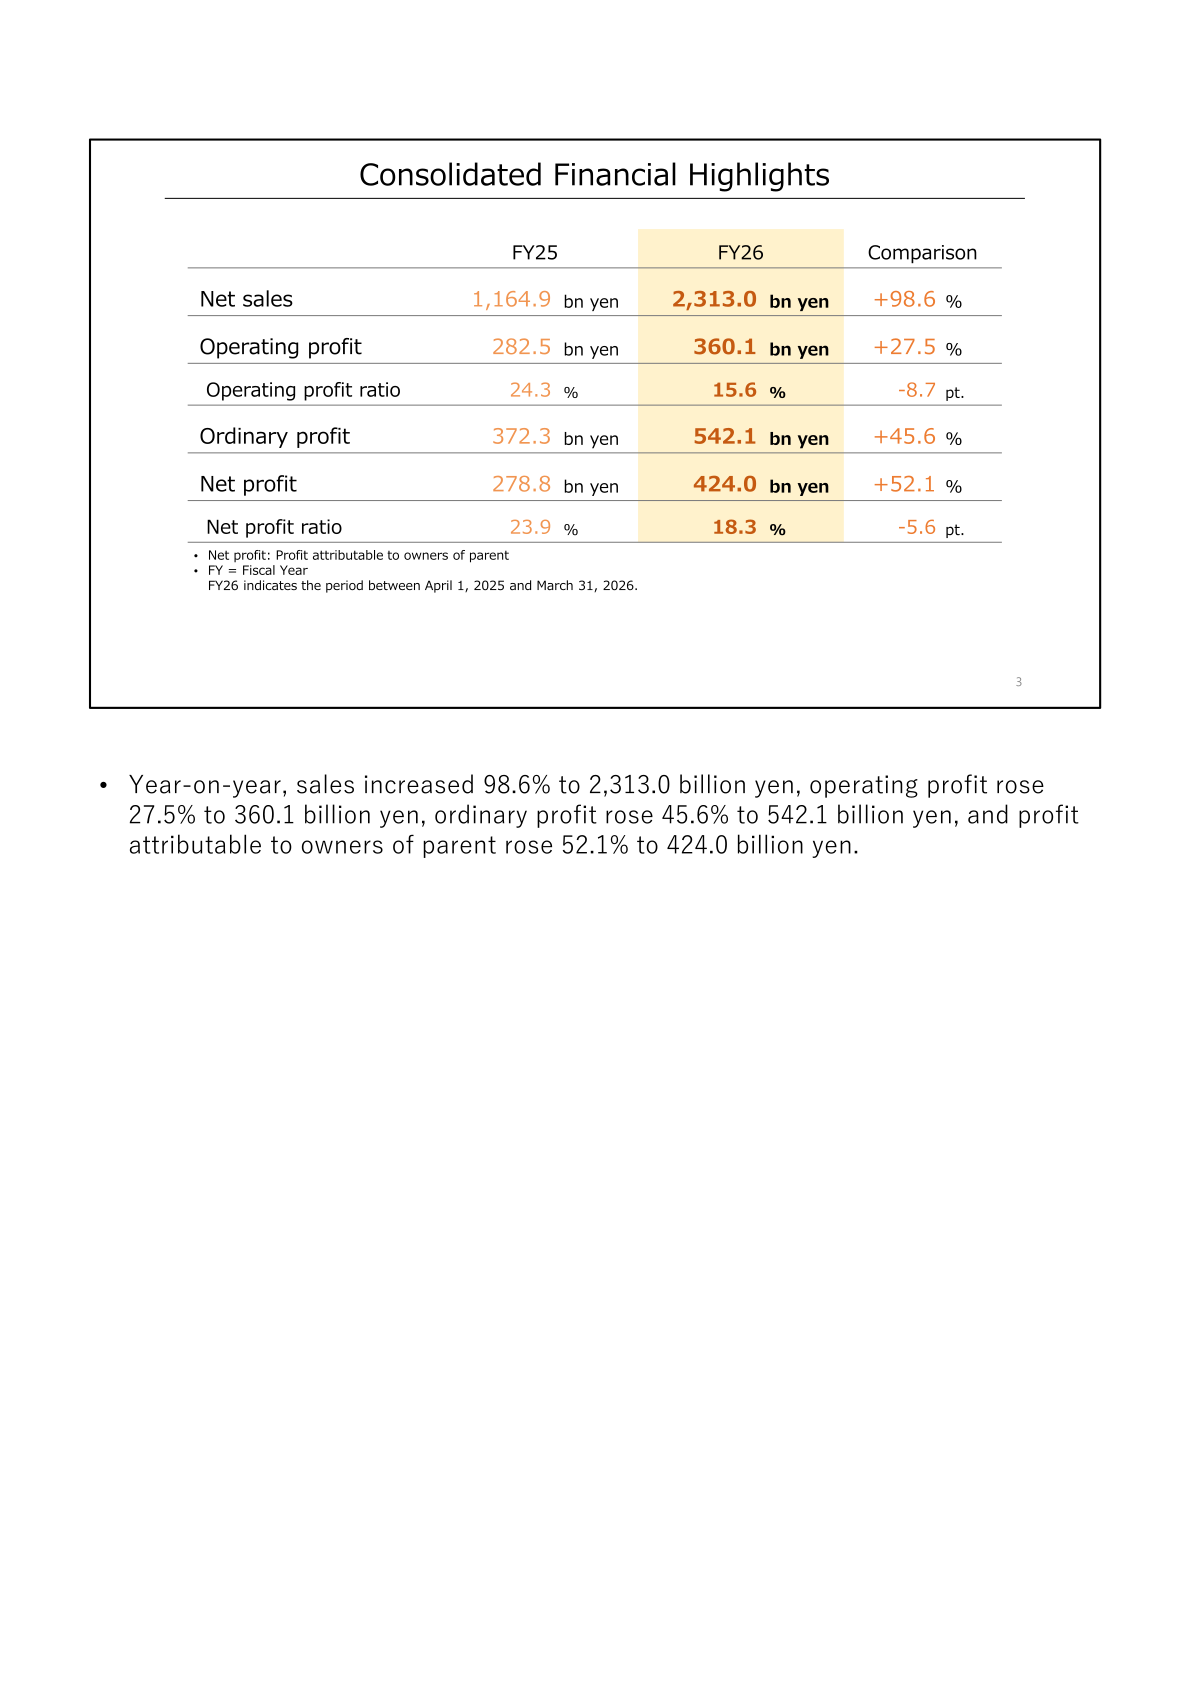
Nintendo Co., Ltd. reported consolidated net sales of 2,313.0 billion yen for the fiscal year ended March 2026 (FY26), up 98.6% year on year, driven by the launch of Nintendo Switch 2 in June 2025. Operating profit rose 27.5% to 360.1 billion yen, ordinary profit rose 45.6% to 542.1 billion yen, and profit attributable to owners of parent rose 52.1% to 424.0 billion yen. For the fiscal year ending March 2027 (FY27), Nintendo forecasts net sales of 2,050.0 billion yen (-11.4%) and profit attributable to owners of parent of 310.0 billion yen (-26.9%), reflecting announced price revisions for Nintendo Switch 2 and an approximately 100.0 billion yen cost impact from rising component prices and tariff measures.
Consolidated Results (Full-Year Actual)
Net sales increased 98.6% year on year to 2,313.0 billion yen, including a positive foreign exchange effect of 19.2 billion yen. Gross profit rose 28.0% to 908.9 billion yen, while the gross profit ratio declined 21.7 points to 39.3%, reflecting a higher proportion of hardware sales (66.7% of dedicated video game platform sales, up 23.0 points) following the Nintendo Switch 2 launch. SG&A expenses increased 28.3% to 548.8 billion yen, including advertising expenses of 144.6 billion yen (+67.1%) and research and development expenses of 177.8 billion yen (+23.7%), but the SG&A-to-sales ratio fell 13.0 points to 23.7% on the strength of sales growth. Operating profit increased 27.5% to 360.1 billion yen (operating profit ratio 15.6%, down 8.7 points), including a positive foreign exchange effect of approximately 33.3 billion yen on operating profit. Ordinary profit rose 45.6% to 542.1 billion yen, aided by increases in share of profit of entities accounted for using the equity method, interest income, and foreign exchange gains. Profit attributable to owners of parent rose 52.1% to 424.0 billion yen, due in part to a gain on sale of investment securities.
| Item | FY2026 (2025.4-2026.3) | FY2025 (2024.4-2025.3) | Change |
|---|---|---|---|
| Net sales | 2,313.0 bn yen | 1,164.9 bn yen | +98.6% |
| Gross profit | 908.9 bn yen | 710.1 bn yen | +28.0% |
| Gross profit ratio | 39.3% | 61.0% | -21.7pt |
| SG&A expenses | 548.8 bn yen | 427.6 bn yen | +28.3% |
| Operating profit | 360.1 bn yen | 282.5 bn yen | +27.5% |
| Operating profit ratio | 15.6% | 24.3% | -8.7pt |
| Ordinary profit | 542.1 bn yen | 372.3 bn yen | +45.6% |
| Net profit (attributable to owners of parent) | 424.0 bn yen | 278.8 bn yen | +52.1% |
| Net profit ratio | 18.3% | 23.9% | -5.6pt |
Sales and Unit Breakdown
By category, sales of the dedicated video game platform business rose 106.7% year on year to 2,239.5 billion yen, driven by the Nintendo Switch 2 launch and its higher hardware unit price, while IP related income (movies and videos, smart-device content, royalties, and merchandise sales at official stores) declined 9.7% to 73.5 billion yen, due in part to lower visual content revenue related to The Super Mario Bros. Movie. By region, the FY26 sales ratio was Japan 23.1%, the Americas 40.4%, Europe 23.8%, and Other 12.7%, with 76.9% of sales generated outside Japan. On a sell-in basis, Nintendo Switch 2 hardware sales totaled 19.86 million units in its first fiscal year, while Nintendo Switch hardware sales declined 64.8% year on year to 3.80 million units. Nintendo Switch 2 software sales totaled 48.71 million units, led by Mario Kart World (14.70 million units), Donkey Kong Bananza (4.52 million units), and Pokémon Legends: Z-A – Nintendo Switch 2 Edition (3.94 million units), while Nintendo Switch software sales declined 11.9% to 136.91 million units, led by Pokémon Legends: Z-A (8.85 million units), Super Mario Galaxy 2 (2.76 million units), and Super Mario Galaxy (2.60 million units). Digital sales rose 25.0% year on year to 407.6 billion yen, accounting for 54.6% of total dedicated video game platform software sales, up 1.1 points.
| Item | FY26 | FY25 | Change |
|---|---|---|---|
| Dedicated video game platform sales | 2,239.5 bn yen | 1,083.5 bn yen | +106.7% |
| IP related income, etc. | 73.5 bn yen | 81.3 bn yen | -9.7% |
| Nintendo Switch 2 – Hardware (sell-in, mil units) | 19.86 | – | – |
| Nintendo Switch – Hardware (sell-in, mil units) | 3.80 | 10.80 | -64.8% |
| Nintendo Switch 2 – Software (sell-in, mil units) | 48.71 | – | – |
| Nintendo Switch – Software (sell-in, mil units) | 136.91 | 155.41 | -11.9% |
| Digital sales | 407.6 bn yen | 326.0 bn yen | +25.0% |
| Proportion of digital sales | 54.6% | 53.5% | +1.1pt |
Business Highlights
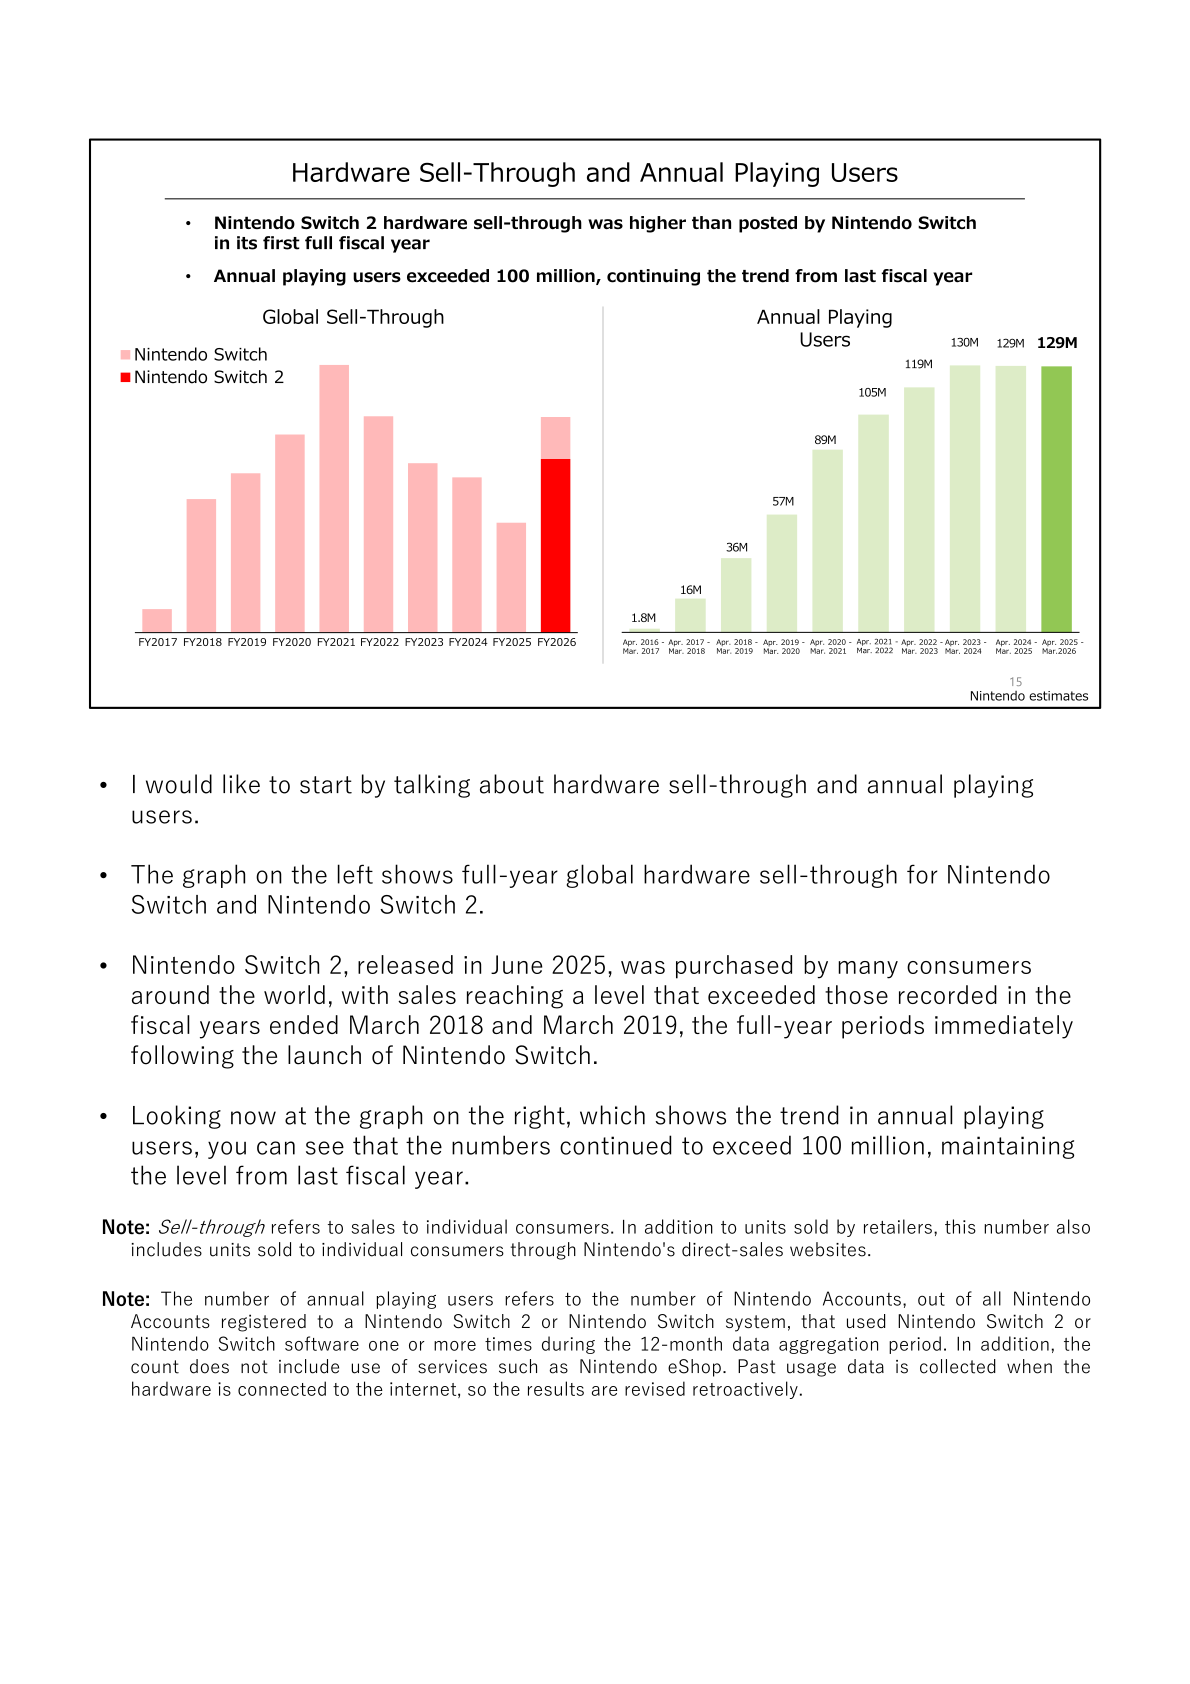
Full-year global hardware sell-through (sales to individual consumers) for Nintendo Switch 2 in its first fiscal year exceeded the levels Nintendo Switch recorded in the fiscal years ended March 2018 and March 2019, the first two full years following the Switch launch. Annual playing users exceeded 100 million, continuing the trend from the previous fiscal year. Among first-party software, Pokémon FireRed and Pokémon LeafGreen (released February 27, 2026 for Nintendo Switch) together recorded global cumulative sell-through of over 4 million units in their first six weeks, while Pokémon Pokopia (released March 5, 2026 for Nintendo Switch 2) recorded over 4 million units in its first five weeks. Tomodachi Life: Living the Dream, released April 16, 2026 for Nintendo Switch, sold over 3.8 million units globally in its first two weeks, with approximately 40% of players owning Nintendo Switch 2. In the movie business, The Super Mario Galaxy Movie began its global release on April 1, 2026, and recorded worldwide box-office gross revenue of over 800 million U.S. dollars in its first four weeks.
FY2027 Forecast
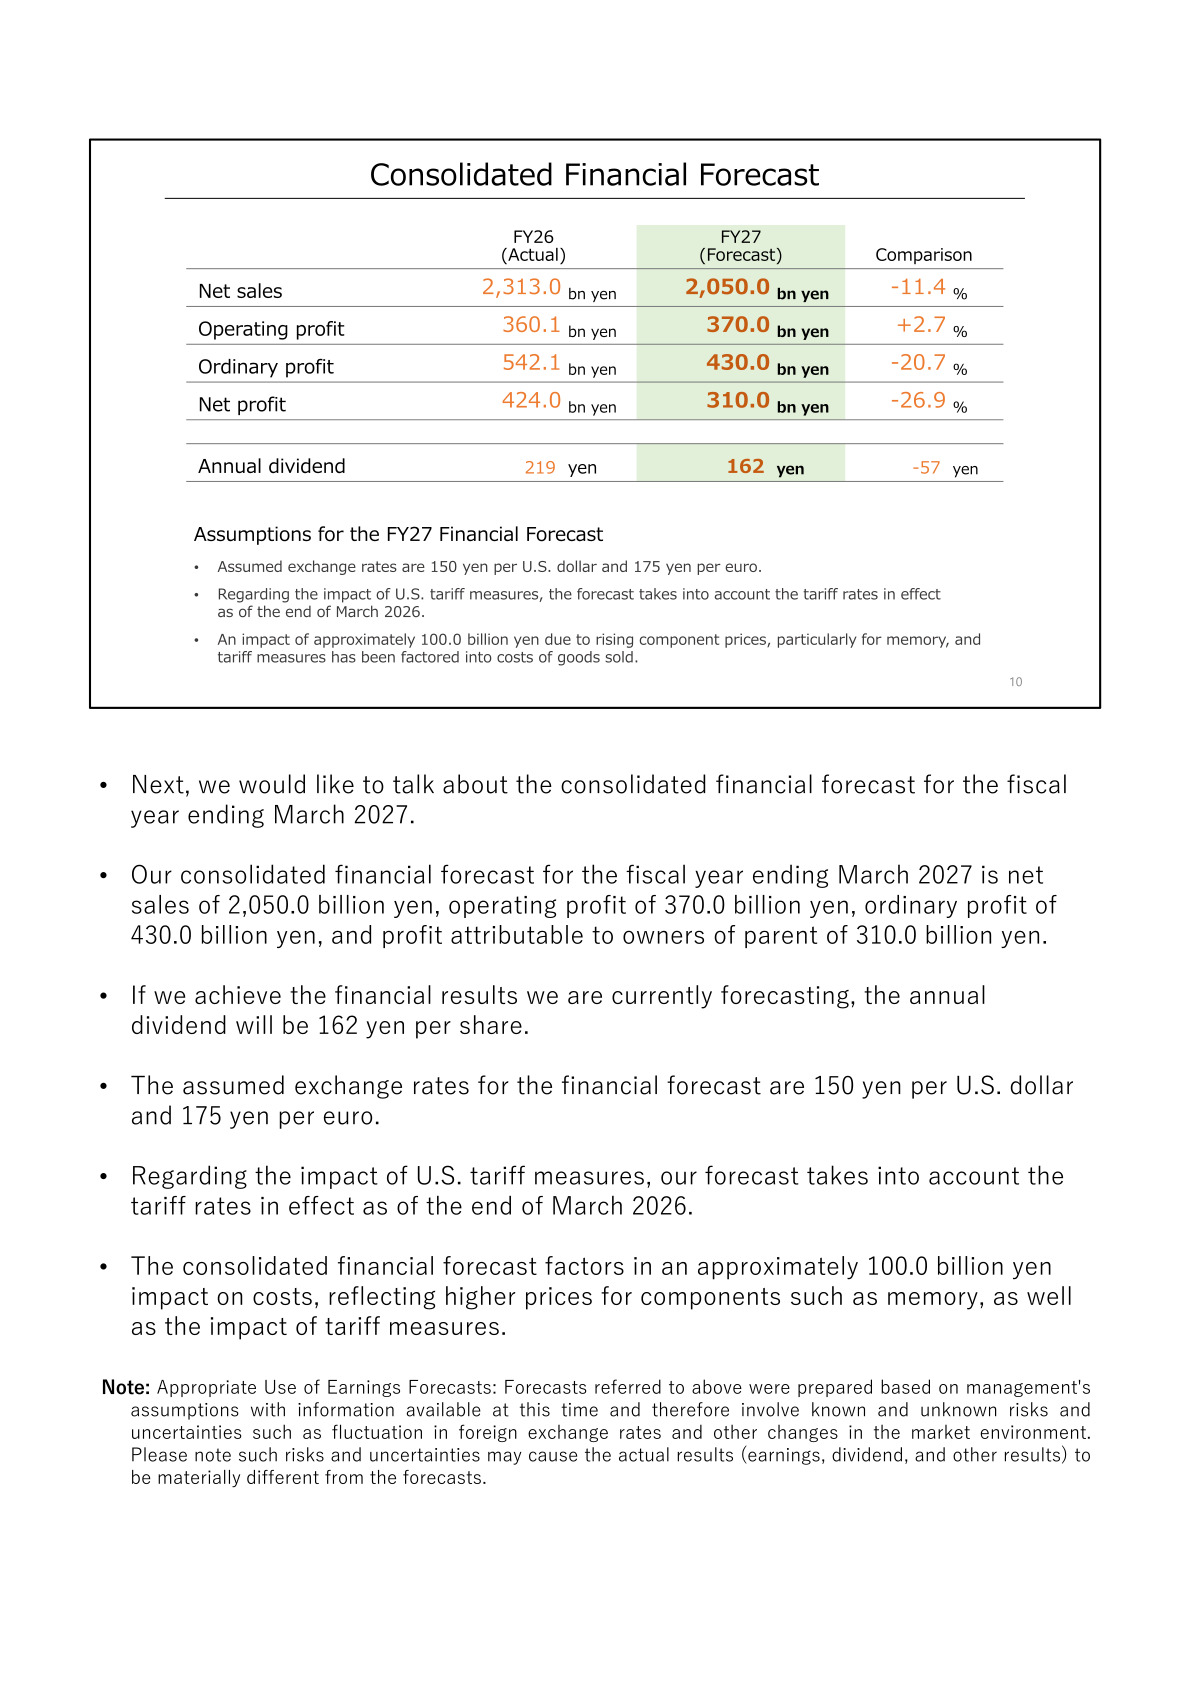
For the fiscal year ending March 2027, Nintendo forecasts net sales of 2,050.0 billion yen (-11.4%), operating profit of 370.0 billion yen (+2.7%), ordinary profit of 430.0 billion yen (-20.7%), and profit attributable to owners of parent of 310.0 billion yen (-26.9%). The forecast assumes exchange rates of 150 yen per U.S. dollar and 175 yen per euro, and factors in an impact of approximately 100.0 billion yen on cost of goods sold from rising component prices (particularly memory) and tariff measures, based on tariff rates in effect as of the end of March 2026. Nintendo Switch 2 hardware sales are forecast to decline 16.9% to 16.50 million units, while Nintendo Switch 2 software sales are forecast to rise 23.2% to 60.00 million units; Nintendo Switch hardware sales are forecast to decline 47.4% to 2.00 million units and software sales to decline 23.3% to 105.00 million units.
| Item | FY2027 Forecast | FY2026 (Actual) | Change |
|---|---|---|---|
| Net sales | 2,050.0 bn yen | 2,313.0 bn yen | -11.4% |
| Operating profit | 370.0 bn yen | 360.1 bn yen | +2.7% |
| Ordinary profit | 430.0 bn yen | 542.1 bn yen | -20.7% |
| Net profit | 310.0 bn yen | 424.0 bn yen | -26.9% |
| Annual dividend | 162 yen | 219 yen | -57 yen |
| Nintendo Switch 2 – Hardware (mil units) | 16.50 | 19.86 | -16.9% |
| Nintendo Switch 2 – Software (mil units) | 60.00 | 48.71 | +23.2% |
| Nintendo Switch – Hardware (mil units) | 2.00 | 3.80 | -47.4% |
| Nintendo Switch – Software (mil units) | 105.00 | 136.91 | -23.3% |
Price Revisions for Nintendo Switch 2
Nintendo announced price revisions for Nintendo Switch 2, the impact of which is reflected in the FY2027 forecast. In Japan, effective May 25, 2026, the manufacturer’s suggested retail price of the Nintendo Switch 2 Japanese-Language System (Japan only) will rise from 49,980 yen to 59,980 yen. In the United States, effective September 1, 2026, the price will rise from $449.99 to $499.99. In Europe, effective September 1, 2026, the price on My Nintendo Store will rise from €469.99 to €499.99. Price revisions for Nintendo Switch 2 and Nintendo Switch will also be implemented in other regions.
Shareholder Returns
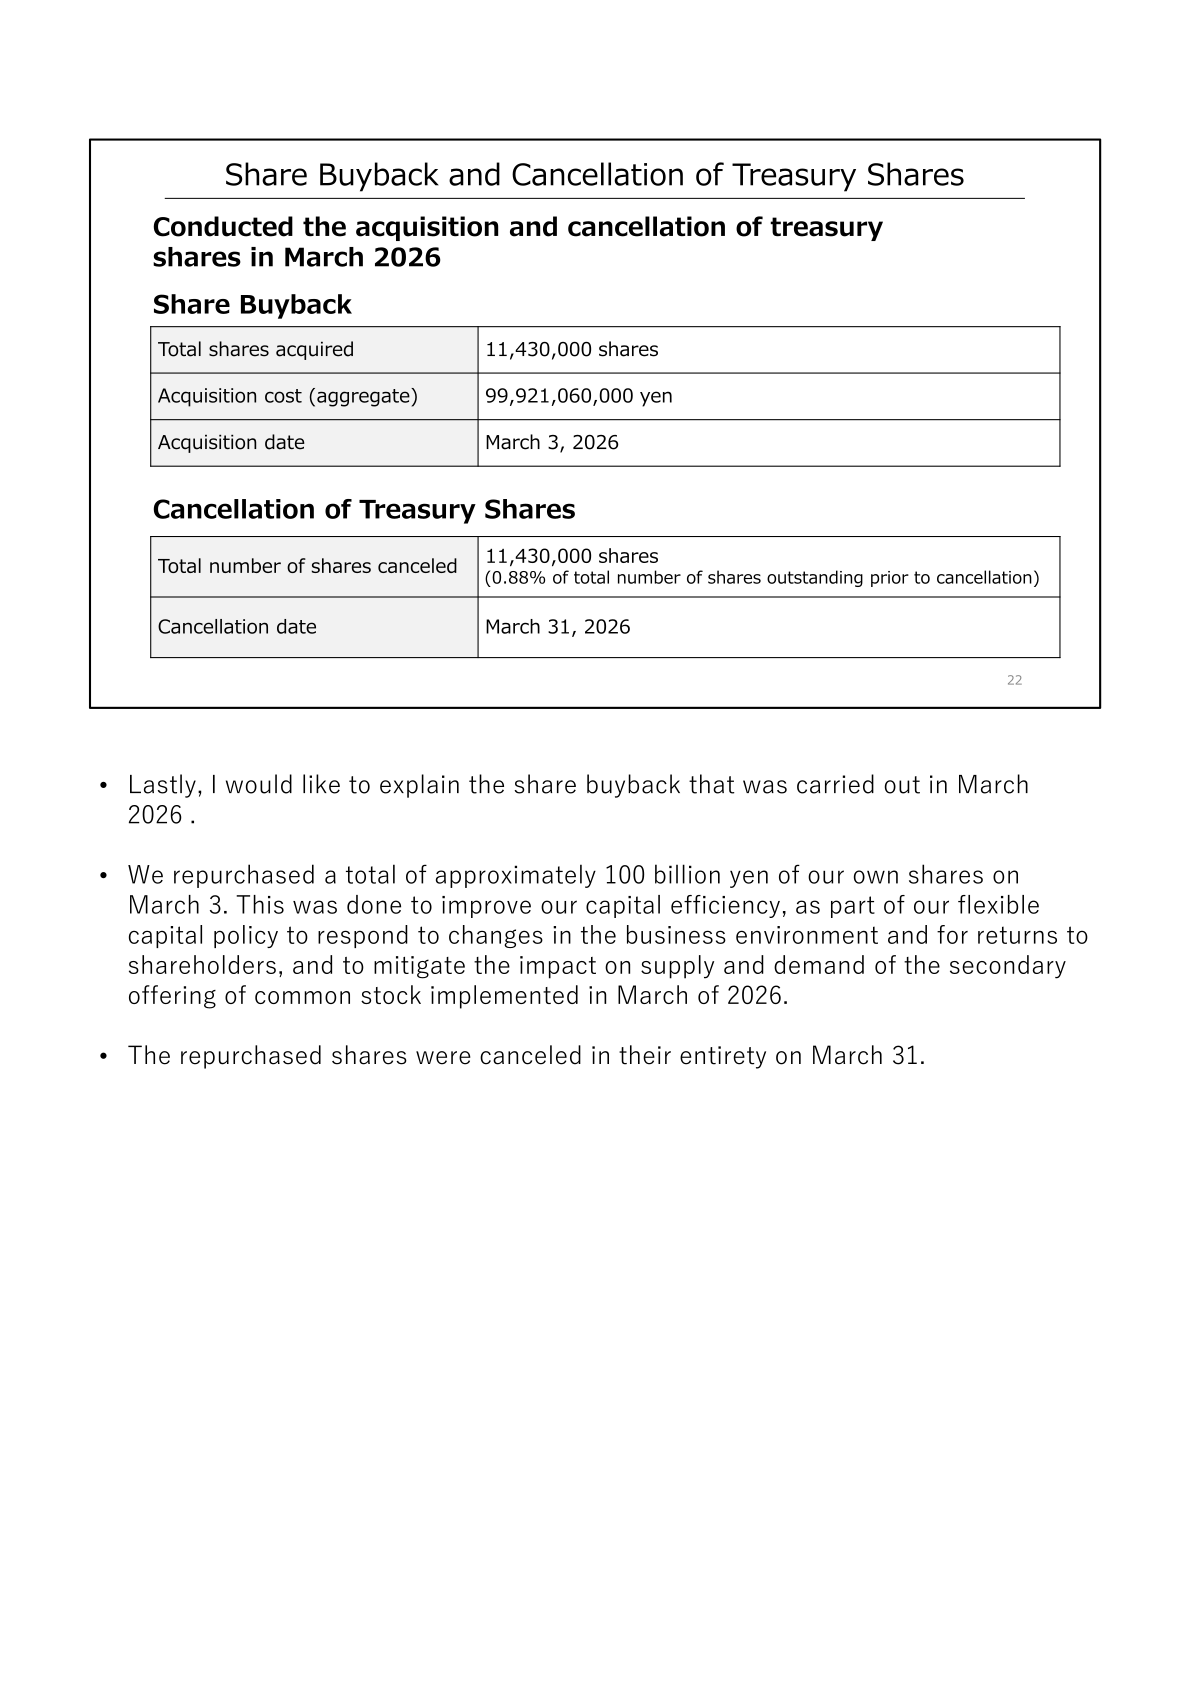
Nintendo’s annual dividend for FY2026 was 219 yen per share; the FY2027 forecast dividend is 162 yen per share, down 57 yen year on year. Separately, Nintendo conducted a share buyback in March 2026, acquiring a total of 11,430,000 shares for an aggregate cost of 99,921,060,000 yen on March 3, 2026, as part of its flexible capital policy to improve capital efficiency, respond to changes in the business environment, provide returns to shareholders, and mitigate the impact on supply and demand from the secondary offering of common stock implemented in March 2026. The full 11,430,000 shares (0.88% of the total number of shares outstanding prior to cancellation) were cancelled on March 31, 2026.
| Item | FY2026 | FY2027 (Forecast) |
|---|---|---|
| Annual dividend per share | 219 yen | 162 yen |
| Share buyback – total shares acquired | 11,430,000 shares | – |
| Share buyback – acquisition cost (aggregate) | 99,921,060,000 yen | – |
| Treasury shares cancelled | 11,430,000 shares (0.88% of total shares outstanding prior to cancellation) | – |
This article is an analysis based on publicly available information and is not a recommendation to buy or sell any specific securities. Investment decisions are your own responsibility.
![[Obayashi] Investors’ Guide 2026 — The Complete 24-Article Breakdown](https://japan-equity.com/wp-content/uploads/2026/07/hub_cover-1024x1024.png)
![[Obayashi] IR & SR Policy — Feeding Dialogue Back into Management](https://japan-equity.com/wp-content/uploads/2026/07/p32_sq-1024x1024.jpg)
![[Obayashi] Real Estate Development — 18.7% Margin, ¥287.7bn Unrealized Gains](https://japan-equity.com/wp-content/uploads/2026/07/p20_sq-1024x1024.jpg)
![[Obayashi] Domestic Civil Engineering — Resilience Spending Supports 9.6% Margin](https://japan-equity.com/wp-content/uploads/2026/07/p11_sq-1024x1024.jpg)
![[Obayashi] Share Price & External Ratings — vs TOPIX, ESG Index Inclusion](https://japan-equity.com/wp-content/uploads/2026/07/p40_sq-1024x1024.jpg)
![[Construction] ¥75.5tn Investment, Shrinking Workforce — Big-5 Market Share](https://japan-equity.com/wp-content/uploads/2026/07/p12_sq-1024x1024.jpg)



![[Obayashi] Capital Policy & Shareholder Returns — ROE 10%+, DOE ~5%, ¥100bn Buyback](https://japan-equity.com/wp-content/uploads/2026/07/p27_sq-1024x1024.jpg)
![[Obayashi] Reducing Cross-Shareholdings — ¥285.2bn Sold in Five Years](https://japan-equity.com/wp-content/uploads/2026/07/p29_sq-1024x1024.jpg)
![[Obayashi] ¥750bn Investment Plan — ¥300bn to Development, ¥190bn to Tech/DX](https://japan-equity.com/wp-content/uploads/2026/07/p30_sq-1024x1024.jpg)
![[Obayashi] MTP2022 KPIs — Operating Profit ~2x Target, ROE 14.4%](https://japan-equity.com/wp-content/uploads/2026/07/p25_sq-1024x1024.jpg)
![[Obayashi] Cash Allocation — ¥420bn Investment CF Over Five Years](https://japan-equity.com/wp-content/uploads/2026/07/p26_sq-1024x1024.jpg)
![[Obayashi] Green Energy — 44 Plants, 344MW, and the Green Hydrogen Challenge](https://japan-equity.com/wp-content/uploads/2026/07/p21_sq-1024x1024.jpg)
![[Obayashi] Tackling the Labor Shortage — Robotics Construction®](https://japan-equity.com/wp-content/uploads/2026/07/p14_sq-1024x1024.jpg)
