
This article is based on publicly available IR materials and is not a recommendation to buy or sell any specific securities.
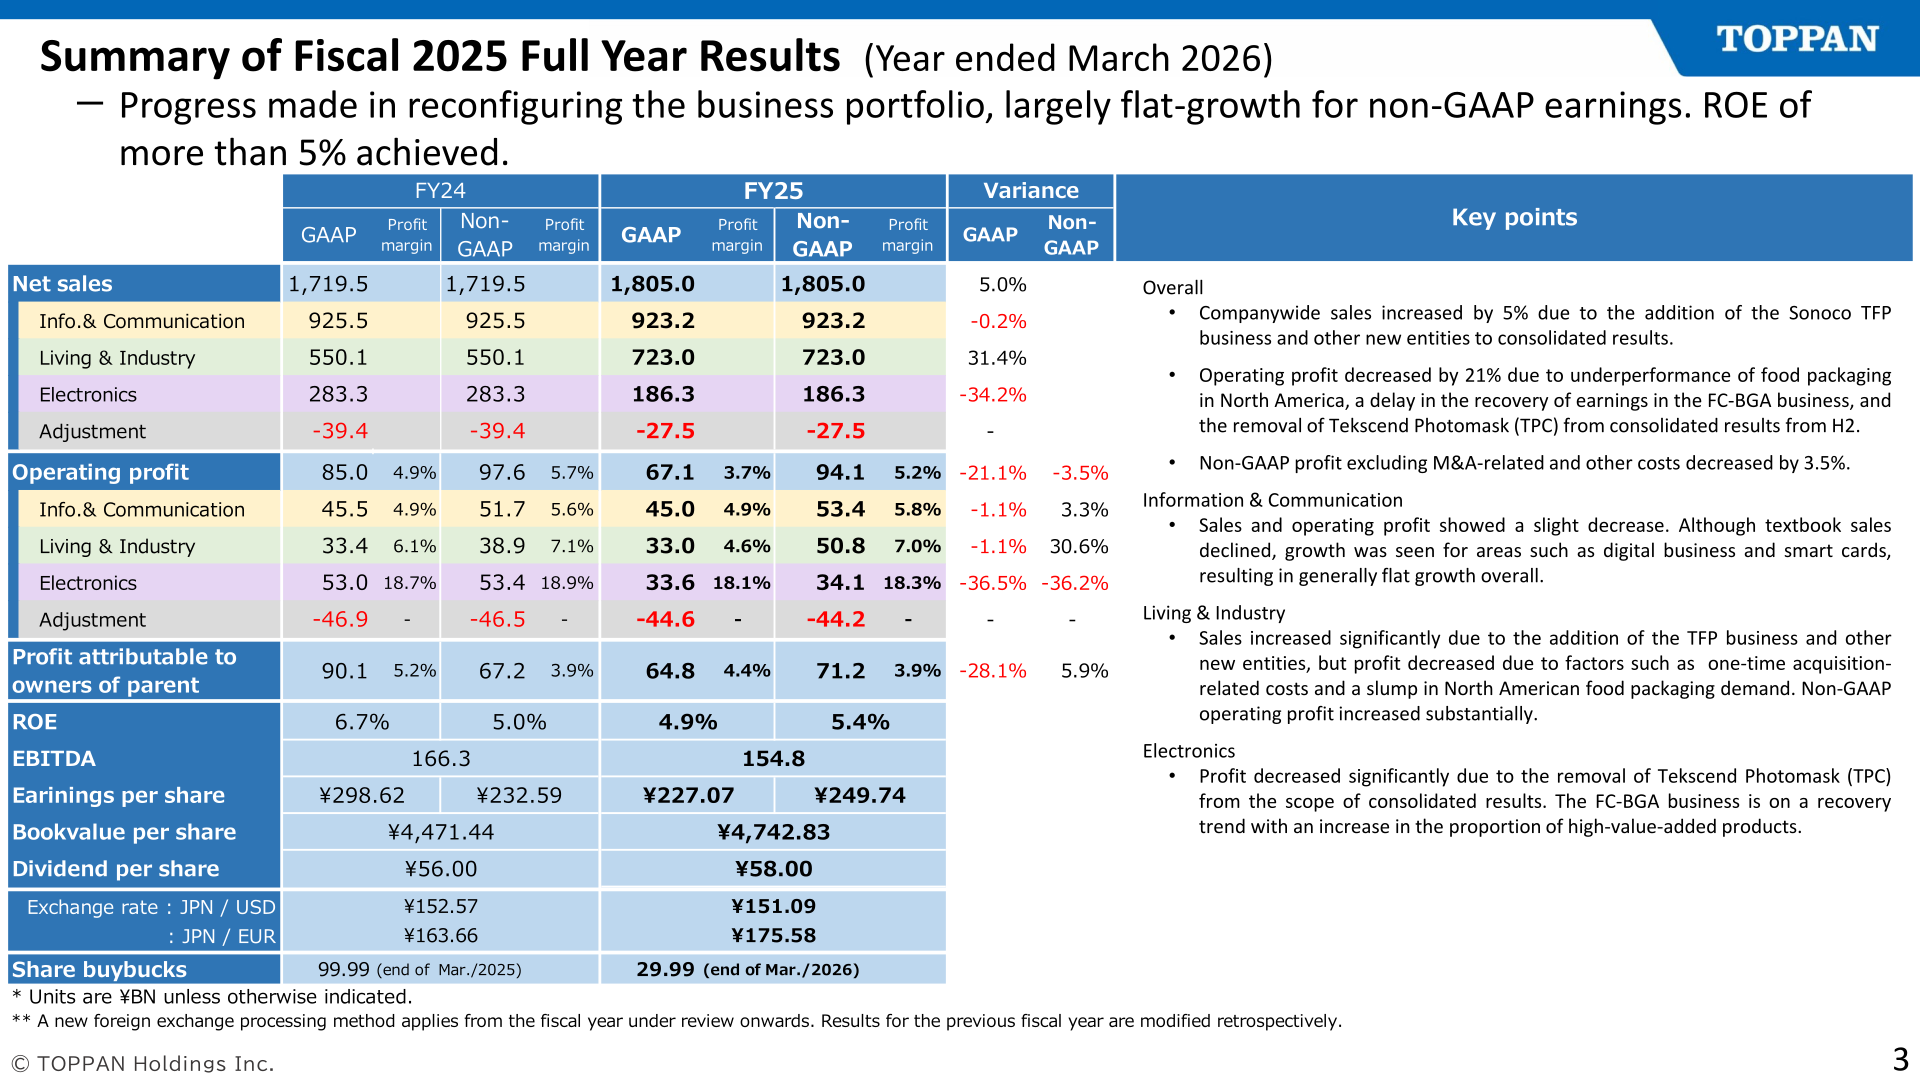
TOPPAN Holdings reported fiscal 2025 (the year ended March 2026) net sales of JPY 1,805.0 billion, up 5.0% year on year, as the Sonoco TFP business and other newly consolidated entities were added to the group. Operating profit fell 21.1% to JPY 67.1 billion on underperformance of food packaging in North America, a delay in the recovery of earnings in the FC-BGA business, and the removal of Tekscend Photomask (TPC) from consolidated results from the second half. Non-GAAP operating profit, which excludes M&A-related and other costs, decreased by 3.5% to JPY 94.1 billion, and profit attributable to owners of parent declined 28.1% to JPY 64.8 billion. The company describes the year as one in which progress was made in reconfiguring the business portfolio, with largely flat growth for non-GAAP earnings and ROE of more than 5% achieved on a non-GAAP basis.
Consolidated Results (Full-Year Actual)
Units are JPY bn unless otherwise indicated. The materials note that a new foreign exchange processing method applies from the fiscal year under review onwards and that results for the previous fiscal year have been modified retrospectively. The gross profit margin worsened by 0.5 percentage point to 23.5%, as the proportion of high-value-added items in the product mix declined due to TPC’s removal from the scope of consolidation, a delayed recovery for FC-BGAs, and slow demand for food packaging in North America. The SG&A ratio rose by 0.7 percentage point to 19.8%, mainly because of new additions to the scope of consolidation. Non-operating income increased to positive JPY 8.6 billion (positive JPY 4.5 billion in the previous year), helped by a JPY 5.8 billion increase in equity in earnings of affiliates as TPC became an equity-method associate.
| Item | FY2025 | FY2024 | Change |
|---|---|---|---|
| Net sales | 1,805.0 | 1,719.5 | 5.0% |
| Gross profit | 424.2 | 413.3 | – |
| Gross margin (%) | 23.5 | 24.0 | – |
| SG&A | 357.1 | 328.2 | – |
| SG&A to sales (%) | 19.8 | 19.1 | – |
| Operating profit | 67.1 | 85.0 | -21.1% |
| Operating profit margin | 3.7% | 4.9% | – |
| Non-GAAP operating profit | 94.1 | 97.6 | -3.5% |
| Non-GAAP operating profit margin | 5.2% | 5.7% | – |
| Ordinary profit | 75.7 | 89.5 | – |
| Profit before taxes | 105.3 | 185.2 | – |
| Profit attributable to owners of parent | 64.8 | 90.1 | -28.1% |
| Non-GAAP net profit | 71.2 | 67.2 | 5.9% |
| EBITDA | 154.8 | 166.3 | – |
| ROE | 4.9% | 6.7% | – |
| Non-GAAP ROE | 5.4% | 5.0% | – |
| Earnings per share | ¥227.07 | ¥298.62 | – |
| Non-GAAP earnings per share | ¥249.74 | ¥232.59 | – |
| Bookvalue per share | ¥4,742.83 | ¥4,471.44 | – |
| Dividend per share | ¥58.00 | ¥56.00 | – |
| Exchange rate (JPY/USD) | ¥151.09 | ¥152.57 | – |
| Exchange rate (JPY/EUR) | ¥175.58 | ¥163.66 | – |
Segment Results
Information & Communication saw a slight decrease in both sales and operating profit: textbook sales declined, while growth in areas such as the digital business and smart cards left the segment generally flat overall. Non-GAAP operating profit for the segment rose 3.3%. Living & Industry sales increased significantly on the addition of the TFP business and other new entities, but operating profit decreased because of one-time acquisition-related costs and a slump in North American food packaging demand; non-GAAP operating profit increased substantially, by 30.6%. Electronics profit decreased significantly due to the removal of Tekscend Photomask (TPC) from the scope of consolidated results, although the company states that the FC-BGA business is on a recovery trend with an increase in the proportion of high-value-added products.
| Segment | Metric | FY2025 | FY2024 | Change |
|---|---|---|---|---|
| Info.& Communication | Net sales | 923.2 | 925.5 | -0.2% |
| Info.& Communication | Operating profit | 45.0 | 45.5 | -1.1% |
| Info.& Communication | Non-GAAP operating profit | 53.4 | 51.7 | 3.3% |
| Living & Industry | Net sales | 723.0 | 550.1 | 31.4% |
| Living & Industry | Operating profit | 33.0 | 33.4 | -1.1% |
| Living & Industry | Non-GAAP operating profit | 50.8 | 38.9 | 30.6% |
| Electronics | Net sales | 186.3 | 283.3 | -34.2% |
| Electronics | Operating profit | 33.6 | 53.0 | -36.5% |
| Electronics | Non-GAAP operating profit | 34.1 | 53.4 | -36.2% |
| Adjustment | Net sales | -27.5 | -39.4 | – |
| Adjustment | Operating profit | -44.6 | -46.9 | – |
| Adjustment | Non-GAAP operating profit | -44.2 | -46.5 | – |
Within Information & Communication, the Erhoeht-X growth businesses recorded sales of JPY 332.0 bn in fiscal 2025 against JPY 295.0 bn in fiscal 2024, an increase of JPY 37.0 bn, with the security business at JPY 110.0 bn (up JPY 31.0 bn) and marketing DX at JPY 60.0 bn (up JPY 11.0 bn). In Living & Industry, packaging accounted for approximately 80% of segment sales and décor materials approximately 20%. In Electronics, semiconductors accounted for approximately 75% of segment sales and displays approximately 25%; the company notes a decrease in profit of approximately JPY 0.7 billion from foreign exchange, centered on semiconductors.
FY2026 Forecast
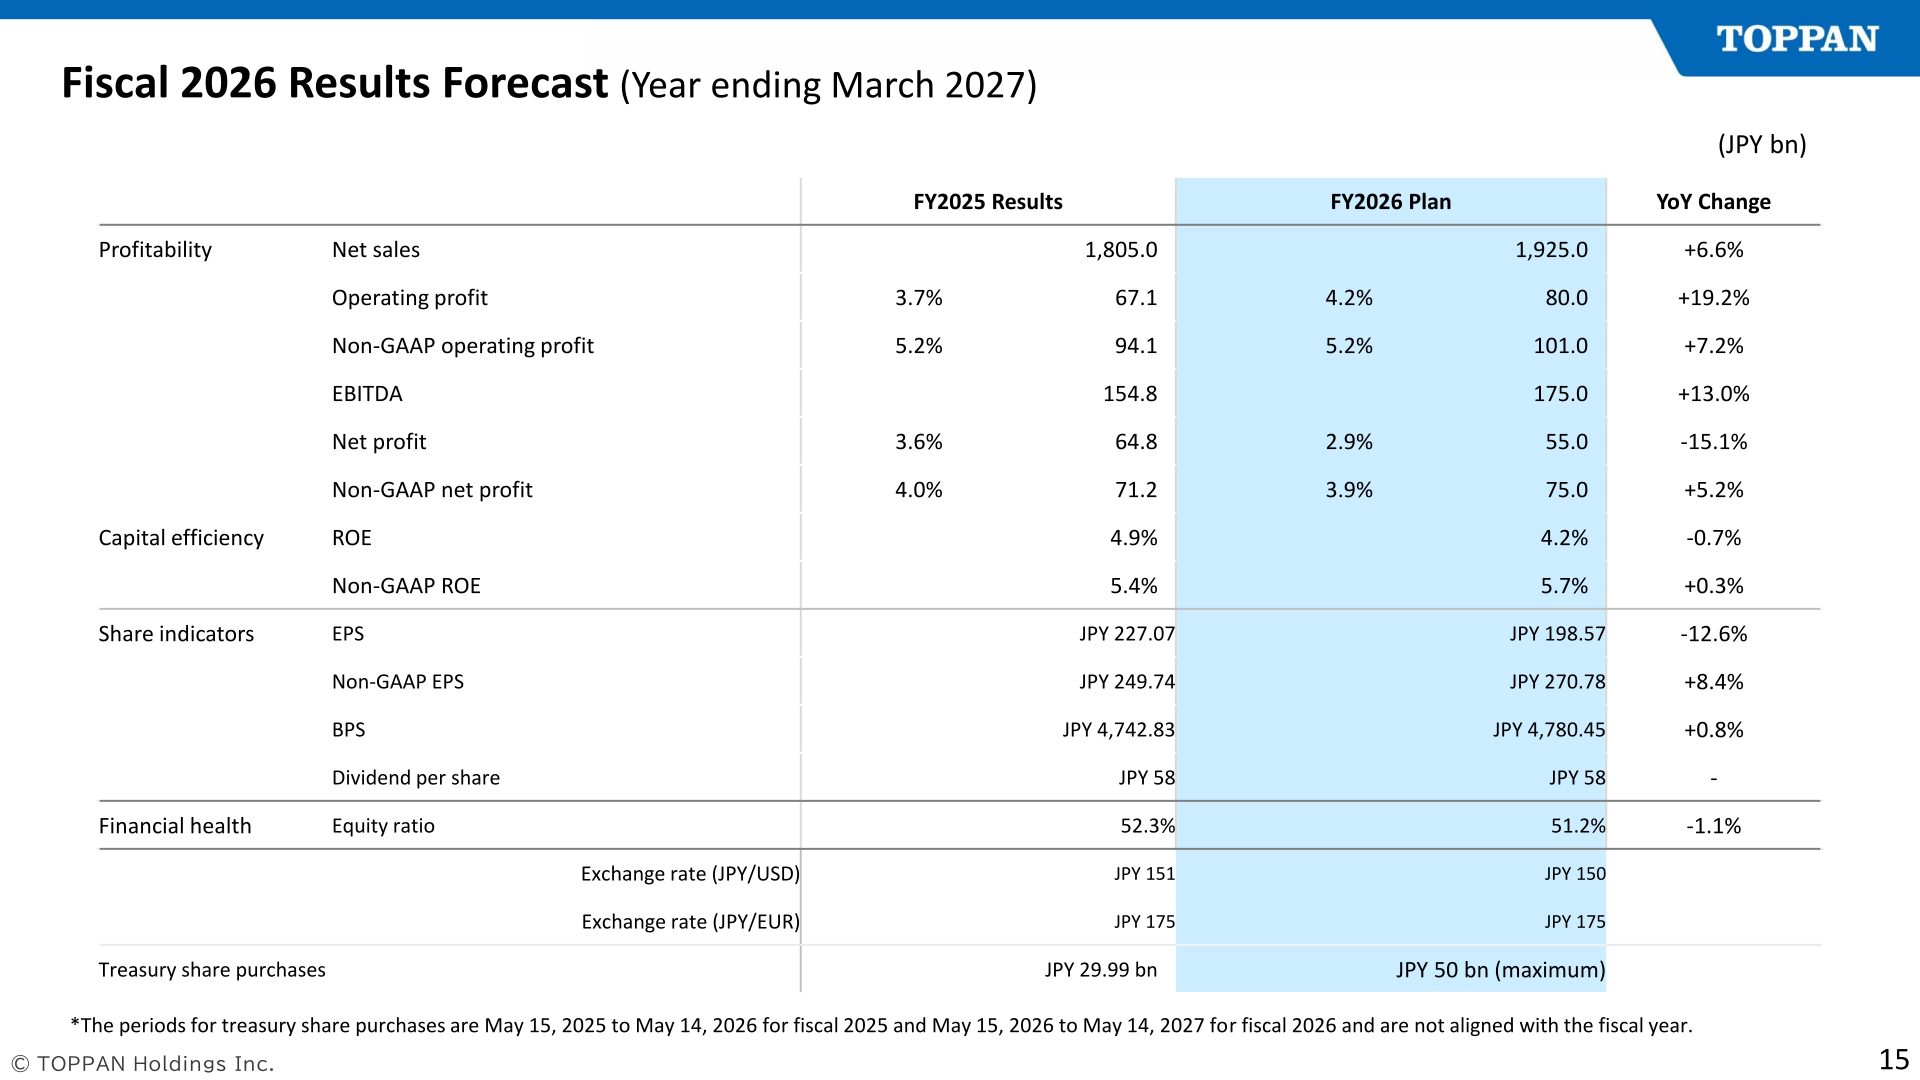
For fiscal 2026 (the year ending March 2027) TOPPAN Holdings plans net sales of JPY 1,925.0 billion (up 6.6%), operating profit of JPY 80.0 billion (up 19.2%) and non-GAAP operating profit of JPY 101.0 billion (up 7.2%). Net profit is planned at JPY 55.0 billion, down 15.1%, while non-GAAP net profit is planned at JPY 75.0 billion, up 5.2%. The company expects profit to increase as the impact of TPC’s transition to an equity-method associate is offset by a reduction in one-time costs and growth of the respective businesses.
| Item | FY2026 Plan | FY2025 (Actual) | YoY Change |
|---|---|---|---|
| Net sales | 1,925.0 | 1,805.0 | +6.6% |
| Operating profit | 80.0 | 67.1 | +19.2% |
| Operating profit margin | 4.2% | 3.7% | – |
| Non-GAAP operating profit | 101.0 | 94.1 | +7.2% |
| Non-GAAP operating profit margin | 5.2% | 5.2% | – |
| EBITDA | 175.0 | 154.8 | +13.0% |
| Net profit | 55.0 | 64.8 | -15.1% |
| Non-GAAP net profit | 75.0 | 71.2 | +5.2% |
| ROE | 4.2% | 4.9% | -0.7% |
| Non-GAAP ROE | 5.7% | 5.4% | +0.3% |
| EPS | JPY 198.57 | JPY 227.07 | -12.6% |
| Non-GAAP EPS | JPY 270.78 | JPY 249.74 | +8.4% |
| BPS | JPY 4,780.45 | JPY 4,742.83 | +0.8% |
| Dividend per share | JPY 58 | JPY 58 | – |
| Equity ratio | 51.2% | 52.3% | -1.1% |
| Exchange rate (JPY/USD) | JPY 150 | JPY 151 | – |
| Exchange rate (JPY/EUR) | JPY 175 | JPY 175 | – |
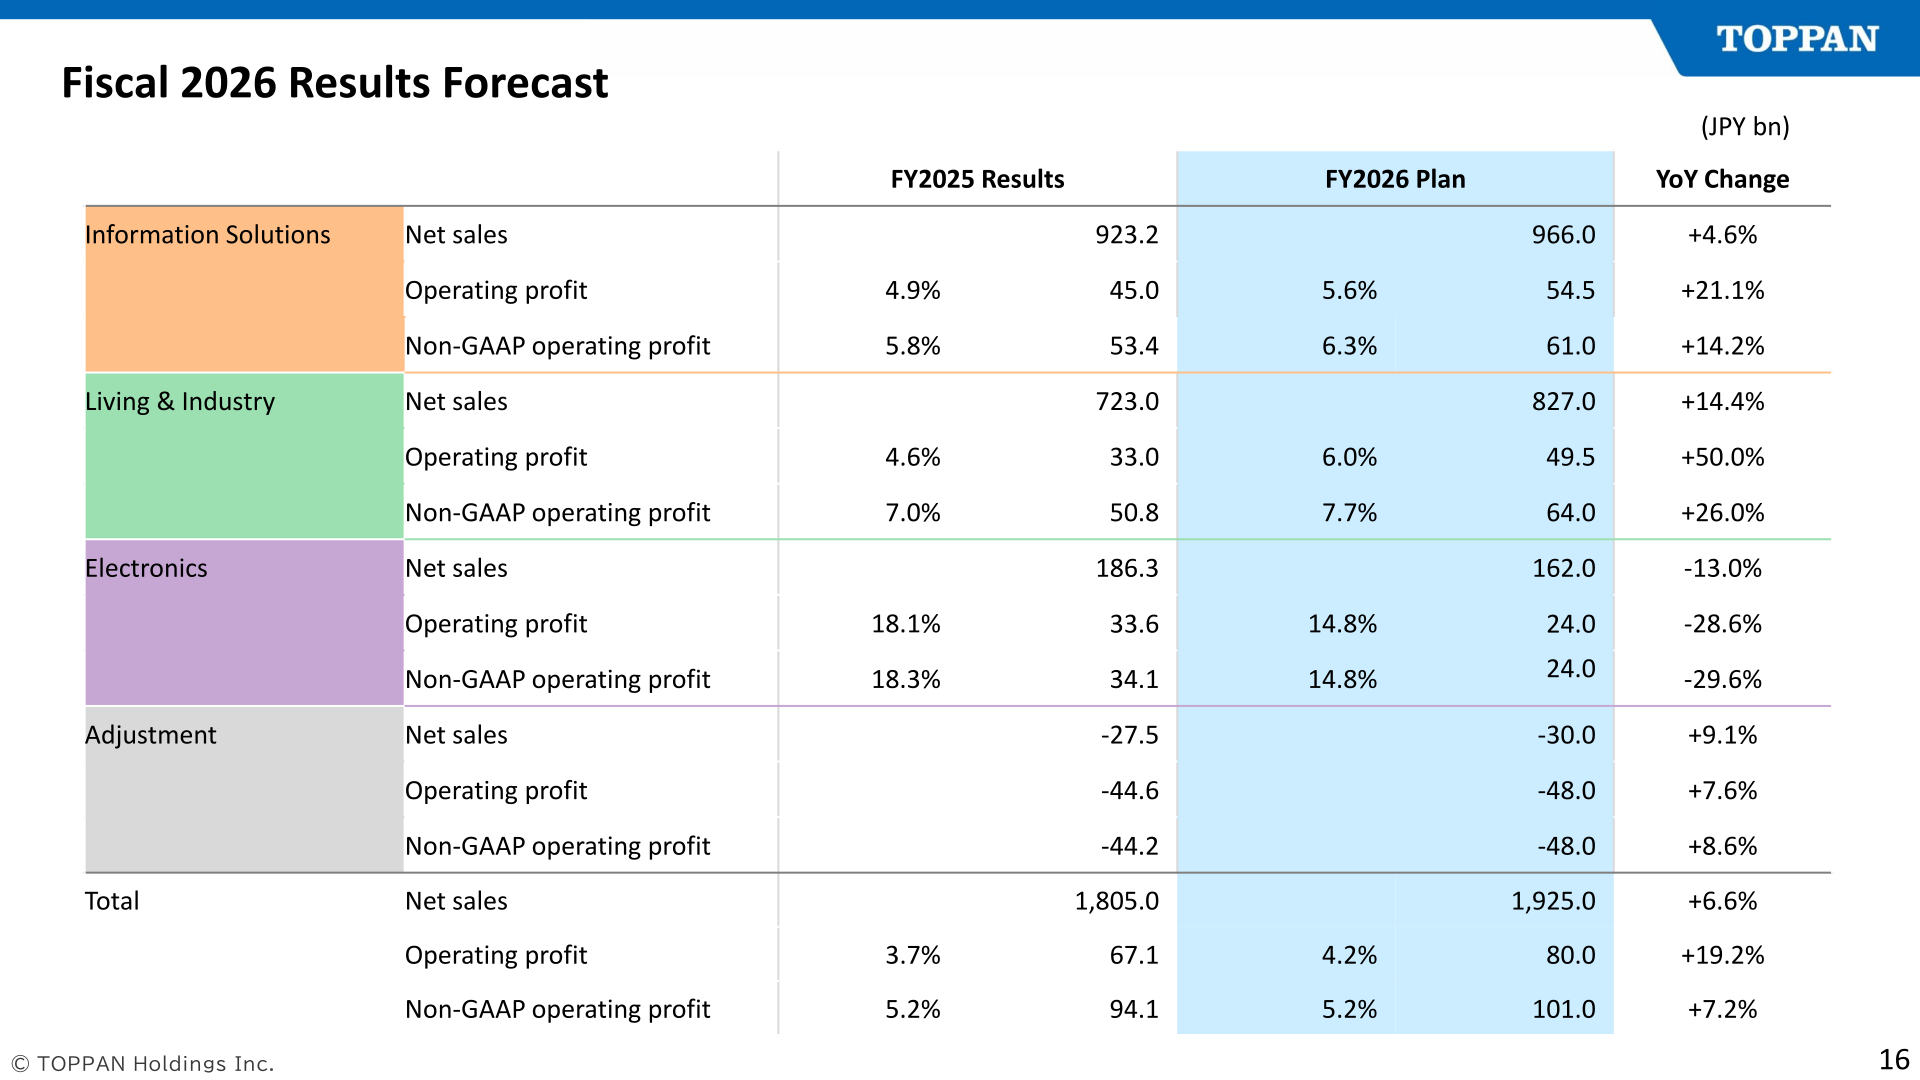
By segment, the plan calls for growth in Information Solutions and Living & Industry and a decline in Electronics. Information Solutions is expected to post net sales of JPY 966.0 bn and non-GAAP operating profit of JPY 61.0 bn; Living & Industry net sales of JPY 827.0 bn and non-GAAP operating profit of JPY 64.0 bn, helped by a reduction of M&A-related one-time costs of JPY 7.8 bn in packaging; and Electronics net sales of JPY 162.0 bn and non-GAAP operating profit of JPY 24.0 bn, reflecting the deconsolidation of TPC and rising R&D costs for advanced semiconductor packaging even as FC-BGA profit increases significantly.
| Segment | Metric | FY2026 Plan | FY2025 (Actual) | YoY Change |
|---|---|---|---|---|
| Information Solutions | Net sales | 966.0 | 923.2 | +4.6% |
| Information Solutions | Operating profit | 54.5 | 45.0 | +21.1% |
| Information Solutions | Non-GAAP operating profit | 61.0 | 53.4 | +14.2% |
| Living & Industry | Net sales | 827.0 | 723.0 | +14.4% |
| Living & Industry | Operating profit | 49.5 | 33.0 | +50.0% |
| Living & Industry | Non-GAAP operating profit | 64.0 | 50.8 | +26.0% |
| Electronics | Net sales | 162.0 | 186.3 | -13.0% |
| Electronics | Operating profit | 24.0 | 33.6 | -28.6% |
| Electronics | Non-GAAP operating profit | 24.0 | 34.1 | -29.6% |
| Adjustment | Net sales | -30.0 | -27.5 | +9.1% |
| Adjustment | Operating profit | -48.0 | -44.6 | +7.6% |
| Adjustment | Non-GAAP operating profit | -48.0 | -44.2 | +8.6% |
Shareholder Returns
The dividend per share for fiscal 2025 was JPY 58.00, against JPY 56.00 for fiscal 2024, and the fiscal 2026 plan is for a dividend per share of JPY 58, unchanged year on year. Treasury share purchases amounted to JPY 29.99 bn for fiscal 2025 (JPY 99.99 bn for the previous year), and the fiscal 2026 plan is for a maximum of JPY 50 bn. The materials note that the periods for treasury share purchases are May 15, 2025 to May 14, 2026 for fiscal 2025 and May 15, 2026 to May 14, 2027 for fiscal 2026, and are not aligned with the fiscal year. Bookvalue per share stood at ¥4,742.83 at the end of fiscal 2025 versus ¥4,471.44 a year earlier, and the plan for fiscal 2026 is JPY 4,780.45.
Medium-Term Plan / Topics
TOPPAN Holdings states that its medium-term plan (MTP) target for strategic shareholdings has been achieved, with the ratio to consolidated net assets at 12.3% as of the end of March 2026 including deemed-owned shares, against an MTP target of less than 15%. The number of stocks held fell from 321 at the end of March 2018 to 174 at the end of March 2025 and 156 at the end of March 2026, a reduction of 165 stocks, or 51% compared with the end of March 2018, after divesting some or all of the shareholdings of 36 stocks during fiscal 2025. The value of divestments since April 2018 is approximately JPY 800 bn, and in the next MTP the company aims to achieve a ratio of less than 7% at the end of March 2029.
The company also outlined the impact of the situation in the Middle East as of May 14, 2026, stating that the most significant impact is in the Living segment and that it will work to minimize the impact by passing through price increases and sourcing alternative products. It notes that it has generally secured enough inventory for the first quarter at the current time, but that the status for the second quarter and beyond remains uncertain due to the fluidity of the situation.
The materials also present a redefinition of the Information sub-segments, under which fiscal 2025 sales of JPY 923.2 bn for the segment as a whole are restated as Security JPY 221.7 bn, IoT Solutions JPY 18.3 bn, Marketing JPY 102.0 bn, BPO JPY 71.7 bn, Securities & Business Printing JPY 144.8 bn, Information Printing JPY 237.2 bn and Information (Other) JPY 127.3 bn.
This article is an analysis based on publicly available information and is not a recommendation to buy or sell any specific securities. Investment decisions are your own responsibility.
![[Obayashi] Investors’ Guide 2026 — The Complete 24-Article Breakdown](https://japan-equity.com/wp-content/uploads/2026/07/hub_cover-1024x1024.png)
![[Obayashi] IR & SR Policy — Feeding Dialogue Back into Management](https://japan-equity.com/wp-content/uploads/2026/07/p32_sq-1024x1024.jpg)
![[Obayashi] Real Estate Development — 18.7% Margin, ¥287.7bn Unrealized Gains](https://japan-equity.com/wp-content/uploads/2026/07/p20_sq-1024x1024.jpg)
![[Obayashi] Domestic Civil Engineering — Resilience Spending Supports 9.6% Margin](https://japan-equity.com/wp-content/uploads/2026/07/p11_sq-1024x1024.jpg)
![[Obayashi] Share Price & External Ratings — vs TOPIX, ESG Index Inclusion](https://japan-equity.com/wp-content/uploads/2026/07/p40_sq-1024x1024.jpg)
![[Construction] ¥75.5tn Investment, Shrinking Workforce — Big-5 Market Share](https://japan-equity.com/wp-content/uploads/2026/07/p12_sq-1024x1024.jpg)



![[Obayashi] Capital Policy & Shareholder Returns — ROE 10%+, DOE ~5%, ¥100bn Buyback](https://japan-equity.com/wp-content/uploads/2026/07/p27_sq-1024x1024.jpg)
![[Obayashi] Reducing Cross-Shareholdings — ¥285.2bn Sold in Five Years](https://japan-equity.com/wp-content/uploads/2026/07/p29_sq-1024x1024.jpg)
![[Obayashi] ¥750bn Investment Plan — ¥300bn to Development, ¥190bn to Tech/DX](https://japan-equity.com/wp-content/uploads/2026/07/p30_sq-1024x1024.jpg)
![[Obayashi] MTP2022 KPIs — Operating Profit ~2x Target, ROE 14.4%](https://japan-equity.com/wp-content/uploads/2026/07/p25_sq-1024x1024.jpg)
![[Obayashi] Cash Allocation — ¥420bn Investment CF Over Five Years](https://japan-equity.com/wp-content/uploads/2026/07/p26_sq-1024x1024.jpg)
![[Obayashi] Green Energy — 44 Plants, 344MW, and the Green Hydrogen Challenge](https://japan-equity.com/wp-content/uploads/2026/07/p21_sq-1024x1024.jpg)
![[Obayashi] Tackling the Labor Shortage — Robotics Construction®](https://japan-equity.com/wp-content/uploads/2026/07/p14_sq-1024x1024.jpg)
