
This article is based on publicly available IR materials and is not a recommendation to buy or sell any specific securities.
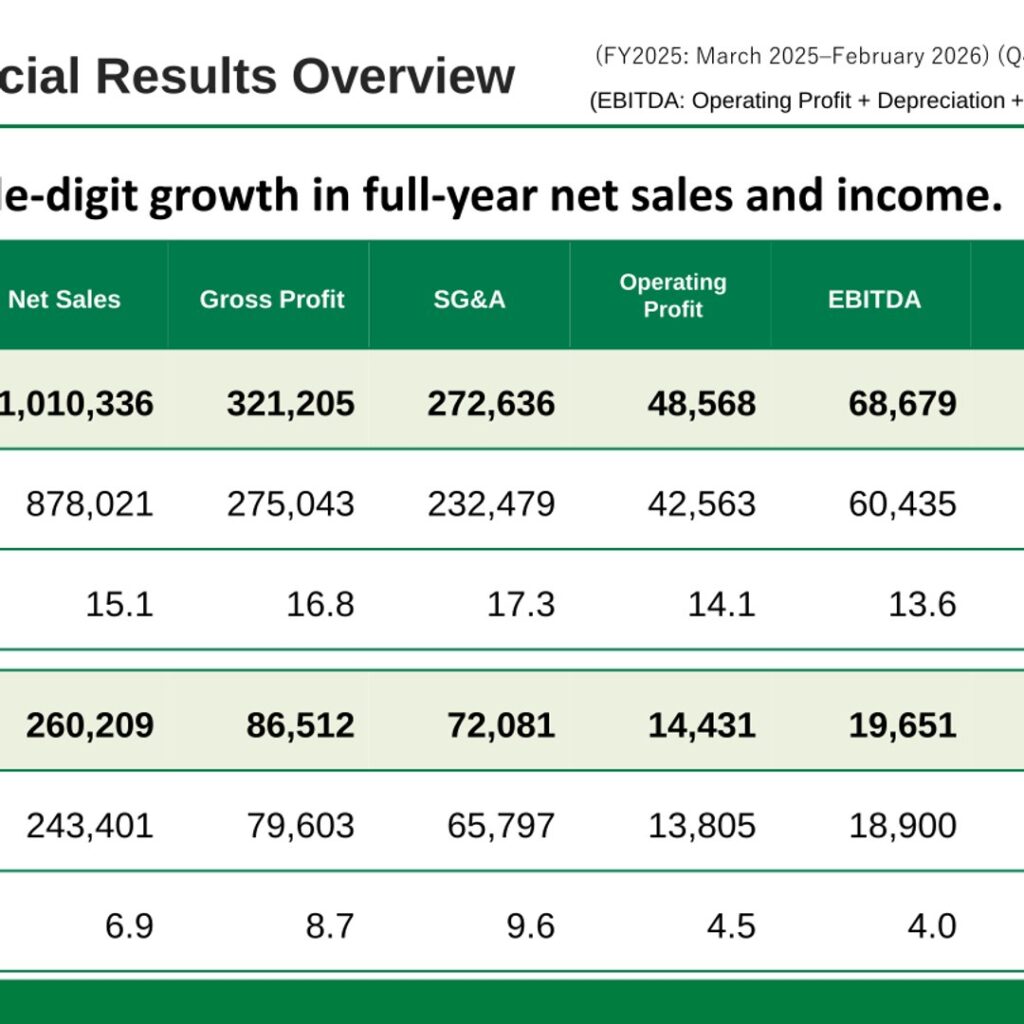
Note: Sugi Holdings has a February fiscal year-end, and the company labels the year running from March 2025 to February 2026 as “FY2025” in its IR materials, which matches the FY2025 label used on this site. In FY2025 the group posted net sales of 1,010,336 million yen, up 15.1% year on year, with operating profit of 48,568 million yen (up 14.1%) and profit attributable to owners of parent of 44,982 million yen (up 75.1%). The company states that it “achieved double-digit growth in full-year net sales and income.” For FY2026 the company budgets net sales of 1,092,000 million yen and operating profit of 54,000 million yen, while budgeting net income of 32,800 million yen, 27.1% below the FY2025 level.
Consolidated Results (Full-Year Actual)
All figures below are as presented in the company’s FY2025 IR Materials (April 9, 2026), in million yen and percent. FY2025 covers March 2025 to February 2026; Q4 covers December to February. EBITDA on this slide is defined by the company as operating profit plus depreciation plus amortisation of goodwill.
| Item | FY2025 | FY2024 | Rate of change (%) |
|---|---|---|---|
| Net Sales | 1,010,336 | 878,021 | 15.1 |
| Gross Profit | 321,205 | 275,043 | 16.8 |
| SG&A | 272,636 | 232,479 | 17.3 |
| Operating Profit | 48,568 | 42,563 | 14.1 |
| EBITDA | 68,679 | 60,435 | 13.6 |
| Ordinary Profit | 50,062 | 41,993 | 19.2 |
| Profit Attributable to Owners of Parent | 44,982 | 25,689 | 75.1 |
On a fourth-quarter basis (December to February), net sales were 260,209 million yen against 243,401 million yen a year earlier (up 6.9%), operating profit was 14,431 million yen (up 4.5%), ordinary profit was 15,311 million yen (up 31.6%) and profit attributable to owners of parent was 9,315 million yen (up 40.6%).
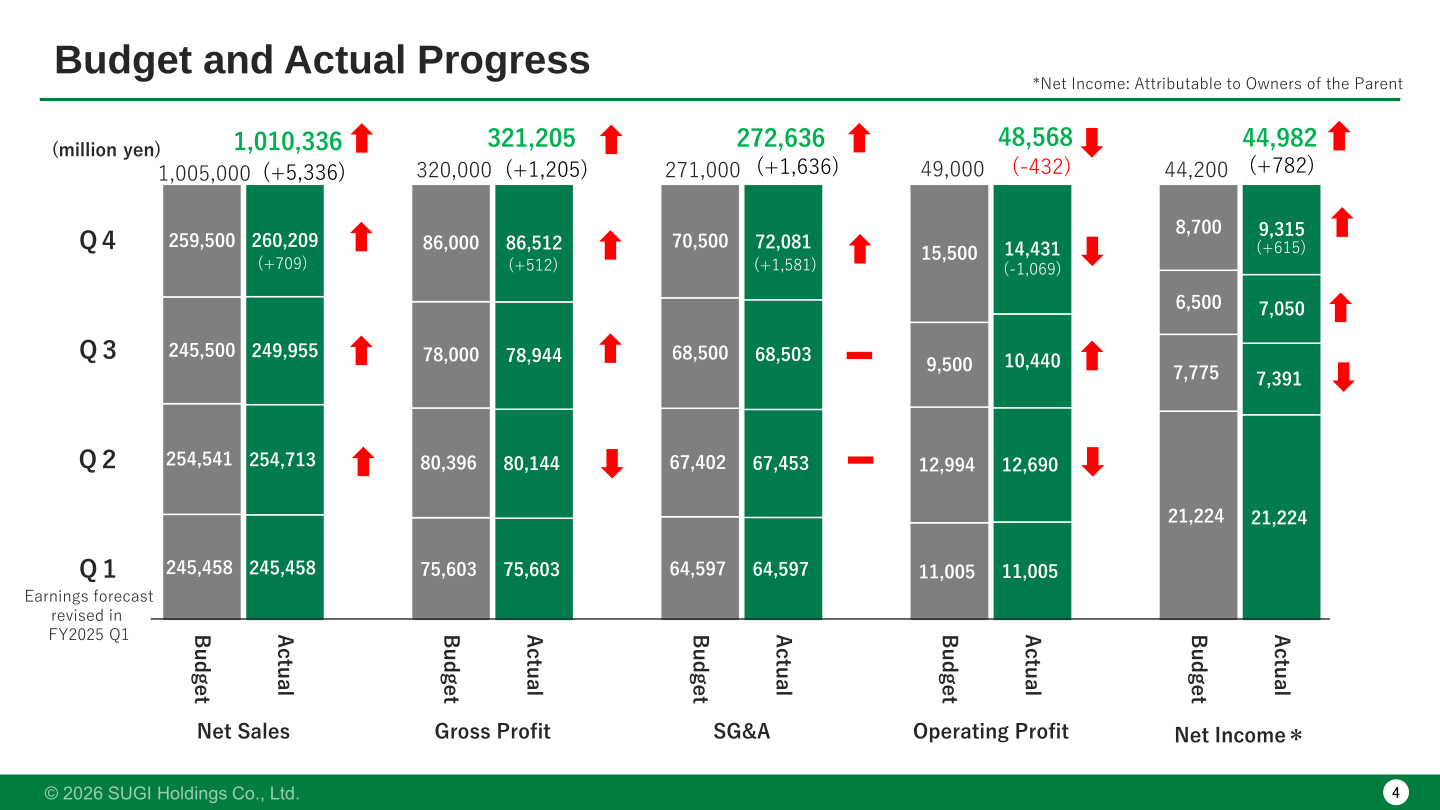
Against the full-year budget that was revised in FY2025 Q1, the company reports net sales of 1,010,336 million yen versus a budget of 1,005,000 million yen (+5,336), gross profit of 321,205 million yen versus 320,000 million yen (+1,205), SG&A of 272,636 million yen versus 271,000 million yen (+1,636), operating profit of 48,568 million yen versus 49,000 million yen (-432), and net income of 44,982 million yen versus 44,200 million yen (+782).
Segment Results
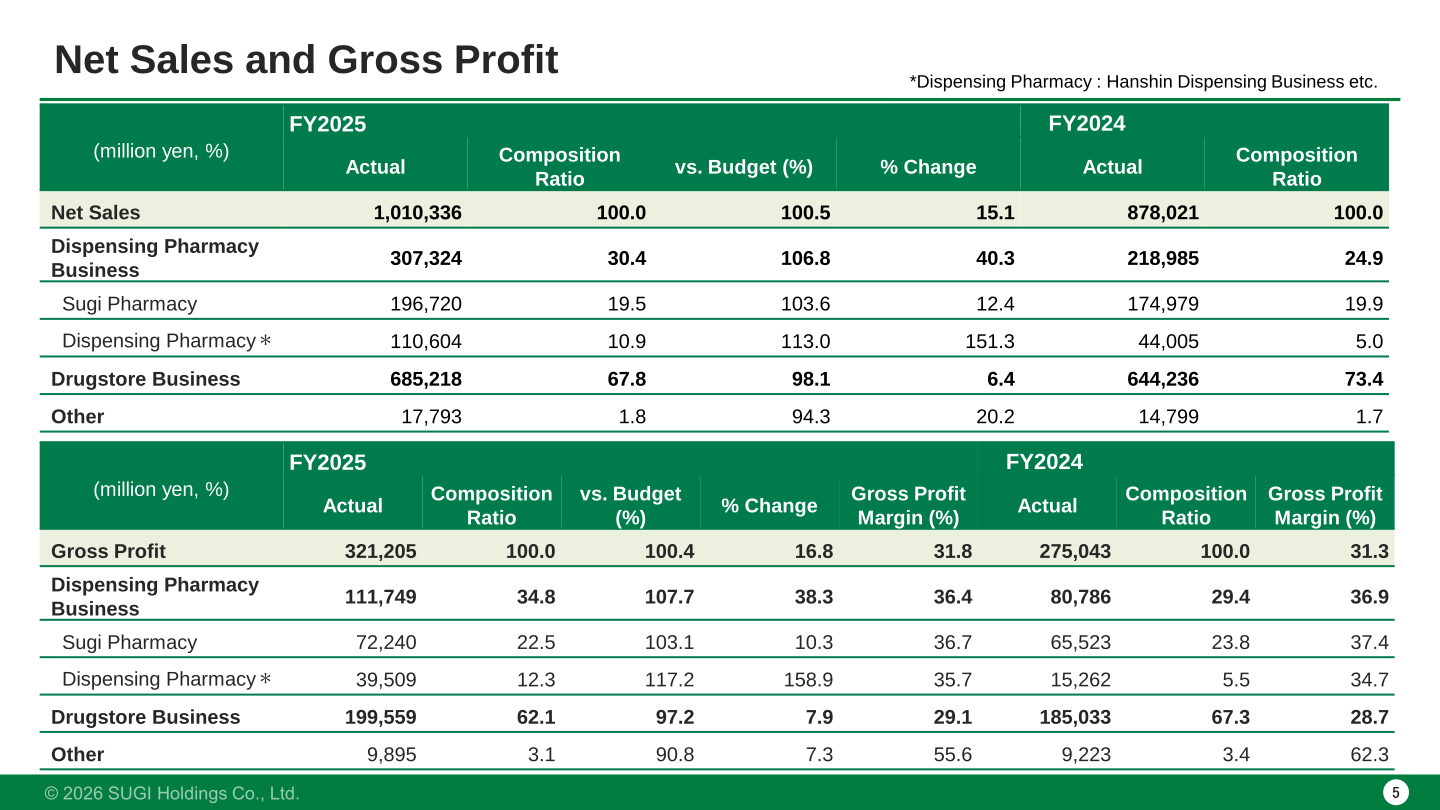
The company breaks the group down into the Dispensing Pharmacy Business (Sugi Pharmacy and other dispensing pharmacies, including the Hanshin dispensing business), the Drugstore Business, and Other. Dispensing Pharmacy Business net sales rose 40.3% to 307,324 million yen, lifting its share of group net sales to 30.4% from 24.9%, while the Drugstore Business grew 6.4% to 685,218 million yen.
| Business | FY2025 Net Sales | Composition Ratio (%) | vs. Budget (%) | % Change | FY2024 Net Sales |
|---|---|---|---|---|---|
| Net Sales (total) | 1,010,336 | 100.0 | 100.5 | 15.1 | 878,021 |
| Dispensing Pharmacy Business | 307,324 | 30.4 | 106.8 | 40.3 | 218,985 |
| Sugi Pharmacy | 196,720 | 19.5 | 103.6 | 12.4 | 174,979 |
| Dispensing Pharmacy* | 110,604 | 10.9 | 113.0 | 151.3 | 44,005 |
| Drugstore Business | 685,218 | 67.8 | 98.1 | 6.4 | 644,236 |
| Other | 17,793 | 1.8 | 94.3 | 20.2 | 14,799 |
*Dispensing Pharmacy: Hanshin Dispensing Business etc. On the gross profit line, group gross profit was 321,205 million yen at a 31.8% margin (FY2024: 275,043 million yen, 31.3%). The Dispensing Pharmacy Business contributed 111,749 million yen at a 36.4% margin (FY2024: 80,786 million yen, 36.9%), of which Sugi Pharmacy accounted for 72,240 million yen at 36.7% (FY2024: 65,523 million yen, 37.4%) and Dispensing Pharmacy* for 39,509 million yen at 35.7% (FY2024: 15,262 million yen, 34.7%). Drugstore Business gross profit was 199,559 million yen at a 29.1% margin (FY2024: 185,033 million yen, 28.7%), and Other was 9,895 million yen at a 55.6% margin (FY2024: 9,223 million yen, 62.3%).
Within the Drugstore Business, product-category net sales were as follows.
| Product Segment (Drugstore Business) | FY2025 Net Sales | Composition Ratio (%) | vs. Budget (%) | % Change | FY2024 Net Sales |
|---|---|---|---|---|---|
| Drugstore Business | 685,218 | 100.0 | 98.1 | 6.4 | 644,236 |
| Healthcare | 159,383 | 23.3 | 97.1 | 3.9 | 153,379 |
| Beauty | 157,242 | 22.9 | 97.5 | 7.3 | 146,608 |
| Household Wares | 160,399 | 23.4 | 97.8 | 5.6 | 151,917 |
| Foods | 206,719 | 30.2 | 99.5 | 8.2 | 190,997 |
| Other | 1,473 | 0.2 | 119.6 | 10.4 | 1,334 |
Selling, general and administrative expenses were 272,636 million yen, equal to 27.0% of net sales and 17.3% higher year on year, and came in at 100.6% of budget (+1,636 million yen); the company notes that personnel expenses, taxes and dues and other items exceeded budget. Personnel expenses were 137,078 million yen (13.6% of net sales, up 19.9%), rent expenses 48,990 million yen (up 11.3%), depreciation 17,766 million yen (up 6.5%), taxes and dues 14,026 million yen (up 45.8%), commission expenses 15,410 million yen (up 19.7%), utilities expenses 10,469 million yen (up 8.3%), supplies expenses 6,266 million yen (up 4.5%) and selling expenses 3,043 million yen (down 16.6%).
FY2026 Forecast
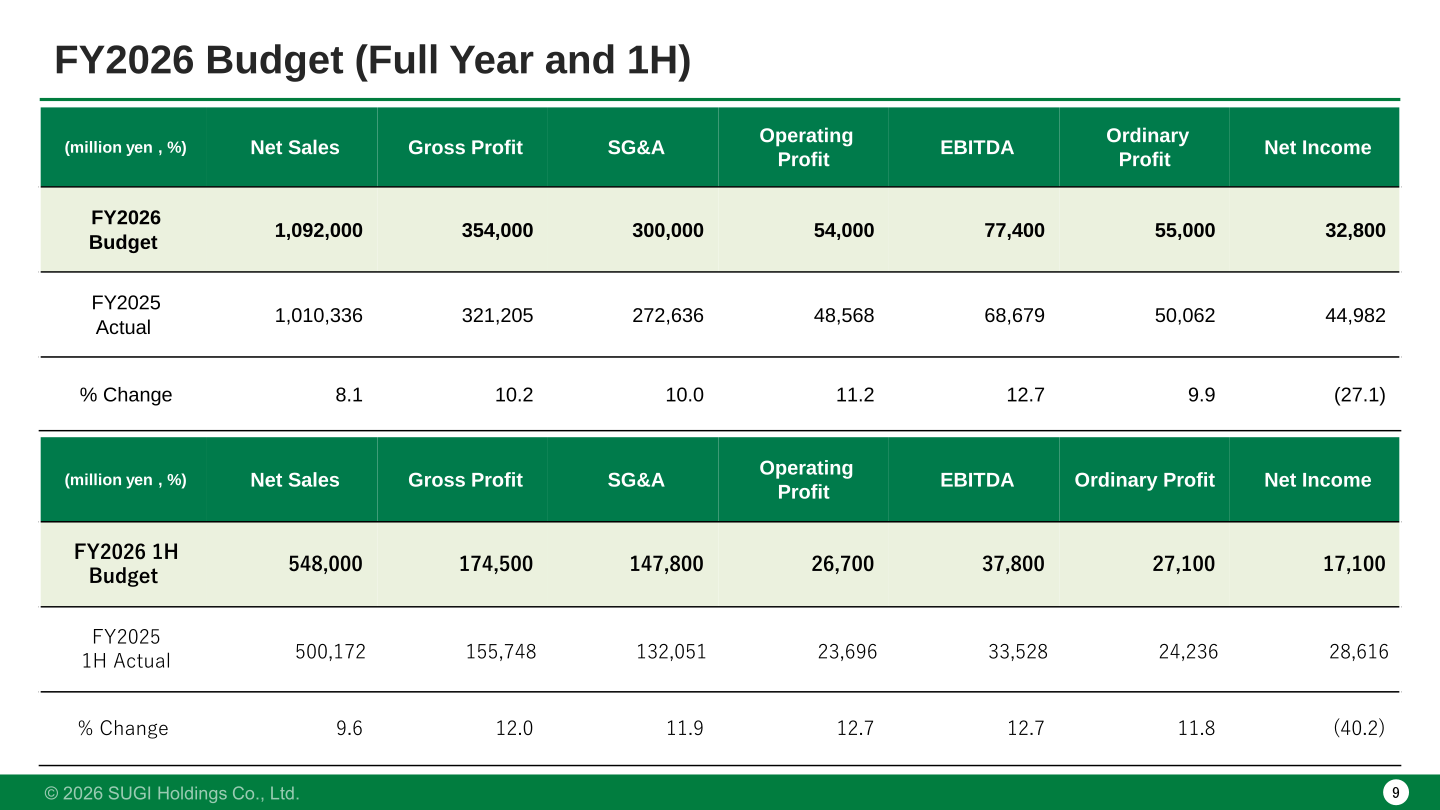
For FY2026 the company budgets further top-line growth alongside a decline in net income.
| Item | FY2026 Budget | FY2025 Actual | % Change |
|---|---|---|---|
| Net Sales | 1,092,000 | 1,010,336 | 8.1 |
| Gross Profit | 354,000 | 321,205 | 10.2 |
| SG&A | 300,000 | 272,636 | 10.0 |
| Operating Profit | 54,000 | 48,568 | 11.2 |
| EBITDA | 77,400 | 68,679 | 12.7 |
| Ordinary Profit | 55,000 | 50,062 | 9.9 |
| Net Income | 32,800 | 44,982 | (27.1) |
For the first half of FY2026 the budget is net sales of 548,000 million yen (up 9.6%), gross profit of 174,500 million yen (up 12.0%), SG&A of 147,800 million yen (up 11.9%), operating profit of 26,700 million yen (up 12.7%), EBITDA of 37,800 million yen (up 12.7%), ordinary profit of 27,100 million yen (up 11.8%) and net income of 17,100 million yen, against FY2025 first-half actuals of 500,172 million yen, 155,748 million yen, 132,051 million yen, 23,696 million yen, 33,528 million yen, 24,236 million yen and 28,616 million yen respectively; the first-half net income comparison is (40.2)%.
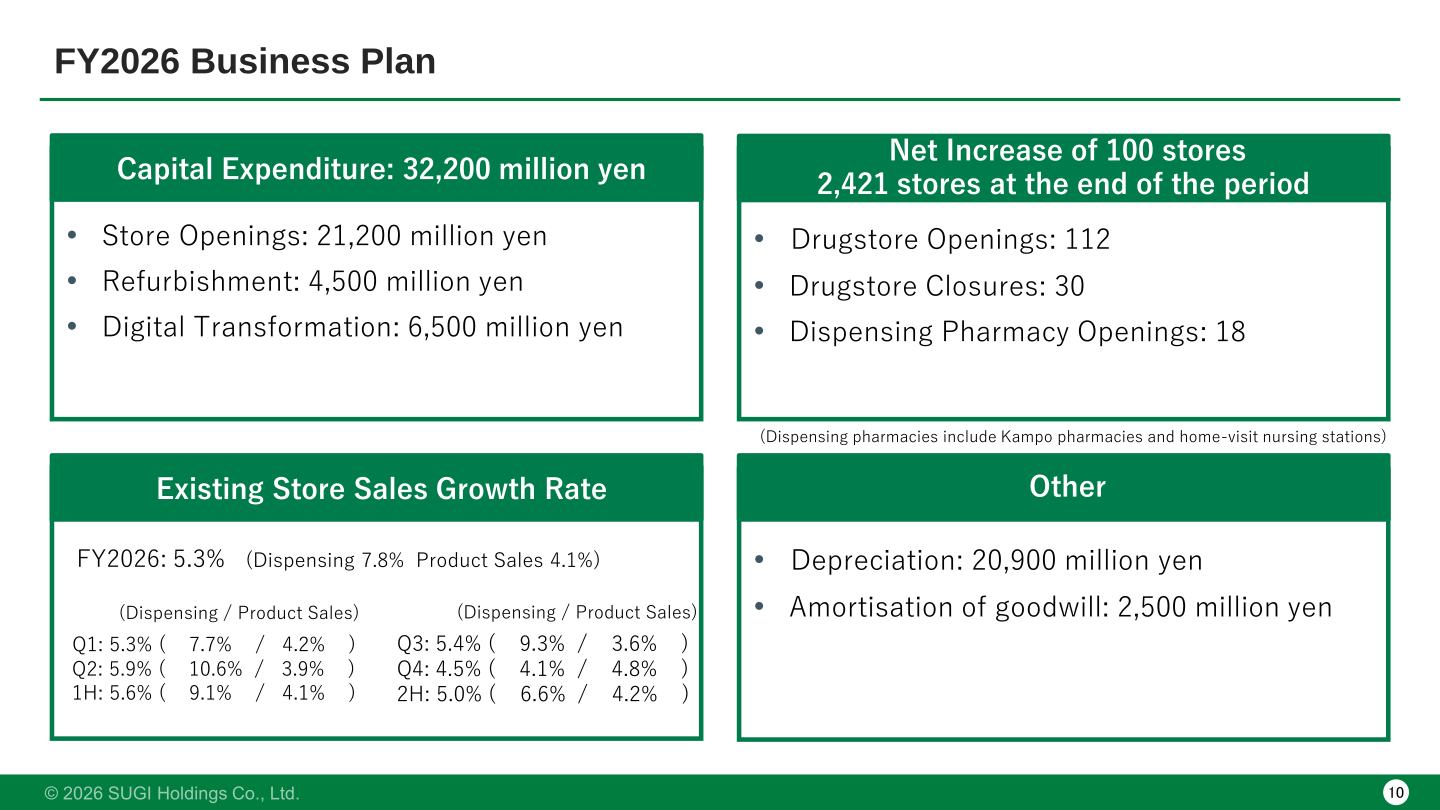
The FY2026 business plan calls for 112 drugstore openings and 30 drugstore closures plus 18 dispensing pharmacy openings, a net increase of 100 stores, taking the group to 2,421 stores at the end of the period (dispensing pharmacies include Kampo pharmacies and home-visit nursing stations). Capital expenditure is planned at 32,200 million yen, comprising 21,200 million yen for store openings, 4,500 million yen for refurbishment and 6,500 million yen for digital transformation. Depreciation is planned at 20,900 million yen and amortisation of goodwill at 2,500 million yen. The planned existing-store sales growth rate for FY2026 is 5.3% (dispensing 7.8%, product sales 4.1%), with 5.6% in the first half (9.1% / 4.1%) and 5.0% in the second half (6.6% / 4.2%).
Shareholder Returns
The FY2025 IR Materials do not include any description of dividends, the payout policy or share buybacks. This cannot be confirmed from the materials.
Margin Trends
The presentation shows the group gross profit margin rising from 30.3% in FY2022 to 30.7% in FY2023, 31.3% in FY2024 and 31.8% in FY2025, while the SG&A ratio moved from 25.6% to 25.8%, 26.5% and 27.0% over the same years. The gross profit margin for the Dispensing Pharmacy Business declined from 38.6% in FY2022 to 37.9%, 36.9% and 36.4%, whereas the Drugstore Business margin improved from 27.5% to 28.3%, 28.7% and 29.1%. On the profit side, the operating profit margin was 4.7%, 4.9%, 4.8% and 4.8%, the ordinary profit margin 4.9%, 5.1%, 4.8% and 5.0%, the net income margin 2.9%, 2.9%, 3.0% and 4.5%, and EBITDA 6.6%, 6.8%, 6.9% and 6.8%.
This article is an analysis based on publicly available information and is not a recommendation to buy or sell any specific securities. Investment decisions are your own responsibility.
![[Obayashi] Investors’ Guide 2026 — The Complete 24-Article Breakdown](https://japan-equity.com/wp-content/uploads/2026/07/hub_cover-1024x1024.png)
![[Obayashi] IR & SR Policy — Feeding Dialogue Back into Management](https://japan-equity.com/wp-content/uploads/2026/07/p32_sq-1024x1024.jpg)
![[Obayashi] Real Estate Development — 18.7% Margin, ¥287.7bn Unrealized Gains](https://japan-equity.com/wp-content/uploads/2026/07/p20_sq-1024x1024.jpg)
![[Obayashi] Domestic Civil Engineering — Resilience Spending Supports 9.6% Margin](https://japan-equity.com/wp-content/uploads/2026/07/p11_sq-1024x1024.jpg)
![[Obayashi] Share Price & External Ratings — vs TOPIX, ESG Index Inclusion](https://japan-equity.com/wp-content/uploads/2026/07/p40_sq-1024x1024.jpg)
![[Construction] ¥75.5tn Investment, Shrinking Workforce — Big-5 Market Share](https://japan-equity.com/wp-content/uploads/2026/07/p12_sq-1024x1024.jpg)



![[Obayashi] Capital Policy & Shareholder Returns — ROE 10%+, DOE ~5%, ¥100bn Buyback](https://japan-equity.com/wp-content/uploads/2026/07/p27_sq-1024x1024.jpg)
![[Obayashi] Reducing Cross-Shareholdings — ¥285.2bn Sold in Five Years](https://japan-equity.com/wp-content/uploads/2026/07/p29_sq-1024x1024.jpg)
![[Obayashi] ¥750bn Investment Plan — ¥300bn to Development, ¥190bn to Tech/DX](https://japan-equity.com/wp-content/uploads/2026/07/p30_sq-1024x1024.jpg)
![[Obayashi] MTP2022 KPIs — Operating Profit ~2x Target, ROE 14.4%](https://japan-equity.com/wp-content/uploads/2026/07/p25_sq-1024x1024.jpg)
![[Obayashi] Cash Allocation — ¥420bn Investment CF Over Five Years](https://japan-equity.com/wp-content/uploads/2026/07/p26_sq-1024x1024.jpg)
![[Obayashi] Green Energy — 44 Plants, 344MW, and the Green Hydrogen Challenge](https://japan-equity.com/wp-content/uploads/2026/07/p21_sq-1024x1024.jpg)
![[Obayashi] Tackling the Labor Shortage — Robotics Construction®](https://japan-equity.com/wp-content/uploads/2026/07/p14_sq-1024x1024.jpg)
