
This article is based on publicly available IR materials and is not a recommendation to buy or sell any specific securities.
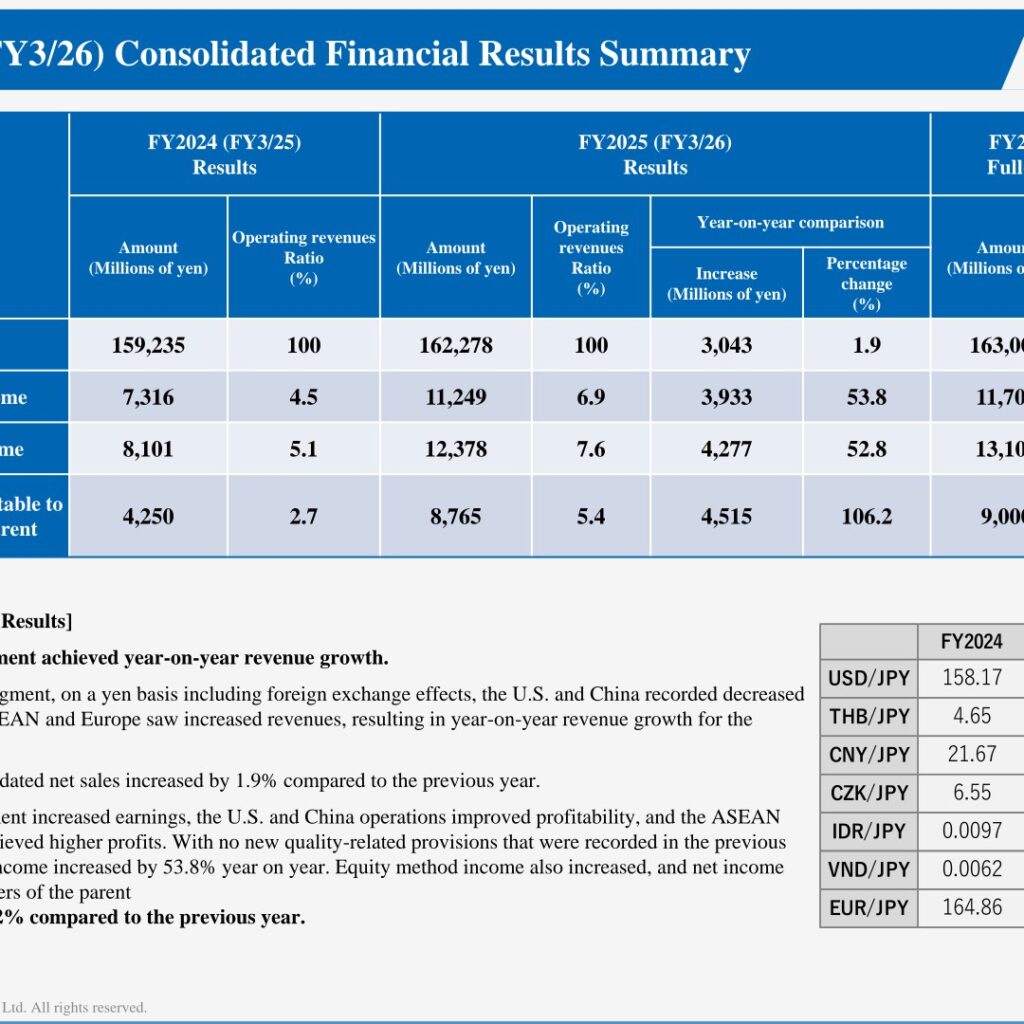
T.RAD Co., Ltd. reported consolidated net sales of 162,278 millions of yen for FY2025 (FY3/26), an increase of 3,043 millions of yen or 1.9% year on year. Operating income rose 53.8% to 11,249 millions of yen, ordinary income rose 52.8% to 12,378 millions of yen, and net income attributable to owners of the parent rose 106.2% to 8,765 millions of yen. The materials attribute the earnings improvement to higher domestic earnings, improved profitability in the U.S. and China operations, higher profits in the ASEAN operations, and the absence of the quality-related provisions recorded in the previous period. For FY2026 (FY3/27) the company forecasts net sales of 163,000 millions of yen and operating income of 11,700 millions of yen.
Consolidated Results (Full-Year Actual)
The domestic segment achieved year-on-year revenue growth. For the overseas segment, on a yen basis including foreign exchange effects, the U.S. and China recorded decreased revenues while ASEAN and Europe saw increased revenues, resulting in year-on-year revenue growth for the segment overall. As a result, consolidated net sales increased by 1.9% compared to the previous year. The operating revenues ratio for operating income improved from 4.5% to 6.9%, and equity method income also increased. The exchange rates used in the materials were USD/JPY 158.17 for FY2024, 156.54 for FY2025 and 158.5 for FY2026, and EUR/JPY 164.86, 184.26 and 183.49 respectively.
| Item (Millions of yen) | FY2024 (FY3/25) Results | FY2025 (FY3/26) Results | Increase | Percentage change (%) | FY2026 (FY3/27) Full-year forecast |
|---|---|---|---|---|---|
| Net Sales | 159,235 | 162,278 | 3,043 | 1.9 | 163,000 |
| Operating Income | 7,316 | 11,249 | 3,933 | 53.8 | 11,700 |
| Ordinary Income | 8,101 | 12,378 | 4,277 | 52.8 | 13,100 |
| Net income attributable to owners of the parent | 4,250 | 8,765 | 4,515 | 106.2 | 9,000 |
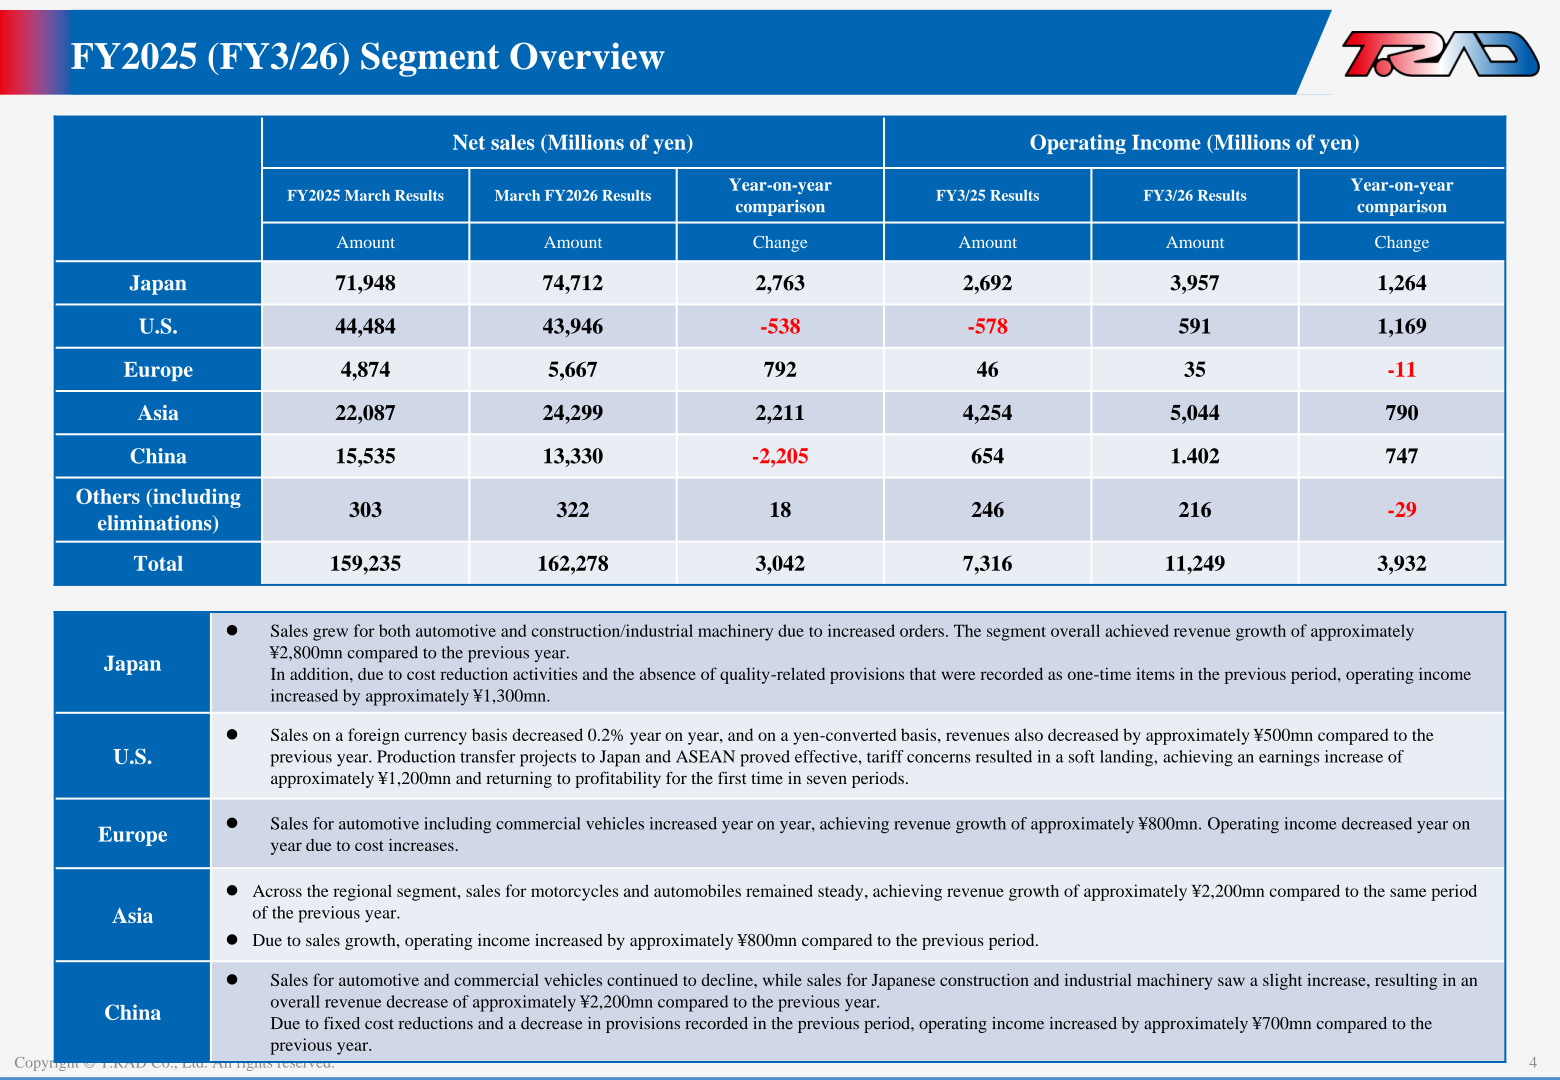
Segment Results
In Japan, sales grew for both automotive and construction/industrial machinery due to increased orders, and the segment overall achieved revenue growth of approximately 2,800mn yen compared to the previous year; cost reduction activities and the absence of quality-related provisions recorded as one-time items in the previous period lifted operating income by approximately 1,300mn yen. In the U.S., sales on a foreign currency basis decreased 0.2% year on year and revenues on a yen-converted basis decreased by approximately 500mn yen, but production transfer projects to Japan and ASEAN proved effective and tariff concerns resulted in a soft landing, achieving an earnings increase of approximately 1,200mn yen and returning to profitability for the first time in seven periods. In Europe, sales for automotive including commercial vehicles increased year on year for revenue growth of approximately 800mn yen, while operating income decreased due to cost increases. In Asia, sales for motorcycles and automobiles remained steady for revenue growth of approximately 2,200mn yen and operating income growth of approximately 800mn yen. In China, sales for automotive and commercial vehicles continued to decline while sales for Japanese construction and industrial machinery saw a slight increase, giving an overall revenue decrease of approximately 2,200mn yen; fixed cost reductions and a decrease in provisions recorded in the previous period raised operating income by approximately 700mn yen.
| Segment (Millions of yen) | Net sales FY3/25 | Net sales FY3/26 | Change | Operating Income FY3/25 | Operating Income FY3/26 | Change |
|---|---|---|---|---|---|---|
| Japan | 71,948 | 74,712 | 2,763 | 2,692 | 3,957 | 1,264 |
| U.S. | 44,484 | 43,946 | -538 | -578 | 591 | 1,169 |
| Europe | 4,874 | 5,667 | 792 | 46 | 35 | -11 |
| Asia | 22,087 | 24,299 | 2,211 | 4,254 | 5,044 | 790 |
| China | 15,535 | 13,330 | -2,205 | 654 | 1.402 | 747 |
| Others (including eliminations) | 303 | 322 | 18 | 246 | 216 | -29 |
| Total | 159,235 | 162,278 | 3,042 | 7,316 | 11,249 | 3,932 |
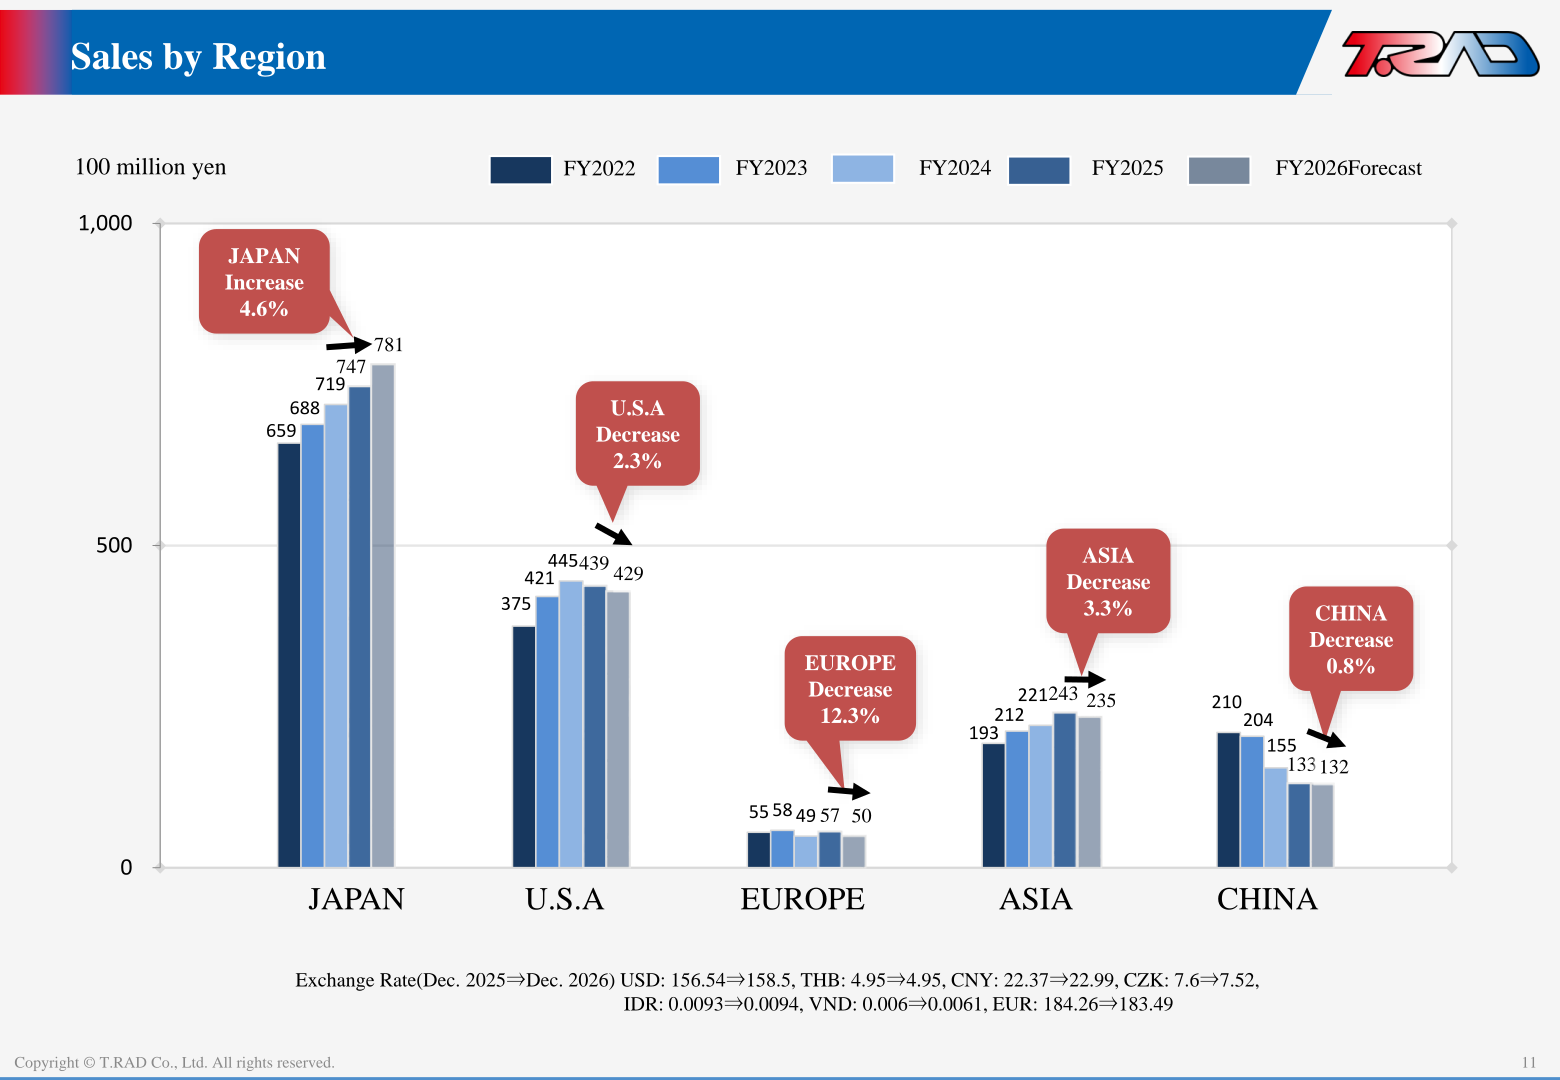
On the Sales by Region chart, stated in 100 million yen, FY2025 sales were 747 in Japan, 439 in the U.S.A, 57 in Europe, 243 in Asia and 133 in China. The FY2026 forecast shows Japan increasing 4.6% to 781, the U.S.A decreasing 2.3% to 429, Europe decreasing 12.3% to 50, Asia decreasing 3.3% to 235 and China decreasing 0.8% to 132. Consolidated net sales of 1,623 in FY2025 comprised Japan 747 and Overseas and Others 876; for the FY2026 forecast of 1,630 the materials show a mix of 47.9% for Japan and 52.1% for Overseas and Others.
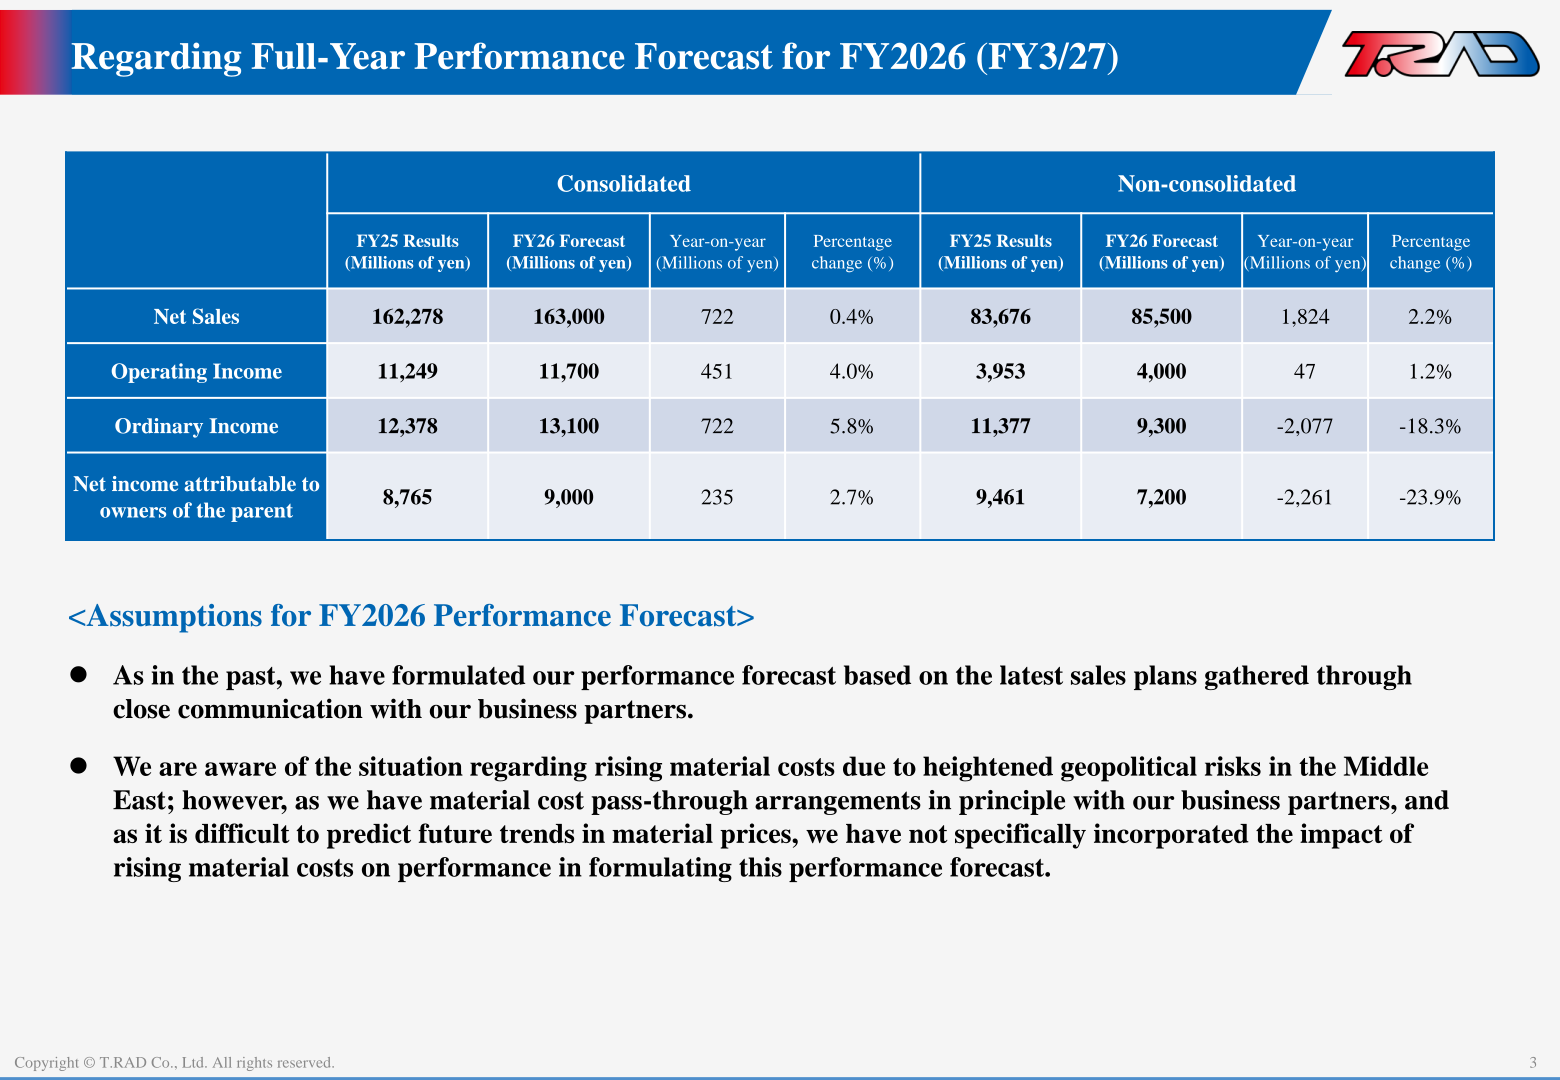
FY2026 Forecast
For FY2026 (FY3/27) the company forecasts consolidated net sales of 163,000 millions of yen (up 722, or 0.4%), operating income of 11,700 millions of yen (up 451, or 4.0%), ordinary income of 13,100 millions of yen (up 722, or 5.8%) and net income attributable to owners of the parent of 9,000 millions of yen (up 235, or 2.7%). On a non-consolidated basis, net sales are forecast at 85,500 millions of yen (up 2.2%) and operating income at 4,000 millions of yen (up 1.2%), while ordinary income is forecast to fall 18.3% to 9,300 millions of yen and net income to fall 23.9% to 7,200 millions of yen. Consolidated ROE is shown at 17.2% for FY2025 and 16.3% for the FY2026 forecast. The materials state that the forecast was formulated based on the latest sales plans gathered through close communication with business partners, and that because material cost pass-through arrangements are in place in principle and future material price trends are difficult to predict, the impact of rising material costs due to heightened geopolitical risks in the Middle East has not been specifically incorporated.
| Item (Millions of yen, consolidated) | FY25 Results | FY26 Forecast | Year-on-year | Percentage change (%) |
|---|---|---|---|---|
| Net Sales | 162,278 | 163,000 | 722 | 0.4% |
| Operating Income | 11,249 | 11,700 | 451 | 4.0% |
| Ordinary Income | 12,378 | 13,100 | 722 | 5.8% |
| Net income attributable to owners of the parent | 8,765 | 9,000 | 235 | 2.7% |
Cash Flow and Capital Expenditure
Cash and cash equivalents were 15,698 millions of yen as on March 31, 2025 and 15,560 millions of yen as on March 31, 2026. Operating activities provided 12,558 millions of yen, with income before tax of 12,604 and depreciation of 5,650 partly offset by notes and accounts payable-trade of -3,685 and income taxes paid of -2,810. Investing activities used 7,204 millions of yen, including purchase of tangible fixed assets of -7,244 and sales of investment securities of 464. Within financing activities and other, purchase of treasury stock was -4,293, dividend payments were -1,896, long-term loans payable were 2,840 and short-term loans payable were -2,011. Capital expenditure rose from 5,286 millions of yen in FY3/2025 to 7,650 millions of yen in FY3/2026 (up 2,364), while depreciation was 5,650 millions of yen against 5,655 in the prior year. Non-operating income for FY3/2026 included equity in earnings of affiliates of 665 and interest and dividend income of 280.
Shareholder Returns
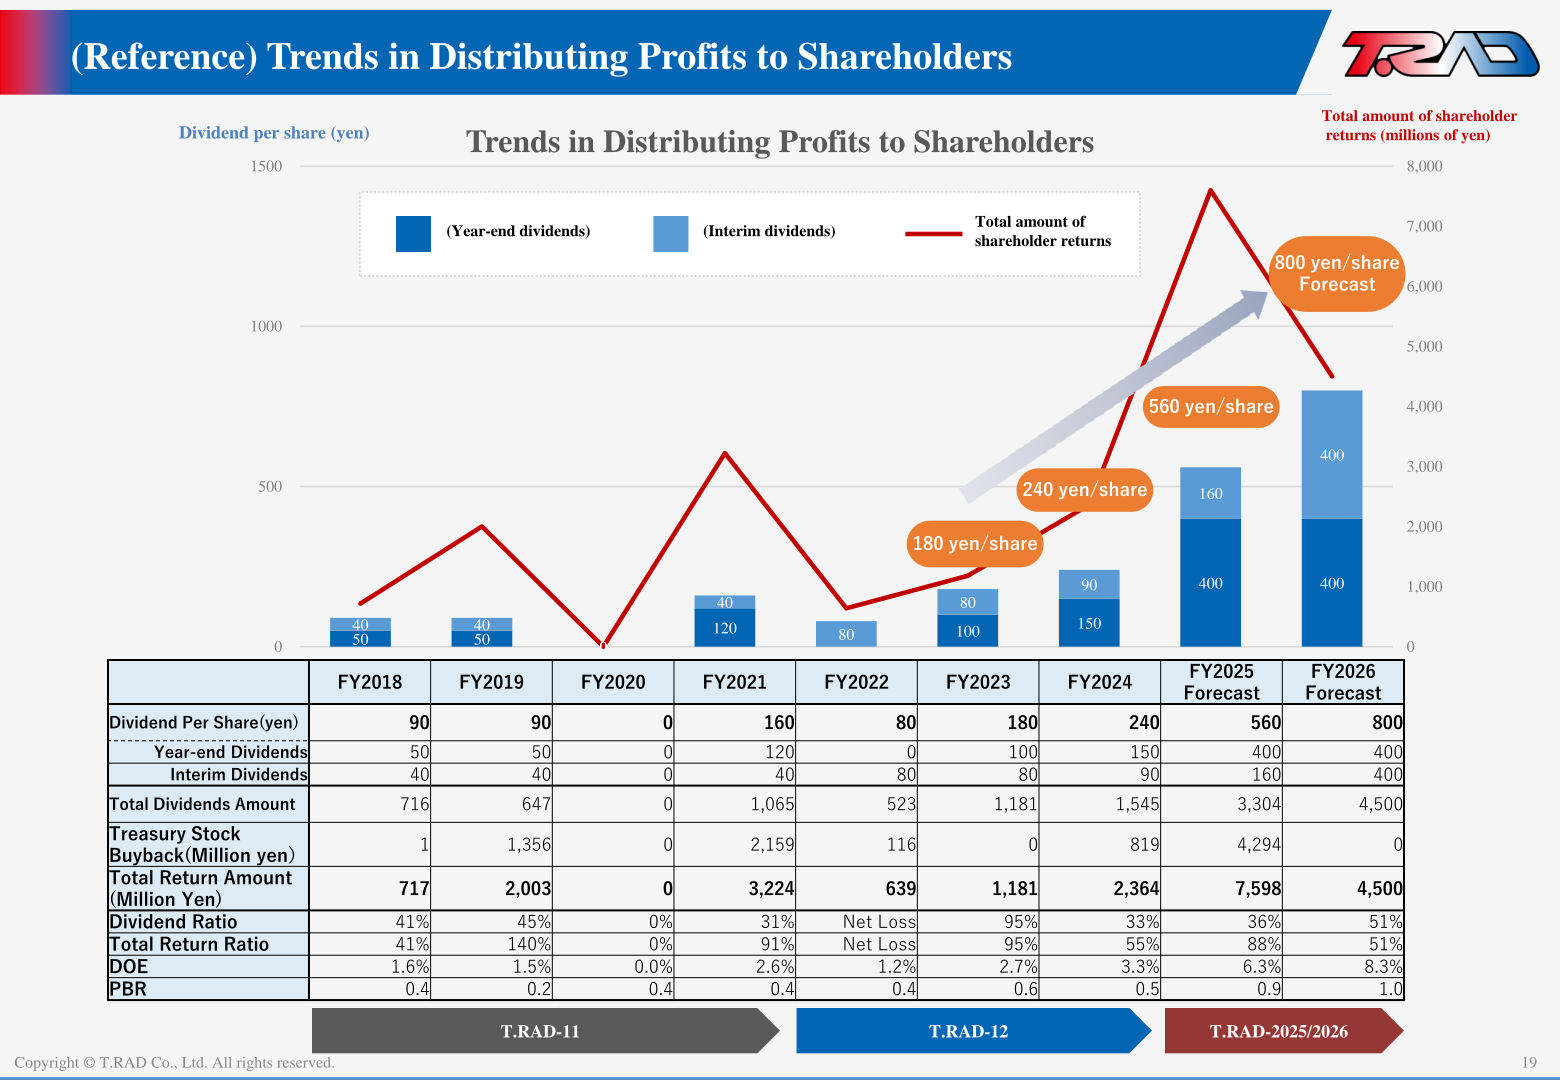
The reference page on trends in distributing profits to shareholders shows a dividend per share of 560 yen for FY2025 (year-end 400 yen and interim 160 yen), against 240 yen for FY2024, and a forecast of 800 yen for FY2026 (year-end 400 yen and interim 400 yen). Total dividends amount was 3,304 millions of yen for FY2025 and treasury stock buyback was 4,294 millions of yen, giving a total return amount of 7,598 millions of yen, a dividend ratio of 36% and a total return ratio of 88%. For FY2026 the materials show total dividends of 4,500 millions of yen, no treasury stock buyback, and a dividend ratio and total return ratio of 51%. DOE is shown at 6.3% for FY2025 and 8.3% for FY2026, and PBR at 0.9 and 1.0 respectively.
| Item | FY2024 | FY2025 Forecast | FY2026 Forecast |
|---|---|---|---|
| Dividend Per Share (yen) | 240 | 560 | 800 |
| Year-end Dividends | 150 | 400 | 400 |
| Interim Dividends | 90 | 160 | 400 |
| Total Dividends Amount | 1,545 | 3,304 | 4,500 |
| Treasury Stock Buyback (Million yen) | 819 | 4,294 | 0 |
| Total Return Amount (Million Yen) | 2,364 | 7,598 | 4,500 |
| Dividend Ratio | 33% | 36% | 51% |
| Total Return Ratio | 55% | 88% | 51% |
| DOE | 3.3% | 6.3% | 8.3% |
| PBR | 0.5 | 0.9 | 1.0 |
This article is an analysis based on publicly available information and is not a recommendation to buy or sell any specific securities. Investment decisions are your own responsibility.
![[Obayashi] Investors’ Guide 2026 — The Complete 24-Article Breakdown](https://japan-equity.com/wp-content/uploads/2026/07/hub_cover-1024x1024.png)
![[Obayashi] IR & SR Policy — Feeding Dialogue Back into Management](https://japan-equity.com/wp-content/uploads/2026/07/p32_sq-1024x1024.jpg)
![[Obayashi] Domestic Civil Engineering — Resilience Spending Supports 9.6% Margin](https://japan-equity.com/wp-content/uploads/2026/07/p11_sq-1024x1024.jpg)
![[Obayashi] Overseas Construction — Orders Reach ¥1.2tn](https://japan-equity.com/wp-content/uploads/2026/07/p15_sq-1024x1024.jpg)
![[Obayashi] Share Price & External Ratings — vs TOPIX, ESG Index Inclusion](https://japan-equity.com/wp-content/uploads/2026/07/p40_sq-1024x1024.jpg)
![[Construction] ¥75.5tn Investment, Shrinking Workforce — Big-5 Market Share](https://japan-equity.com/wp-content/uploads/2026/07/p12_sq-1024x1024.jpg)



![[Obayashi] Capital Policy & Shareholder Returns — ROE 10%+, DOE ~5%, ¥100bn Buyback](https://japan-equity.com/wp-content/uploads/2026/07/p27_sq-1024x1024.jpg)
![[Obayashi] Reducing Cross-Shareholdings — ¥285.2bn Sold in Five Years](https://japan-equity.com/wp-content/uploads/2026/07/p29_sq-1024x1024.jpg)
![[Obayashi] ¥750bn Investment Plan — ¥300bn to Development, ¥190bn to Tech/DX](https://japan-equity.com/wp-content/uploads/2026/07/p30_sq-1024x1024.jpg)
![[Obayashi] MTP2022 KPIs — Operating Profit ~2x Target, ROE 14.4%](https://japan-equity.com/wp-content/uploads/2026/07/p25_sq-1024x1024.jpg)
![[Obayashi] Cash Allocation — ¥420bn Investment CF Over Five Years](https://japan-equity.com/wp-content/uploads/2026/07/p26_sq-1024x1024.jpg)
![[Obayashi] Green Energy — 44 Plants, 344MW, and the Green Hydrogen Challenge](https://japan-equity.com/wp-content/uploads/2026/07/p21_sq-1024x1024.jpg)
![[Obayashi] Tackling the Labor Shortage — Robotics Construction®](https://japan-equity.com/wp-content/uploads/2026/07/p14_sq-1024x1024.jpg)
