
This article is based on publicly available IR materials and is not a recommendation to buy or sell any specific securities.
Note: Hirose Tusyo Inc. publishes neither an English results presentation nor an English financial results release; this article is a factual summary of its Japanese-language earnings report. The company labels the period covered here as the fiscal year ended March 31, 2026. The earnings report states that no supplementary results material was prepared and no results briefing was held.
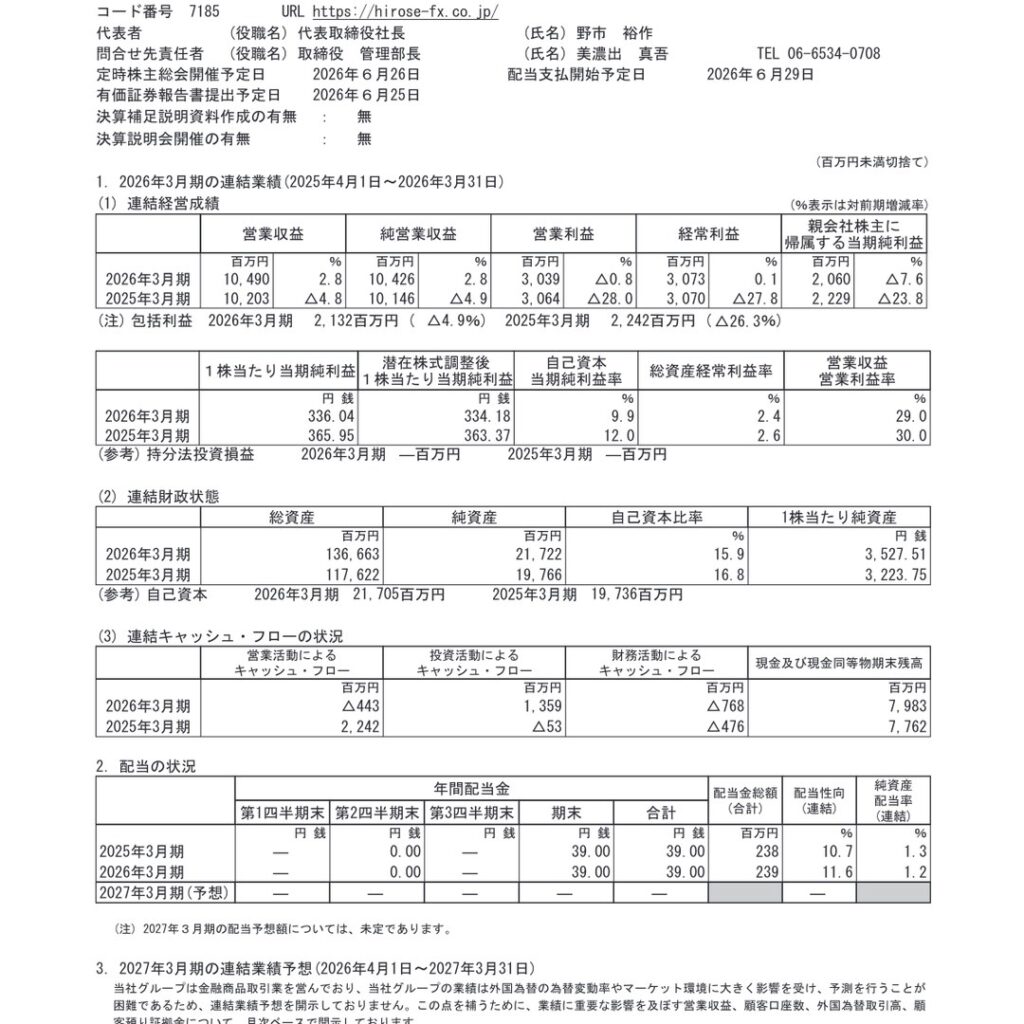
Hirose Tusyo Inc. (7185), which operates the LION FX foreign exchange margin trading service, reported operating revenue of ¥10,490 million for the fiscal year ended March 31, 2026, up 2.8% year on year. Operating profit edged down 0.8% to ¥3,039 million, ordinary profit was almost unchanged at ¥3,073 million (up 0.1%), and profit attributable to owners of parent declined 7.6% to ¥2,060 million. Annual foreign exchange trading volume rose 8.4%, while the number of customer accounts fell after the company terminated several overseas trading services.
Consolidated Results (Full-Year Actual)
The company notes that in the financial instruments markets relevant to its business, the yen strengthened at one point to the ¥139 level against the US dollar amid the announcement of US reciprocal tariffs and concerns over US-China trade friction, before moving on a weaker-yen trend on progress in US-China tariff negotiations, concerns over Japanese fiscal expansion and safe-haven dollar buying tied to the deteriorating situation in the Middle East, ending the period at the ¥158 level. Against this backdrop the company reduced the Turkish lira/yen spread in April 2025, ran campaigns including a pure gold giveaway on LION CFD and expanded food giveaways on LION FX, and added functions such as real-time volatility and in-house position-ratio display on LION Chart Plus+ and a swap simulation function on LION FX C2. Selling, general and administrative expenses rose to ¥7,386,255 thousand from ¥7,081,232 thousand.
| Item | FY ended Mar 2026 | FY ended Mar 2025 | Change |
|---|---|---|---|
| Operating revenue (¥ million) | 10,490 | 10,203 | +2.8% |
| Net operating revenue (¥ million) | 10,426 | 10,146 | +2.8% |
| Operating profit (¥ million) | 3,039 | 3,064 | -0.8% |
| Ordinary profit (¥ million) | 3,073 | 3,070 | +0.1% |
| Profit attributable to owners of parent (¥ million) | 2,060 | 2,229 | -7.6% |
| Comprehensive income (¥ million) | 2,132 | 2,242 | -4.9% |
| Earnings per share (¥) | 336.04 | 365.95 | — |
| Diluted earnings per share (¥) | 334.18 | 363.37 | — |
| Return on equity (%) | 9.9 | 12.0 | — |
| Operating profit to operating revenue ratio (%) | 29.0 | 30.0 | — |
Key Operating Indicators
Customer accounts decreased because of the termination of the LION Trader service at HIROSE FINANCIAL UK LTD. and Hirose Financial MY Limited and of the MT4 service at HIROSE FINANCIAL UK LTD., Hirose Financial MY Limited and Hirose Solutions Limited. The company states that the impact of these service terminations on consolidated results was immaterial. Disclosure of customer accounts, margin deposits and trading volume for CFD is omitted because these are currently small relative to the foreign exchange figures.
| Indicator | FY ended Mar 2026 | Change |
|---|---|---|
| Customer accounts | 450,713 | -18.9% |
| Foreign exchange customer margin deposits (¥ thousand) | 88,359,873 | +14.4% |
| Annual foreign exchange trading volume | 12.2214 trillion currency units | +8.4% |
Segment Results
Segment information is omitted. The company states that its business segment is principally the financial instruments business and that other business segments are not material. During the period, LION PAYMENT UK LTD. was excluded from the scope of consolidation.
Financial Position and Cash Flows
Total assets increased by ¥19,040,741 thousand, mainly on a ¥15,979,000 thousand increase in customer segregated trust and a ¥2,741,538 thousand increase in foreign exchange margin deposits placed. Liabilities rose by ¥17,085,120 thousand, mainly on an ¥11,152,283 thousand increase in foreign exchange customer margin deposits received. Operating cash flow turned negative, reflecting a ¥16,373,210 thousand outflow from the increase in deposits paid.
| Item | FY ended Mar 2026 | FY ended Mar 2025 |
|---|---|---|
| Total assets (¥ million) | 136,663 | 117,622 |
| Net assets (¥ million) | 21,722 | 19,766 |
| Equity ratio (%) | 15.9 | 16.8 |
| Net assets per share (¥) | 3,527.51 | 3,223.75 |
| Cash flow from operating activities (¥ million) | -443 | 2,242 |
| Cash flow from investing activities (¥ million) | 1,359 | -53 |
| Cash flow from financing activities (¥ million) | -768 | -476 |
| Cash and cash equivalents at end of period (¥ million) | 7,983 | 7,762 |
FY2026 Forecast
The company does not disclose a consolidated earnings forecast for the fiscal year ending March 31, 2027. It explains that, as a financial instruments business operator, its results are heavily affected by foreign exchange volatility and market conditions, making forecasting difficult. To compensate, it discloses operating revenue, customer account numbers, foreign exchange trading volume and customer margin deposits on a monthly basis.
Shareholder Returns
The company’s basic policy is to pay a single year-end dividend, decided by the general meeting of shareholders, balancing returns in line with results against internal reserves for business development and strengthening the financial base. The year-end dividend for the fiscal year ended March 31, 2026 is ¥39.00 per share. The dividend forecast for the fiscal year ending March 31, 2027 is undecided. During the period the company also paid ¥258,664 thousand for the purchase of treasury shares; treasury shares at period-end totalled 730,269 shares against 6,883,500 shares issued.
| Item | FY ended Mar 2026 | FY ended Mar 2025 |
|---|---|---|
| Year-end dividend per share (¥) | 39.00 | 39.00 |
| Annual dividend per share (¥) | 39.00 | 39.00 |
| Total dividends (¥ million) | 239 | 238 |
| Payout ratio (consolidated, %) | 11.6 | 10.7 |
| Dividend on net assets (consolidated, %) | 1.2 | 1.3 |
This article is an analysis based on publicly available information and is not a recommendation to buy or sell any specific securities. Investment decisions are your own responsibility.
![[Obayashi] Investors’ Guide 2026 — The Complete 24-Article Breakdown](https://japan-equity.com/wp-content/uploads/2026/07/hub_cover-1024x1024.png)
![[Obayashi] IR & SR Policy — Feeding Dialogue Back into Management](https://japan-equity.com/wp-content/uploads/2026/07/p32_sq-1024x1024.jpg)
![[Obayashi] Real Estate Development — 18.7% Margin, ¥287.7bn Unrealized Gains](https://japan-equity.com/wp-content/uploads/2026/07/p20_sq-1024x1024.jpg)
![[Obayashi] Domestic Civil Engineering — Resilience Spending Supports 9.6% Margin](https://japan-equity.com/wp-content/uploads/2026/07/p11_sq-1024x1024.jpg)
![[Obayashi] Share Price & External Ratings — vs TOPIX, ESG Index Inclusion](https://japan-equity.com/wp-content/uploads/2026/07/p40_sq-1024x1024.jpg)
![[Construction] ¥75.5tn Investment, Shrinking Workforce — Big-5 Market Share](https://japan-equity.com/wp-content/uploads/2026/07/p12_sq-1024x1024.jpg)



![[Obayashi] Capital Policy & Shareholder Returns — ROE 10%+, DOE ~5%, ¥100bn Buyback](https://japan-equity.com/wp-content/uploads/2026/07/p27_sq-1024x1024.jpg)
![[Obayashi] Reducing Cross-Shareholdings — ¥285.2bn Sold in Five Years](https://japan-equity.com/wp-content/uploads/2026/07/p29_sq-1024x1024.jpg)
![[Obayashi] ¥750bn Investment Plan — ¥300bn to Development, ¥190bn to Tech/DX](https://japan-equity.com/wp-content/uploads/2026/07/p30_sq-1024x1024.jpg)
![[Obayashi] MTP2022 KPIs — Operating Profit ~2x Target, ROE 14.4%](https://japan-equity.com/wp-content/uploads/2026/07/p25_sq-1024x1024.jpg)
![[Obayashi] Cash Allocation — ¥420bn Investment CF Over Five Years](https://japan-equity.com/wp-content/uploads/2026/07/p26_sq-1024x1024.jpg)
![[Obayashi] Green Energy — 44 Plants, 344MW, and the Green Hydrogen Challenge](https://japan-equity.com/wp-content/uploads/2026/07/p21_sq-1024x1024.jpg)
![[Obayashi] Tackling the Labor Shortage — Robotics Construction®](https://japan-equity.com/wp-content/uploads/2026/07/p14_sq-1024x1024.jpg)
