
This article is based on publicly available IR materials and is not a recommendation to buy or sell any specific securities.
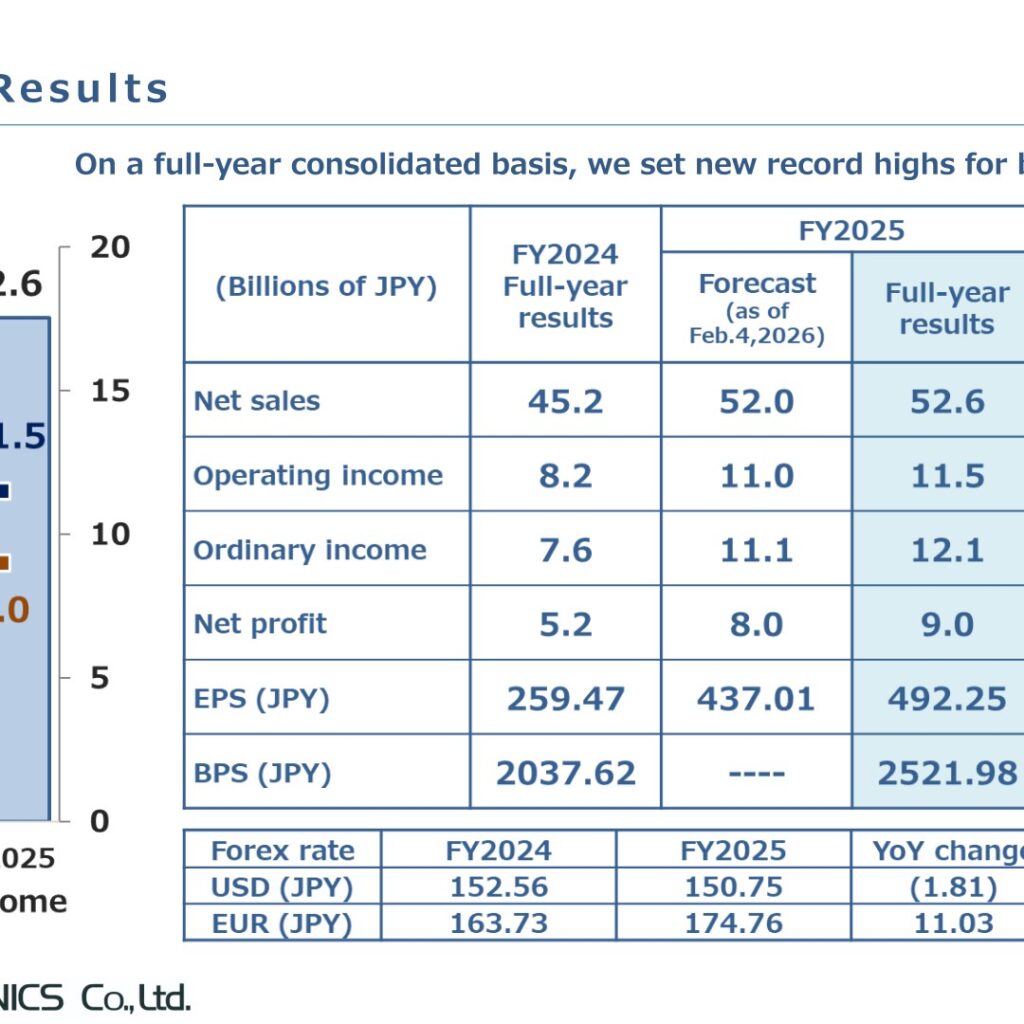
Yamaichi Electronics Co., Ltd. (6941) released its financial results presentation for FY2025 (April 2025 – March 2026, the fiscal year ended March 31, 2026) on May 13, 2026. On a full-year consolidated basis, the company set new record highs for both net sales and profit. Net sales came to JPY52.6 billion (up 16.3% year on year), operating income to JPY11.5 billion (up 40.5%), and net profit to JPY9.0 billion (up 73.1%).
Consolidated Results (Full-Year Actual)
Net sales of JPY52.6 billion, operating income of JPY11.5 billion, ordinary income of JPY12.1 billion, and net profit of JPY9.0 billion all exceeded the forecast announced on February 4, 2026. EPS was JPY492.25 and BPS was JPY2521.98.
| (Billions of JPY) | FY2024 Full-year results | FY2025 Forecast (as of Feb.4, 2026) | FY2025 Full-year results | YoY change (amount) | YoY change (%) |
|---|---|---|---|---|---|
| Net sales | 45.2 | 52.0 | 52.6 | 7.3 | 16.3% |
| Operating income | 8.2 | 11.0 | 11.5 | 3.3 | 40.5% |
| Ordinary income | 7.6 | 11.1 | 12.1 | 4.4 | 57.7% |
| Net profit | 5.2 | 8.0 | 9.0 | 3.8 | 73.1% |
| EPS (JPY) | 259.47 | 437.01 | 492.25 | 232.78 | —- |
| BPS (JPY) | 2037.62 | —- | 2521.98 | 484.36 | —- |
The year-on-year forex impact was JPY 0.23 billion on net sales and JPY -0.17 billion on operating income. The average USD rate moved from JPY152.56 in FY2024 to JPY150.75 in FY2025 (a change of (1.81)), while the EUR rate moved from JPY163.73 to JPY174.76 (+11.03). On the balance sheet, total assets stood at JPY63.2 billion at the end of March 2026 (up 9.8 from a year earlier) and total net assets at JPY46.7 billion. Cash flows from operating activities were JPY10.0 billion, cash flows from investing activities were (3.4), and free cash flows were JPY6.5 billion, with cash and cash equivalents at the end of the period of JPY17.2 billion.
Segment Results
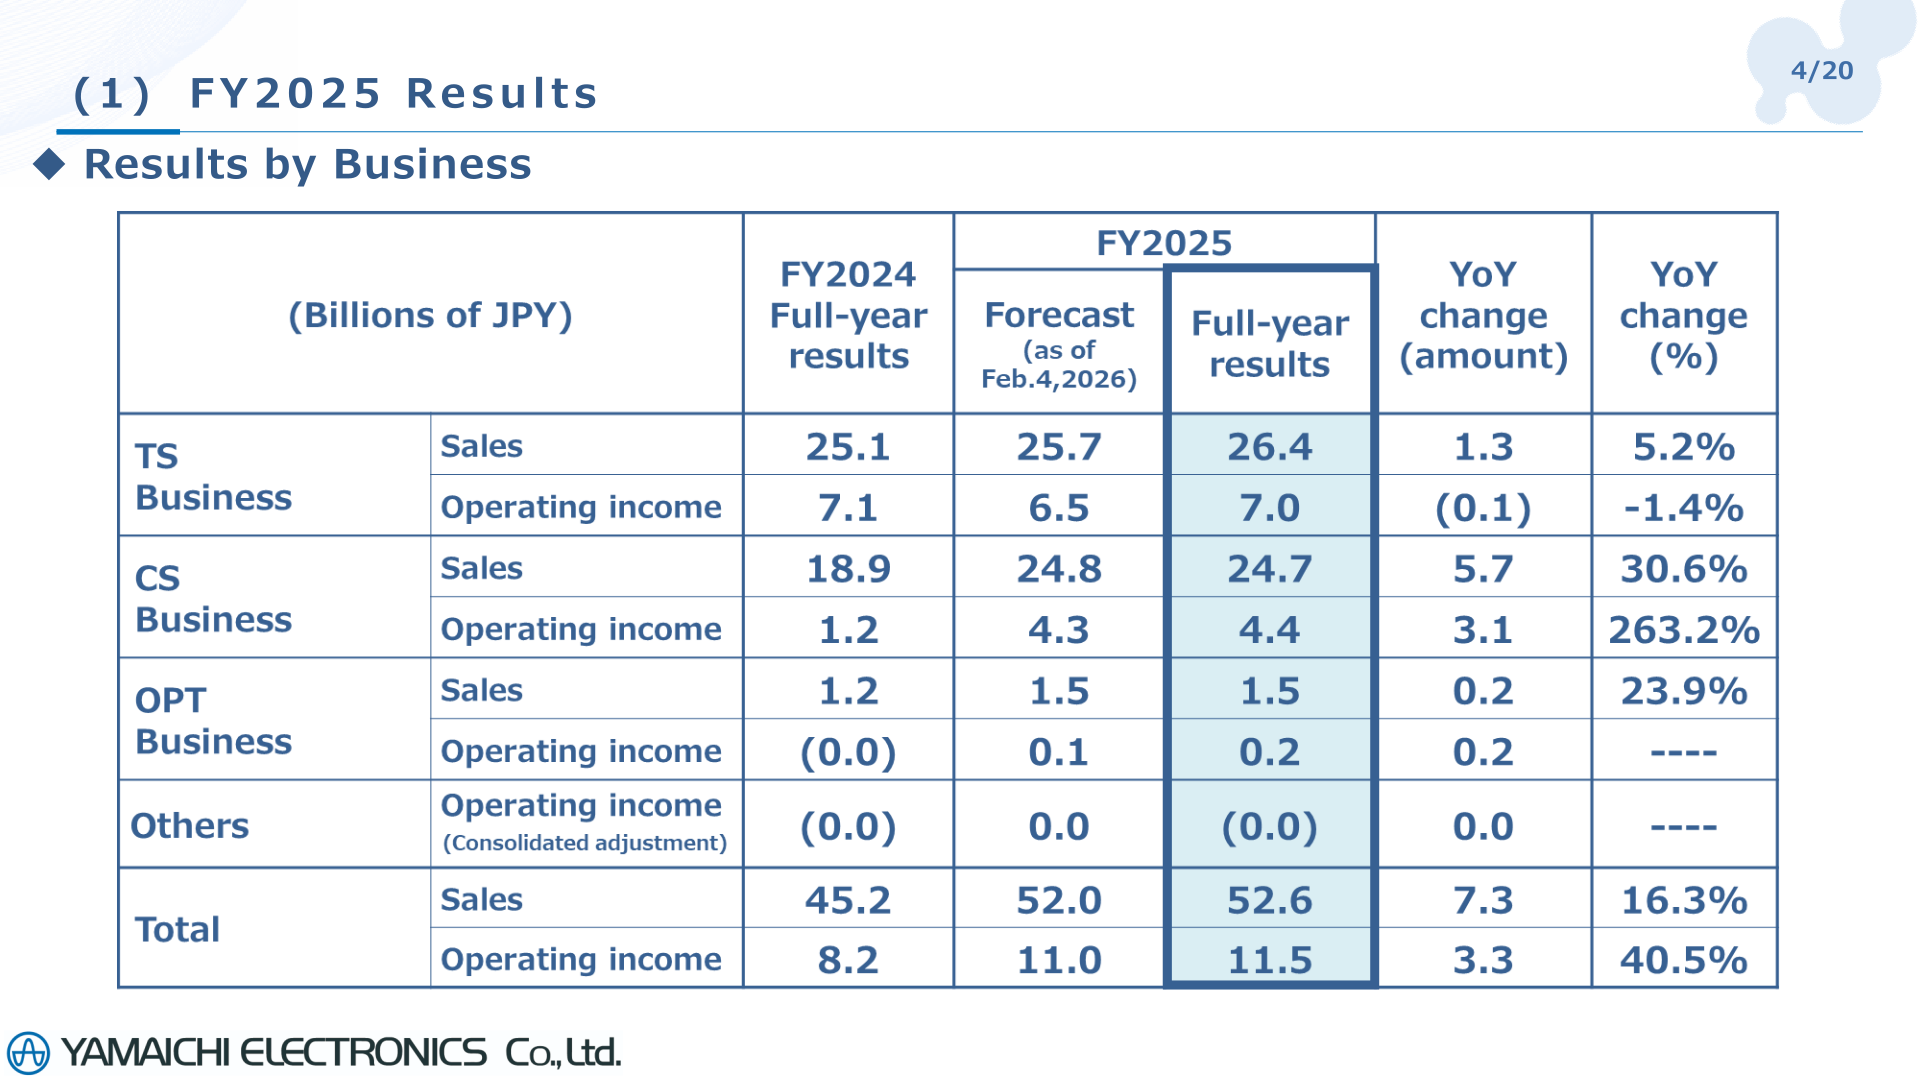
In the Test Solution (TS) Business, sales rose 5.2% year on year to JPY26.4 billion while operating income edged down 1.4% to JPY7.0 billion. In the test socket field, sales of mainstay products for smartphones, PCs, automotive applications, and wearable devices remained strong. In the burn-in socket field, deferral of investment—particularly for products used in automotive logic semiconductors—negatively impacted both sales and profit, although investment in memory semiconductor-related products resumed in 2H, spurring recovery. Across the TS Business as a whole, profitability incurred a negative impact of approximately JPY600 million due to rising prices for gold, copper, and other raw materials. In the Connector Solution (CS) Business, sales rose 30.6% to JPY24.7 billion and operating income jumped 263.2% to JPY4.4 billion; communications equipment products delivered strong results on robust demand for core network communications equipment and a significant increase in data center-related demand (AI, etc.), and both sales and operating income reached segment record highs. The Optical-Related (OPT) Business posted sales of JPY1.5 billion (up 23.9%) and operating income of JPY0.2 billion.
| Segment | Metric | FY2024 Full-year results | FY2025 Full-year results | YoY change (amount) | YoY change (%) |
|---|---|---|---|---|---|
| TS Business | Sales | 25.1 | 26.4 | 1.3 | 5.2% |
| TS Business | Operating income | 7.1 | 7.0 | (0.1) | -1.4% |
| CS Business | Sales | 18.9 | 24.7 | 5.7 | 30.6% |
| CS Business | Operating income | 1.2 | 4.4 | 3.1 | 263.2% |
| OPT Business | Sales | 1.2 | 1.5 | 0.2 | 23.9% |
| OPT Business | Operating income | (0.0) | 0.2 | 0.2 | —- |
| Others | Operating income (Consolidated adjustment) | (0.0) | (0.0) | 0.0 | —- |
| Total | Sales | 45.2 | 52.6 | 7.3 | 16.3% |
| Total | Operating income | 8.2 | 11.5 | 3.3 | 40.5% |
FY2026 Forecast
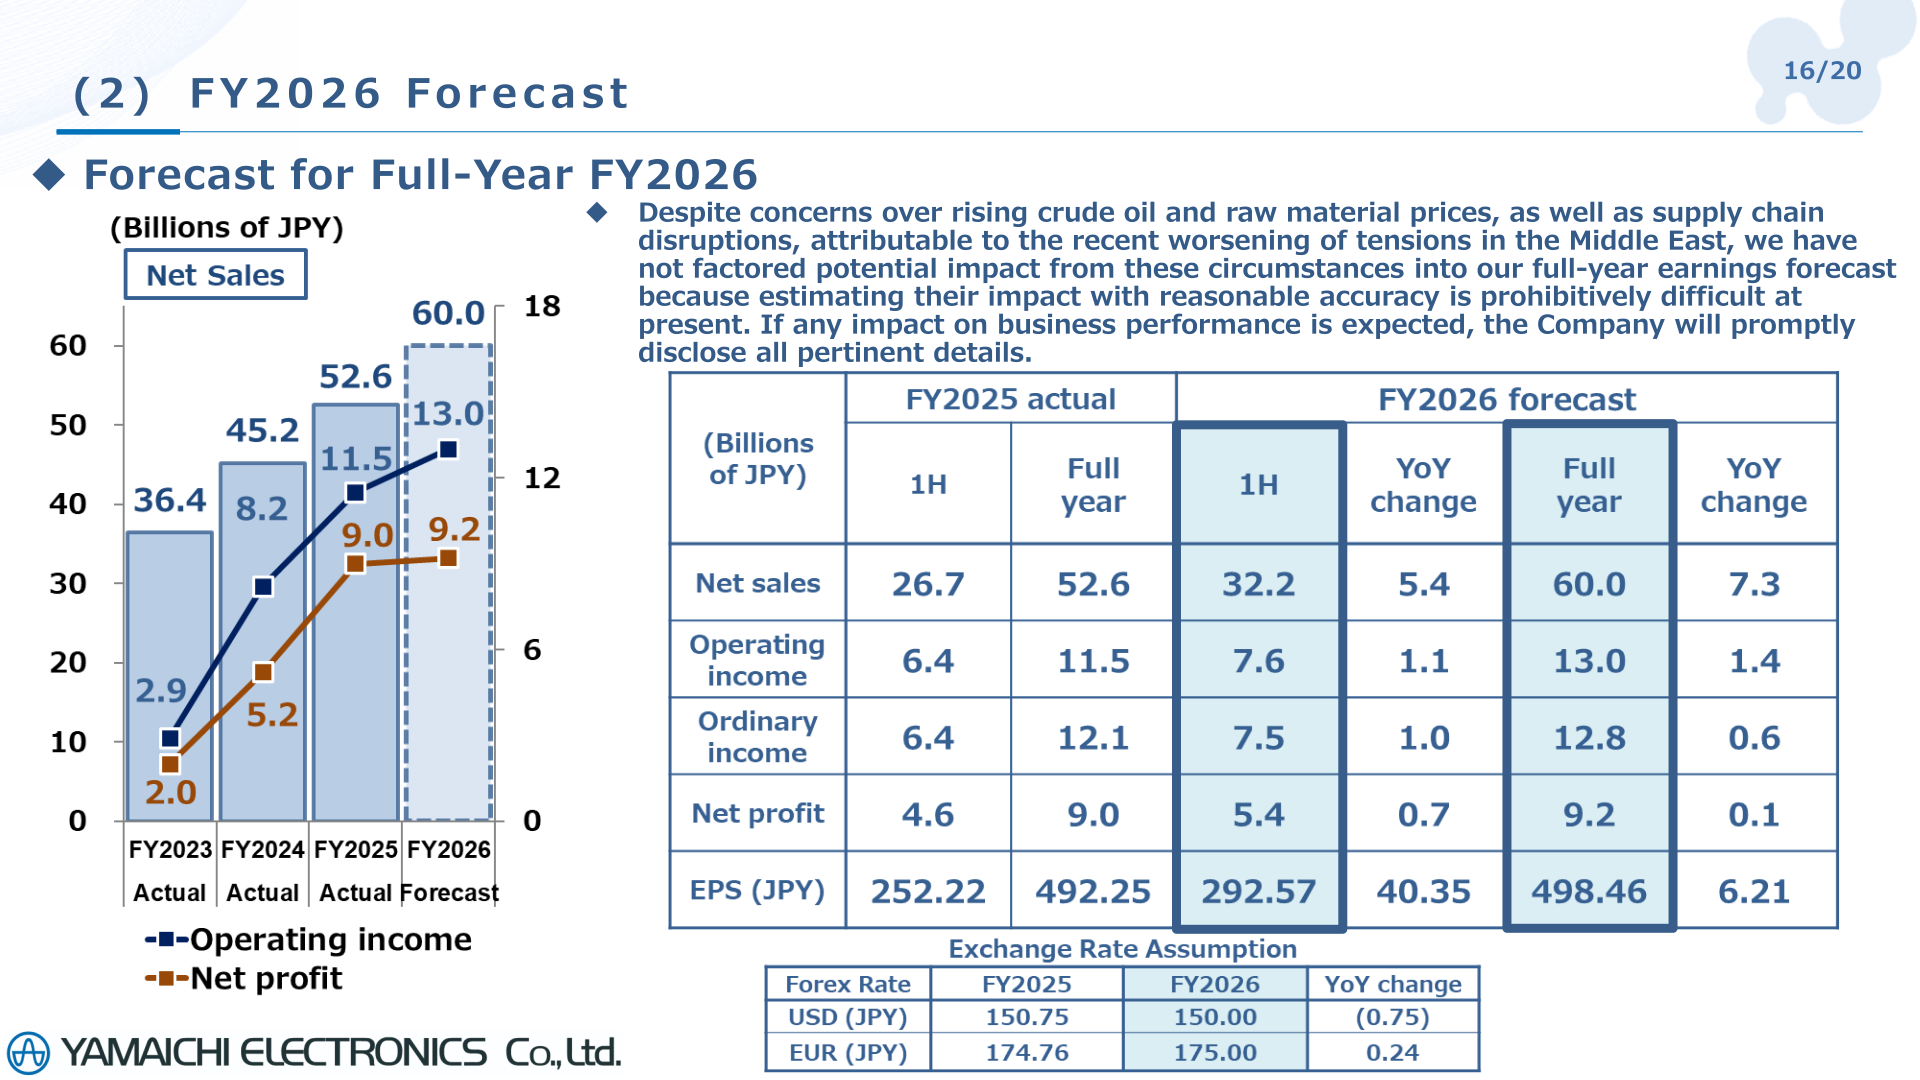
For FY2026, the company forecasts net sales of JPY60.0 billion (up 7.3 from FY2025), operating income of JPY13.0 billion (up 1.4), ordinary income of JPY12.8 billion (up 0.6), and net profit of JPY9.2 billion (up 0.1). The exchange rate assumptions are USD at JPY150.00 and EUR at JPY175.00. The company notes that, despite concerns over rising crude oil and raw material prices as well as supply chain disruptions attributable to the recent worsening of tensions in the Middle East, it has not factored potential impact from these circumstances into its full-year earnings forecast because estimating their impact with reasonable accuracy is prohibitively difficult at present. By segment, TS Business sales are projected at JPY31.1 billion with operating income of JPY7.8 billion, CS Business sales at JPY27.4 billion with operating income of JPY5.0 billion, and OPT Business sales at JPY1.5 billion with operating income of JPY0.1 billion. Capital investment for FY2026 is planned at JPY4.7 billion, versus JPY4.0 billion in FY2025.
| (Billions of JPY) | FY2025 actual (Full year) | FY2026 forecast (Full year) | YoY change |
|---|---|---|---|
| Net sales | 52.6 | 60.0 | 7.3 |
| Operating income | 11.5 | 13.0 | 1.4 |
| Ordinary income | 12.1 | 12.8 | 0.6 |
| Net profit | 9.0 | 9.2 | 0.1 |
| EPS (JPY) | 492.25 | 498.46 | 6.21 |
Shareholder Returns
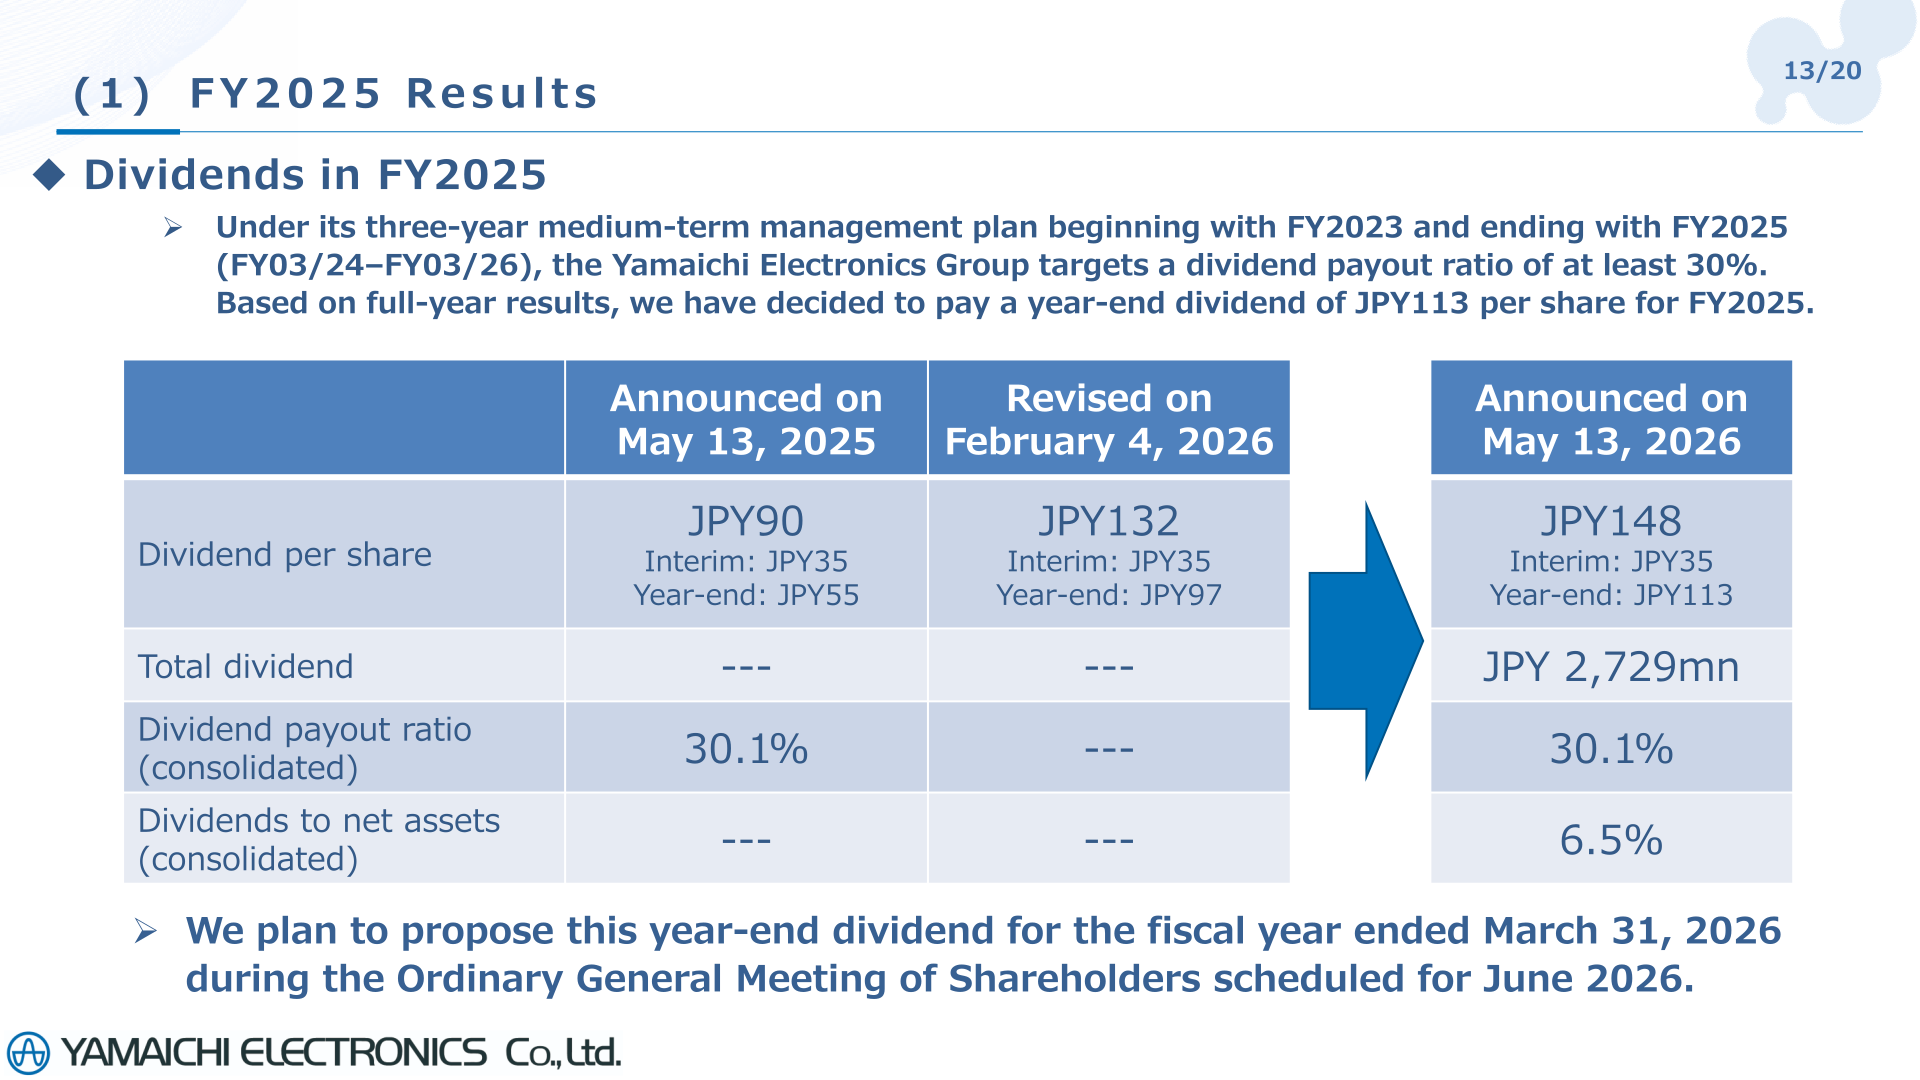
Under its three-year medium-term management plan beginning with FY2023 and ending with FY2025 (FY03/24–FY03/26), the Yamaichi Electronics Group targets a dividend payout ratio of at least 30%. Based on full-year results, the company decided to pay a year-end dividend of JPY113 per share for FY2025, bringing the annual dividend to JPY148 per share (interim JPY35, year-end JPY113), versus the initial plan of JPY90 announced on May 13, 2025 and the revised JPY132 announced on February 4, 2026. The total dividend amounts to JPY 2,729mn, with a consolidated dividend payout ratio of 30.1% and dividends to net assets of 6.5%. The year-end dividend is planned to be proposed at the Ordinary General Meeting of Shareholders scheduled for June 2026. Separately, under a share buyback resolved by the Board of Directors on March 21, 2025 (maximum 1,250,000 shares, maximum purchase price JPY2,500,000,000), the company acquired 1,004,400 shares for JPY1,906,971,200 between April 3, 2025 and April 16, 2025 (based on delivery dates). Combined with the 245,600 shares repurchased in FY2024 for JPY561,463,400, the total buyback amounts to 1,250,000 shares costing JPY2,468,434,600.
| Item | Announced on May 13, 2025 | Revised on February 4, 2026 | Announced on May 13, 2026 |
|---|---|---|---|
| Dividend per share | JPY90 (Interim: JPY35 / Year-end: JPY55) | JPY132 (Interim: JPY35 / Year-end: JPY97) | JPY148 (Interim: JPY35 / Year-end: JPY113) |
| Total dividend | — | — | JPY 2,729mn |
| Dividend payout ratio (consolidated) | 30.1% | — | 30.1% |
| Dividends to net assets (consolidated) | — | — | 6.5% |
Results of the Medium-Term Management Plan (FY2023–FY2025)
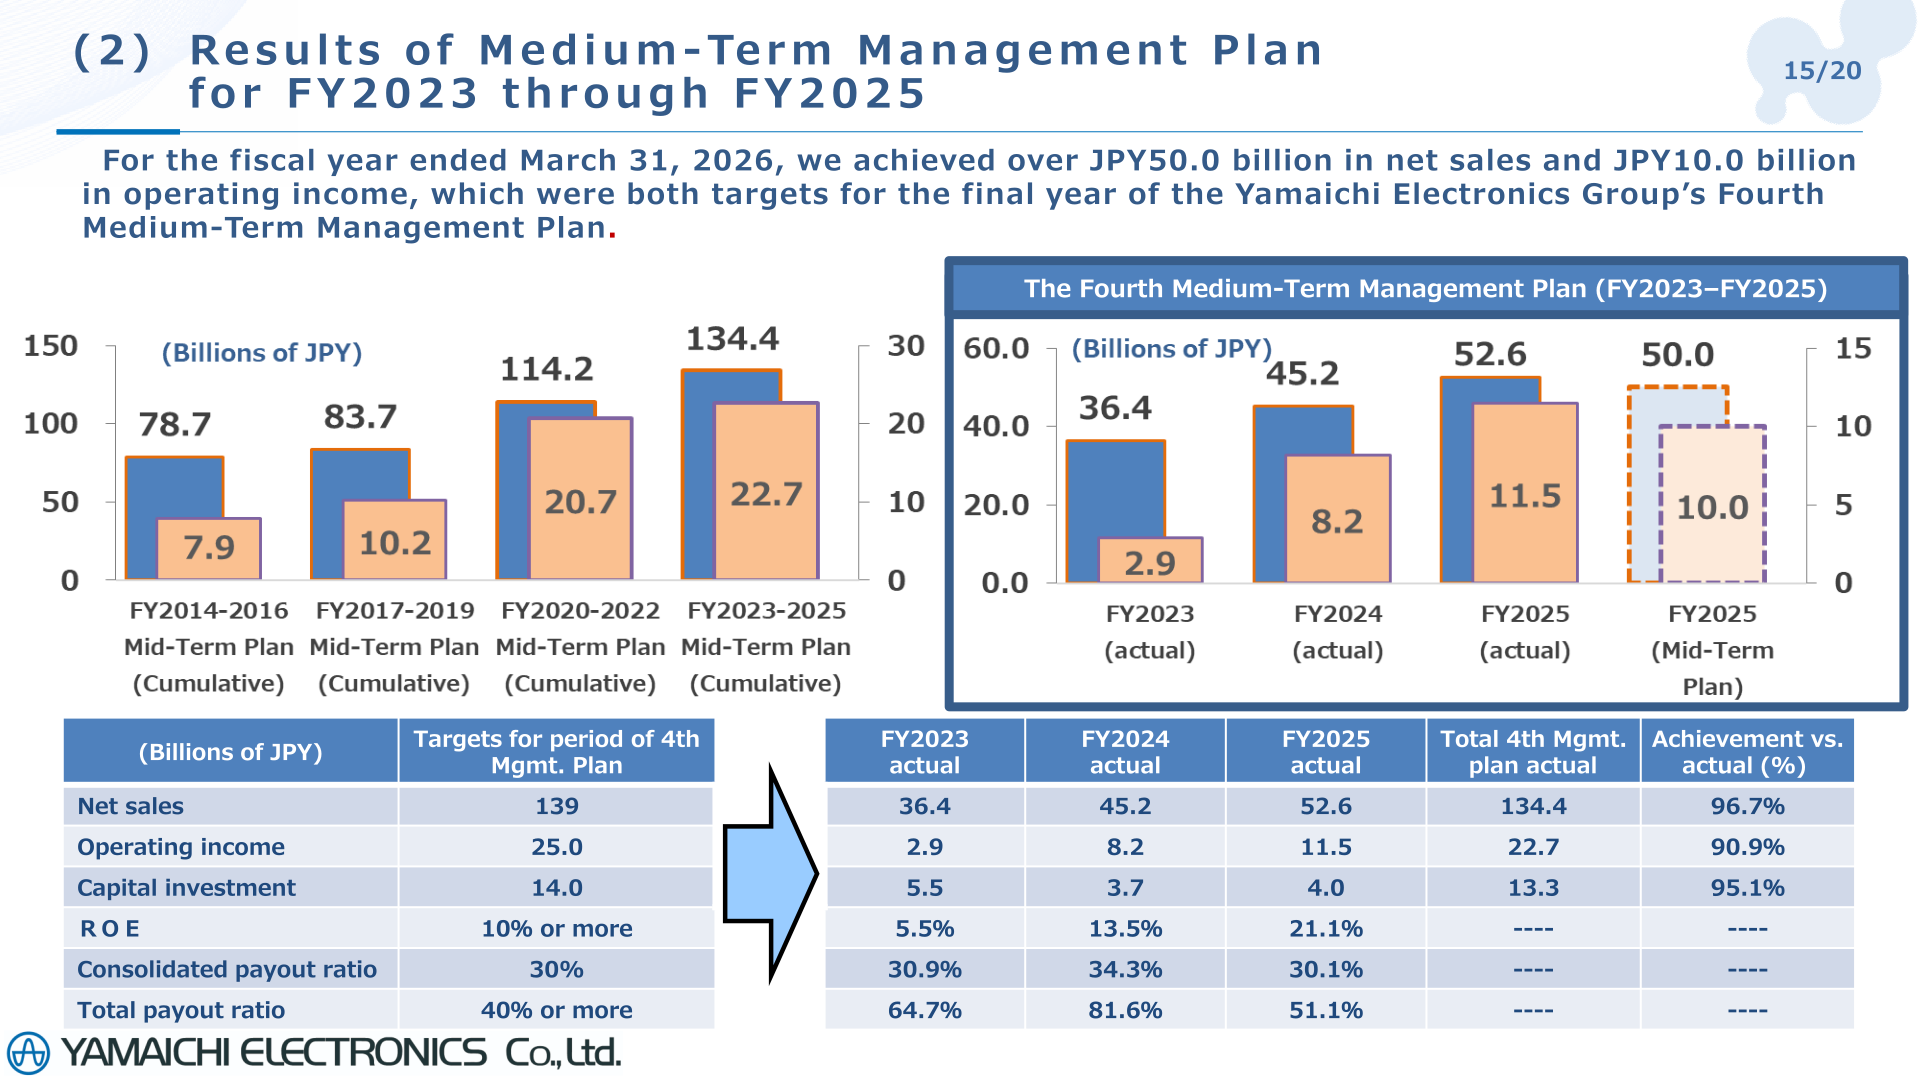
For the fiscal year ended March 31, 2026, the company achieved over JPY50.0 billion in net sales and JPY10.0 billion in operating income, which were both targets for the final year of the Yamaichi Electronics Group’s Fourth Medium-Term Management Plan. Over the three-year plan period, cumulative net sales were JPY134.4 billion against the JPY139 billion target (96.7% achievement), cumulative operating income was JPY22.7 billion against the JPY25.0 billion target (90.9%), and cumulative capital investment was JPY13.3 billion against the JPY14.0 billion plan (95.1%). Against the target values of ROE of 10% or more, a consolidated dividend payout ratio of 30%, and a total return ratio of 40% or more, the company recorded ROE of 5.5% in FY2023, 13.5% in FY2024, and 21.1% in FY2025; consolidated payout ratios of 30.9%, 34.3%, and 30.1%; and total payout ratios of 64.7%, 81.6%, and 51.1%.
This article is an analysis based on publicly available information and is not a recommendation to buy or sell any specific securities. Investment decisions are your own responsibility.
![[Obayashi] Investors’ Guide 2026 — The Complete 24-Article Breakdown](https://japan-equity.com/wp-content/uploads/2026/07/hub_cover-1024x1024.png)
![[Obayashi] IR & SR Policy — Feeding Dialogue Back into Management](https://japan-equity.com/wp-content/uploads/2026/07/p32_sq-1024x1024.jpg)
![[Obayashi] Real Estate Development — 18.7% Margin, ¥287.7bn Unrealized Gains](https://japan-equity.com/wp-content/uploads/2026/07/p20_sq-1024x1024.jpg)
![[Obayashi] Domestic Civil Engineering — Resilience Spending Supports 9.6% Margin](https://japan-equity.com/wp-content/uploads/2026/07/p11_sq-1024x1024.jpg)
![[Obayashi] Share Price & External Ratings — vs TOPIX, ESG Index Inclusion](https://japan-equity.com/wp-content/uploads/2026/07/p40_sq-1024x1024.jpg)
![[Construction] ¥75.5tn Investment, Shrinking Workforce — Big-5 Market Share](https://japan-equity.com/wp-content/uploads/2026/07/p12_sq-1024x1024.jpg)



![[Obayashi] Capital Policy & Shareholder Returns — ROE 10%+, DOE ~5%, ¥100bn Buyback](https://japan-equity.com/wp-content/uploads/2026/07/p27_sq-1024x1024.jpg)
![[Obayashi] Reducing Cross-Shareholdings — ¥285.2bn Sold in Five Years](https://japan-equity.com/wp-content/uploads/2026/07/p29_sq-1024x1024.jpg)
![[Obayashi] ¥750bn Investment Plan — ¥300bn to Development, ¥190bn to Tech/DX](https://japan-equity.com/wp-content/uploads/2026/07/p30_sq-1024x1024.jpg)
![[Obayashi] MTP2022 KPIs — Operating Profit ~2x Target, ROE 14.4%](https://japan-equity.com/wp-content/uploads/2026/07/p25_sq-1024x1024.jpg)
![[Obayashi] Cash Allocation — ¥420bn Investment CF Over Five Years](https://japan-equity.com/wp-content/uploads/2026/07/p26_sq-1024x1024.jpg)
![[Obayashi] Green Energy — 44 Plants, 344MW, and the Green Hydrogen Challenge](https://japan-equity.com/wp-content/uploads/2026/07/p21_sq-1024x1024.jpg)
![[Obayashi] Tackling the Labor Shortage — Robotics Construction®](https://japan-equity.com/wp-content/uploads/2026/07/p14_sq-1024x1024.jpg)
