
This article is based on publicly available IR materials and is not a recommendation to buy or sell any specific securities.
Advantest Corporation (TSE: 6857) announced its results for the fiscal year ended March 31, 2026 on April 27, 2026; the company labels this year “FY25” in its presentation. Sales, operating income and net income all reached record highs on a full-year basis, and demand stayed robust in Q4, so that full-year sales, operating income and net income exceeded the company’s own expectations. Sales rose 44.7% year on year to ¥1,128.6B and operating income rose 118.8% to ¥499.1B, with the operating margin reaching 44.2%. Amid a second consecutive year of growth in the semiconductor tester market in CY25, Advantest continued to expand its market share. Results and outlook are prepared in accordance with IFRS.
Consolidated Results (Full-Year Actual)
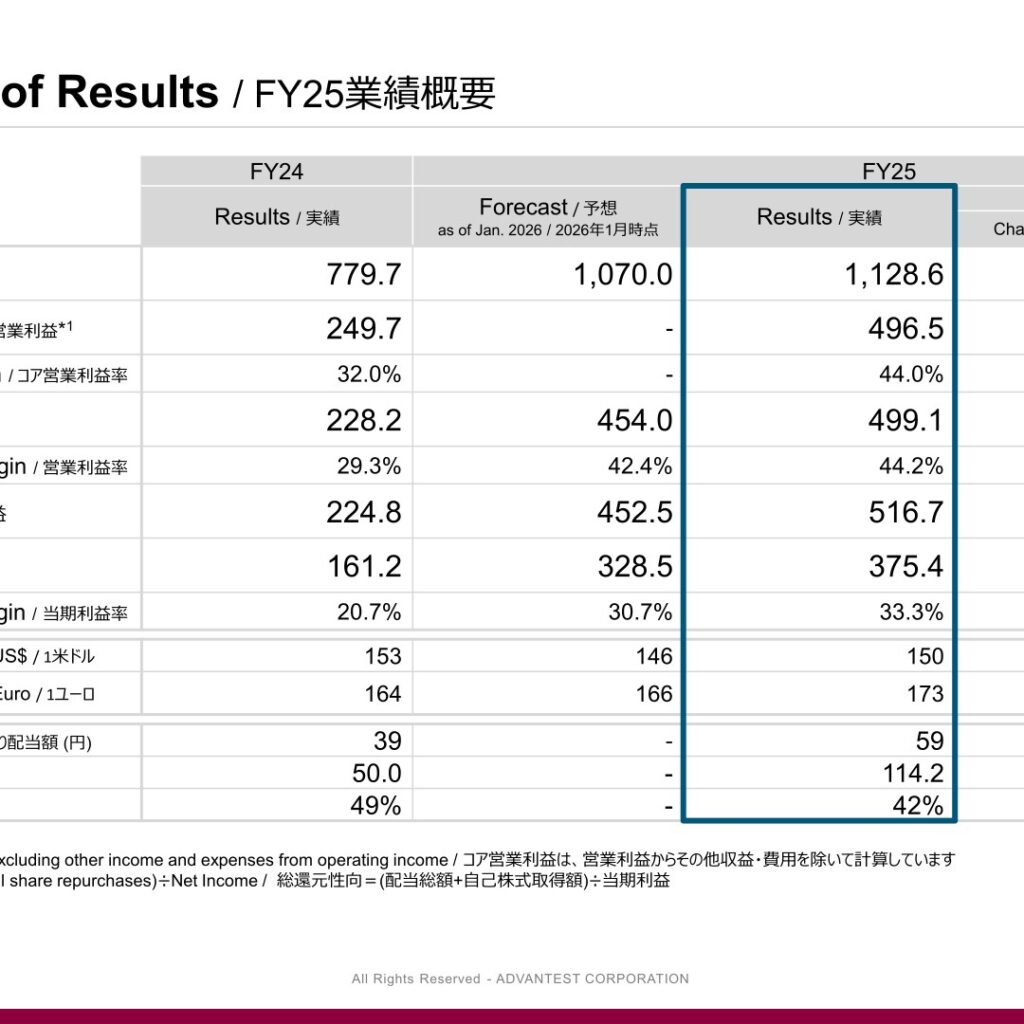
Sales increased ¥348.9B year on year to ¥1,128.6B, exceeding the company’s January 2026 forecast of ¥1,070.0B. Operating income of ¥499.1B also came in above the January 2026 forecast of ¥454.0B, as did income before tax (¥516.7B versus ¥452.5B) and net income (¥375.4B versus ¥328.5B). Core operating income, which Advantest defines as operating income excluding other income and expenses, was ¥496.5B for a core operating margin of 44.0%. Gross profit rose to ¥726.1B from ¥445.1B, with the gross margin at 64.3% against 57.1% a year earlier, while SG&A (which Advantest presents as selling, general and administrative expenses combined with total other income and expenses) was ¥227.0B against ¥216.9B. The average exchange rate was 150 yen to the US dollar (3 yen appreciation versus FY24) and 173 yen to the euro (9 yen depreciation).
On a quarterly basis, Q4 FY25 was the strongest quarter of the year: sales of ¥328.1B (+19.8% QoQ, +41.2% YoY), gross profit of ¥221.1B for a 67.4% gross margin, operating income of ¥153.1B (+34.8% QoQ, +139.1% YoY) for a 46.7% operating margin, and net income of ¥126.9B (+61.1% QoQ, +217.3% YoY).
| Item | FY2025 (FY25) | FY2024 (FY24) | Change |
|---|---|---|---|
| Sales | ¥1,128.6B | ¥779.7B | +¥348.9B (+44.7%) |
| Core Operating Income | ¥496.5B | ¥249.7B | +¥246.8B (+98.8%) |
| Core Operating Margin | 44.0% | 32.0% | +12.0pts |
| Operating Income | ¥499.1B | ¥228.2B | +¥271.0B (+118.8%) |
| Operating Margin | 44.2% | 29.3% | +14.9pts |
| Income Before Tax | ¥516.7B | ¥224.8B | +¥291.9B (+129.9%) |
| Net Income | ¥375.4B | ¥161.2B | +¥214.2B (+132.9%) |
| Net Income Margin | 33.3% | 20.7% | +12.6pts |
| Exchange Rate (1 US$) | 150 JPY | 153 JPY | JPY 3 Appreciation |
| Exchange Rate (1 Euro) | 173 JPY | 164 JPY | JPY 9 Depreciation |
Segment Results
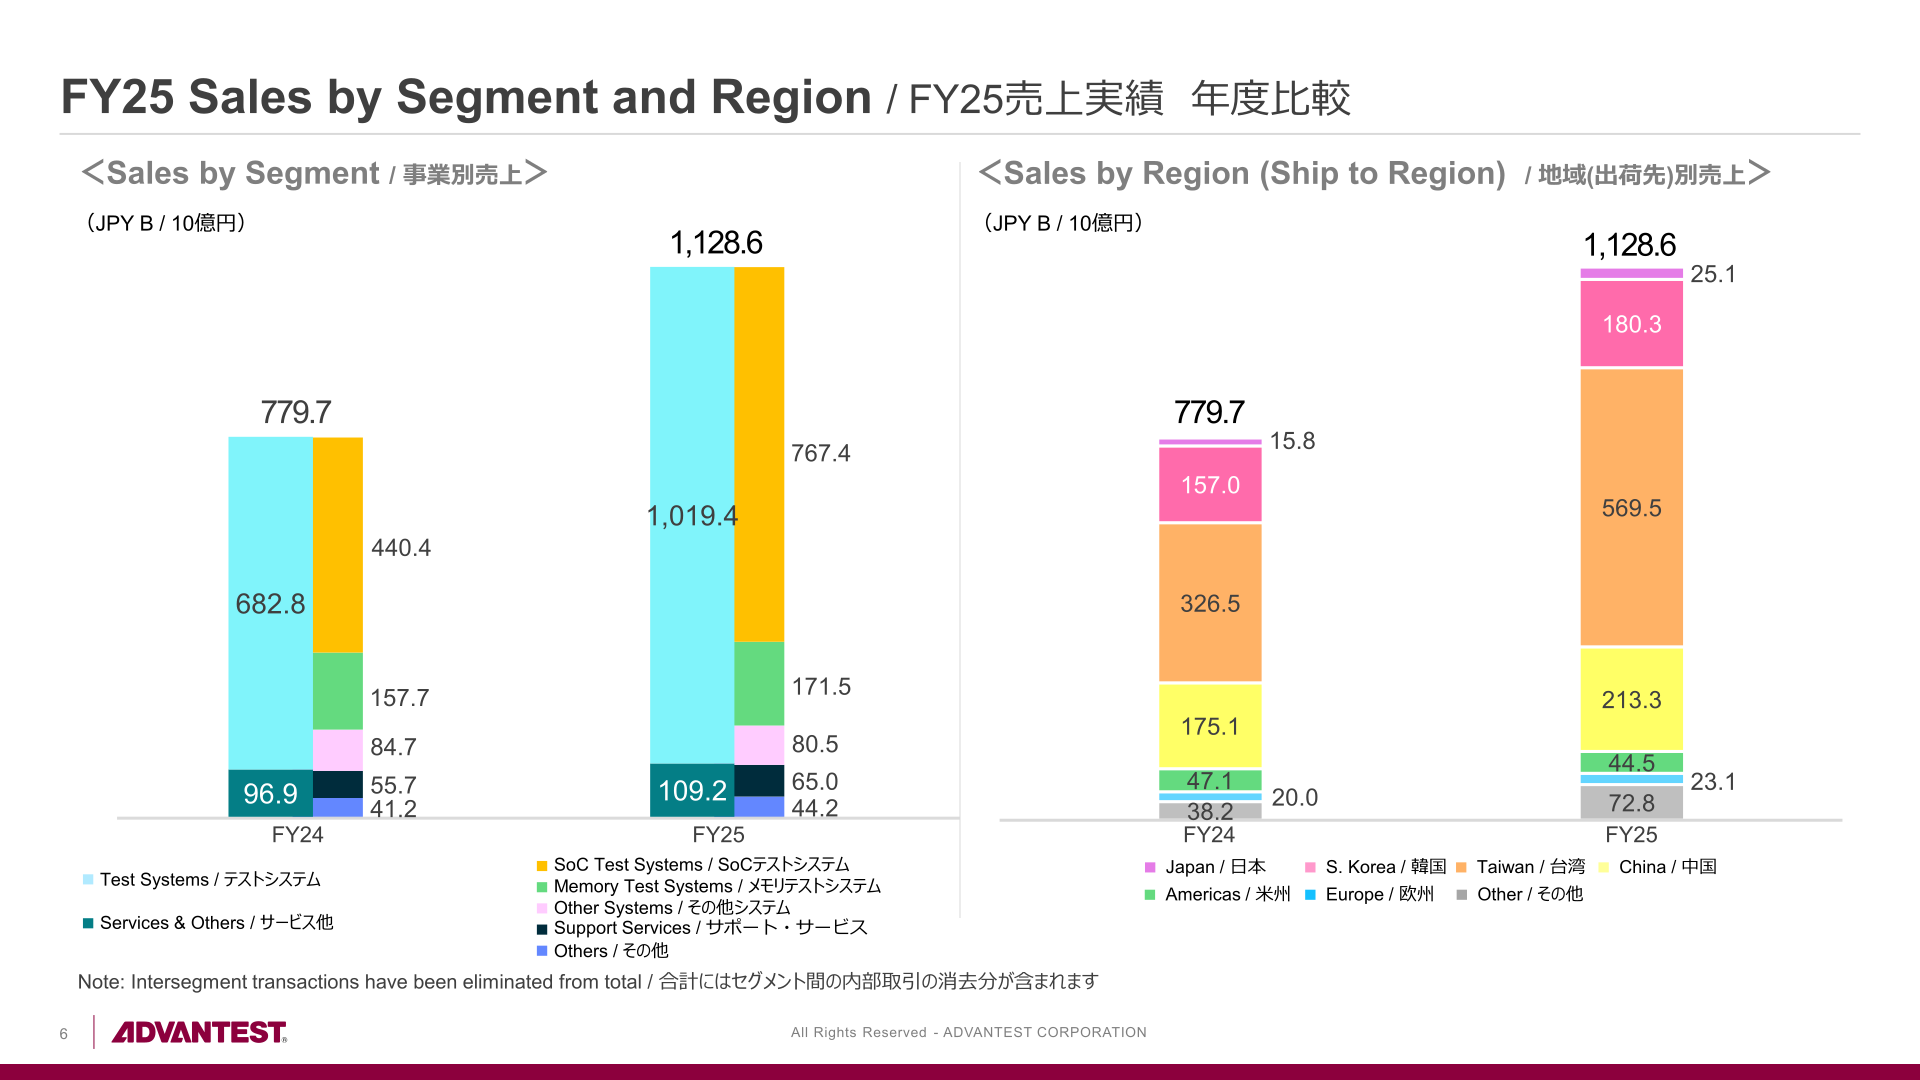
Growth was led by SoC Test Systems, where sales rose to ¥767.4B from ¥440.4B. Memory Test Systems sales rose to ¥171.5B from ¥157.7B, while Other Systems declined to ¥80.5B from ¥84.7B; the Test Systems business as a whole reached ¥1,019.4B against ¥682.8B. In Services & Others, Support Services sales rose to ¥65.0B from ¥55.7B and Others rose to ¥44.2B from ¥41.2B, taking the total to ¥109.2B from ¥96.9B. Intersegment transactions are eliminated from the totals.
| Segment | Metric | FY2025 (FY25) | FY2024 (FY24) |
|---|---|---|---|
| SoC Test Systems | Sales | ¥767.4B | ¥440.4B |
| Memory Test Systems | Sales | ¥171.5B | ¥157.7B |
| Other Systems | Sales | ¥80.5B | ¥84.7B |
| Test Systems (total) | Sales | ¥1,019.4B | ¥682.8B |
| Support Services | Sales | ¥65.0B | ¥55.7B |
| Others | Sales | ¥44.2B | ¥41.2B |
| Services & Others (total) | Sales | ¥109.2B | ¥96.9B |
| Consolidated Total | Sales | ¥1,128.6B | ¥779.7B |
By ship-to region, Taiwan was the largest destination at ¥569.5B (¥326.5B in FY24), followed by China at ¥213.3B (¥175.1B), South Korea at ¥180.3B (¥157.0B), Other regions at ¥72.8B (¥38.2B), Americas at ¥44.5B (¥47.1B), Japan at ¥25.1B (¥15.8B) and Europe at ¥23.1B (¥20.0B).
Tester Market and Market Share
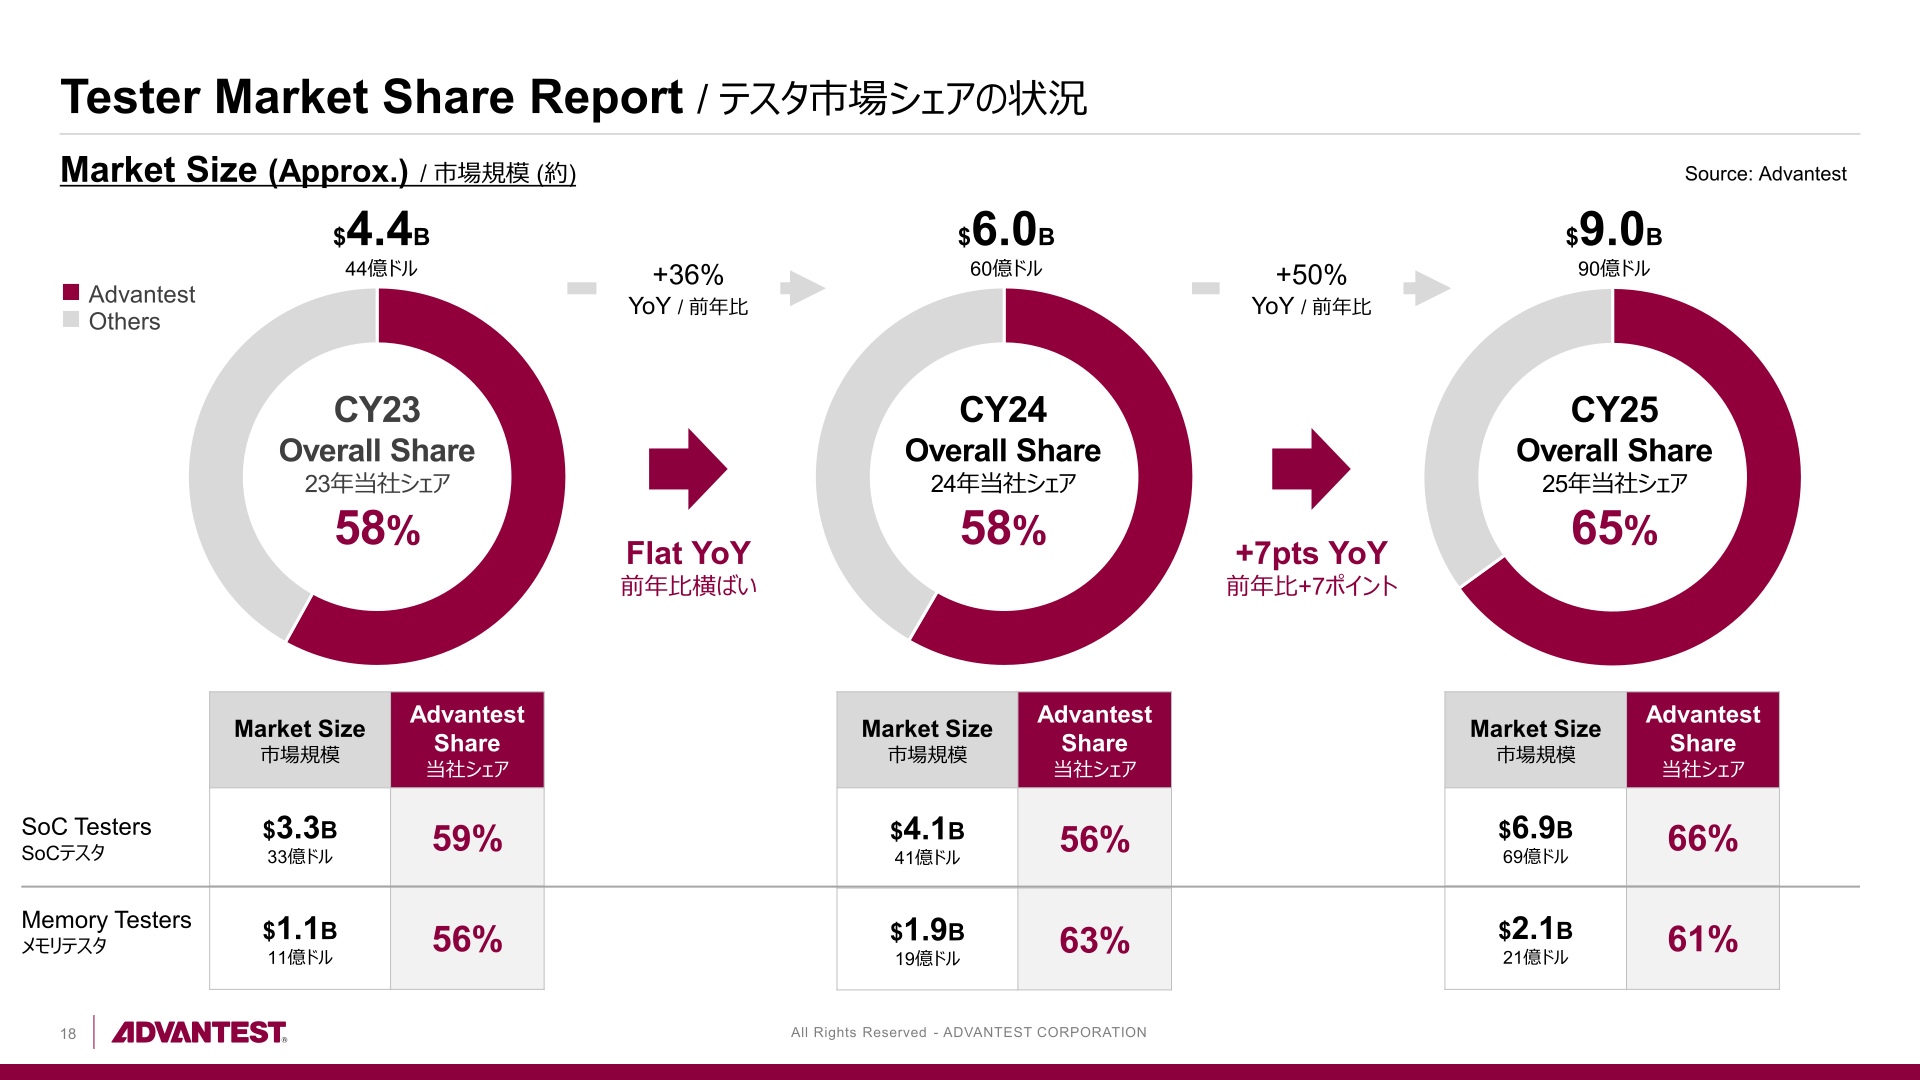
Advantest’s own estimate puts the overall tester market at approximately $9.0B in CY25, up 50% year on year from approximately $6.0B in CY24, which in turn was 36% above the approximately $4.4B market of CY23. Advantest’s overall share rose to 65% in CY25 from 58% in CY24, an increase of 7 points. Within that, the SoC tester market was approximately $6.9B with an Advantest share of 66% (CY24: approximately $4.1B and 56%), and the memory tester market was approximately $2.1B with an Advantest share of 61% (CY24: approximately $1.9B and 63%).
For CY26, Advantest’s April 2026 view is that the SoC tester market is likely to see continued growth driven by volume and complexity supported by AI market growth, and that the memory tester market is likely to see continued solid appetite for tester investments. The company estimates the CY26 SoC tester market at approximately $8.7–9.5B and the memory tester market at approximately $2.2–2.7B. Advantest notes that the semiconductor industry faces industry-specific supply constraints amid uncertainties including growing geopolitical risks, but expects semiconductor demand to remain robust, driven primarily by AI-related applications.
FY2026 Forecast
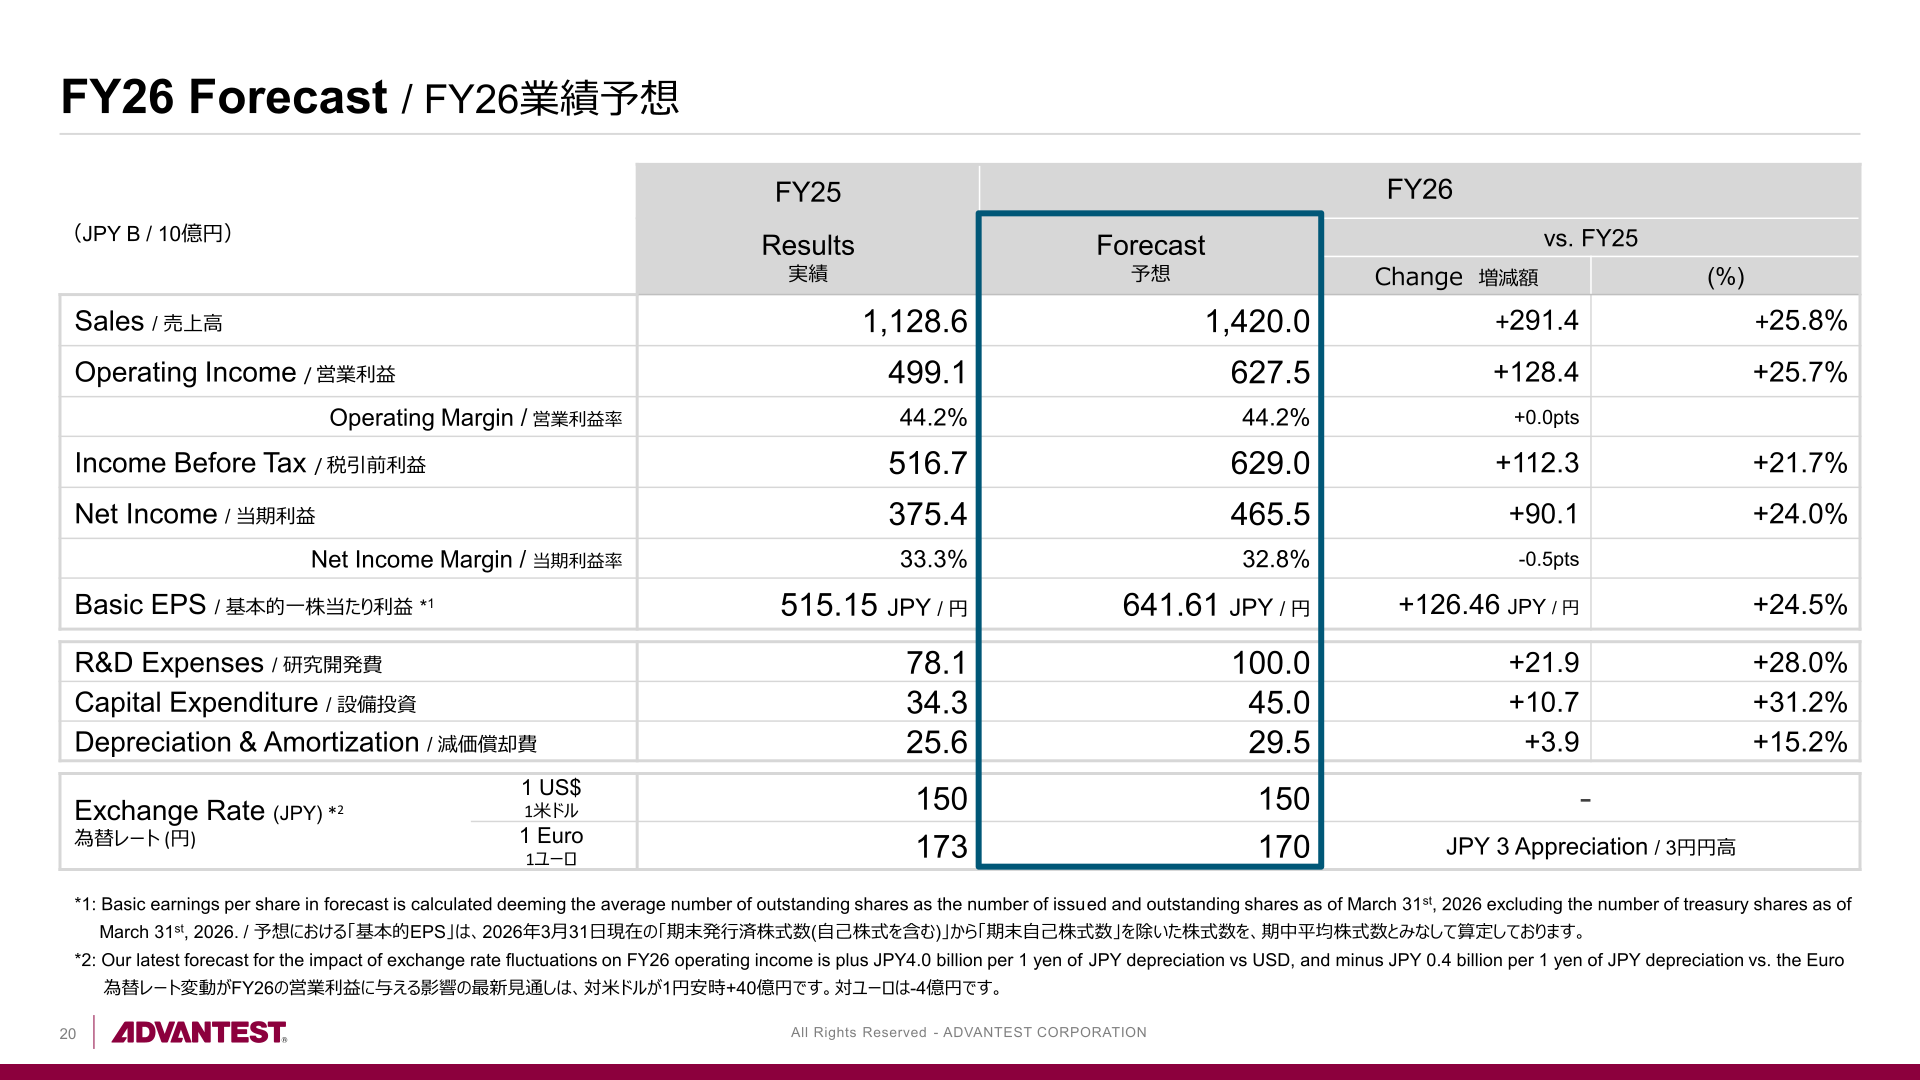
For FY26, the year following the period ended March 31, 2026, Advantest forecasts sales of ¥1,420.0B, up 25.8%, and operating income of ¥627.5B, up 25.7%, keeping the operating margin at 44.2%. Income before tax is forecast at ¥629.0B and net income at ¥465.5B, giving basic EPS of 641.61 yen. The company plans to raise R&D expenses to ¥100.0B and capital expenditure to ¥45.0B as it boosts growth investments for capacity expansion and the strategic initiatives set out in its Third Mid-Term Plan. Assumed exchange rates are 150 yen to the US dollar and 170 yen to the euro. Advantest states that its latest forecast for the impact of exchange rate fluctuations on FY26 operating income is plus JPY 4.0 billion per 1 yen of yen depreciation versus the US dollar, and minus JPY 0.4 billion per 1 yen of yen depreciation versus the euro.
| Item | FY2026 Forecast (FY26) | FY2025 Actual (FY25) | Change |
|---|---|---|---|
| Sales | ¥1,420.0B | ¥1,128.6B | +¥291.4B (+25.8%) |
| Operating Income | ¥627.5B | ¥499.1B | +¥128.4B (+25.7%) |
| Operating Margin | 44.2% | 44.2% | +0.0pts |
| Income Before Tax | ¥629.0B | ¥516.7B | +¥112.3B (+21.7%) |
| Net Income | ¥465.5B | ¥375.4B | +¥90.1B (+24.0%) |
| Net Income Margin | 32.8% | 33.3% | -0.5pts |
| Basic EPS | 641.61 JPY | 515.15 JPY | +126.46 JPY (+24.5%) |
| R&D Expenses | ¥100.0B | ¥78.1B | +¥21.9B (+28.0%) |
| Capital Expenditure | ¥45.0B | ¥34.3B | +¥10.7B (+31.2%) |
| Depreciation & Amortization | ¥29.5B | ¥25.6B | +¥3.9B (+15.2%) |
| Exchange Rate (1 US$) | 150 JPY | 150 JPY | – |
| Exchange Rate (1 Euro) | 170 JPY | 173 JPY | JPY 3 Appreciation |
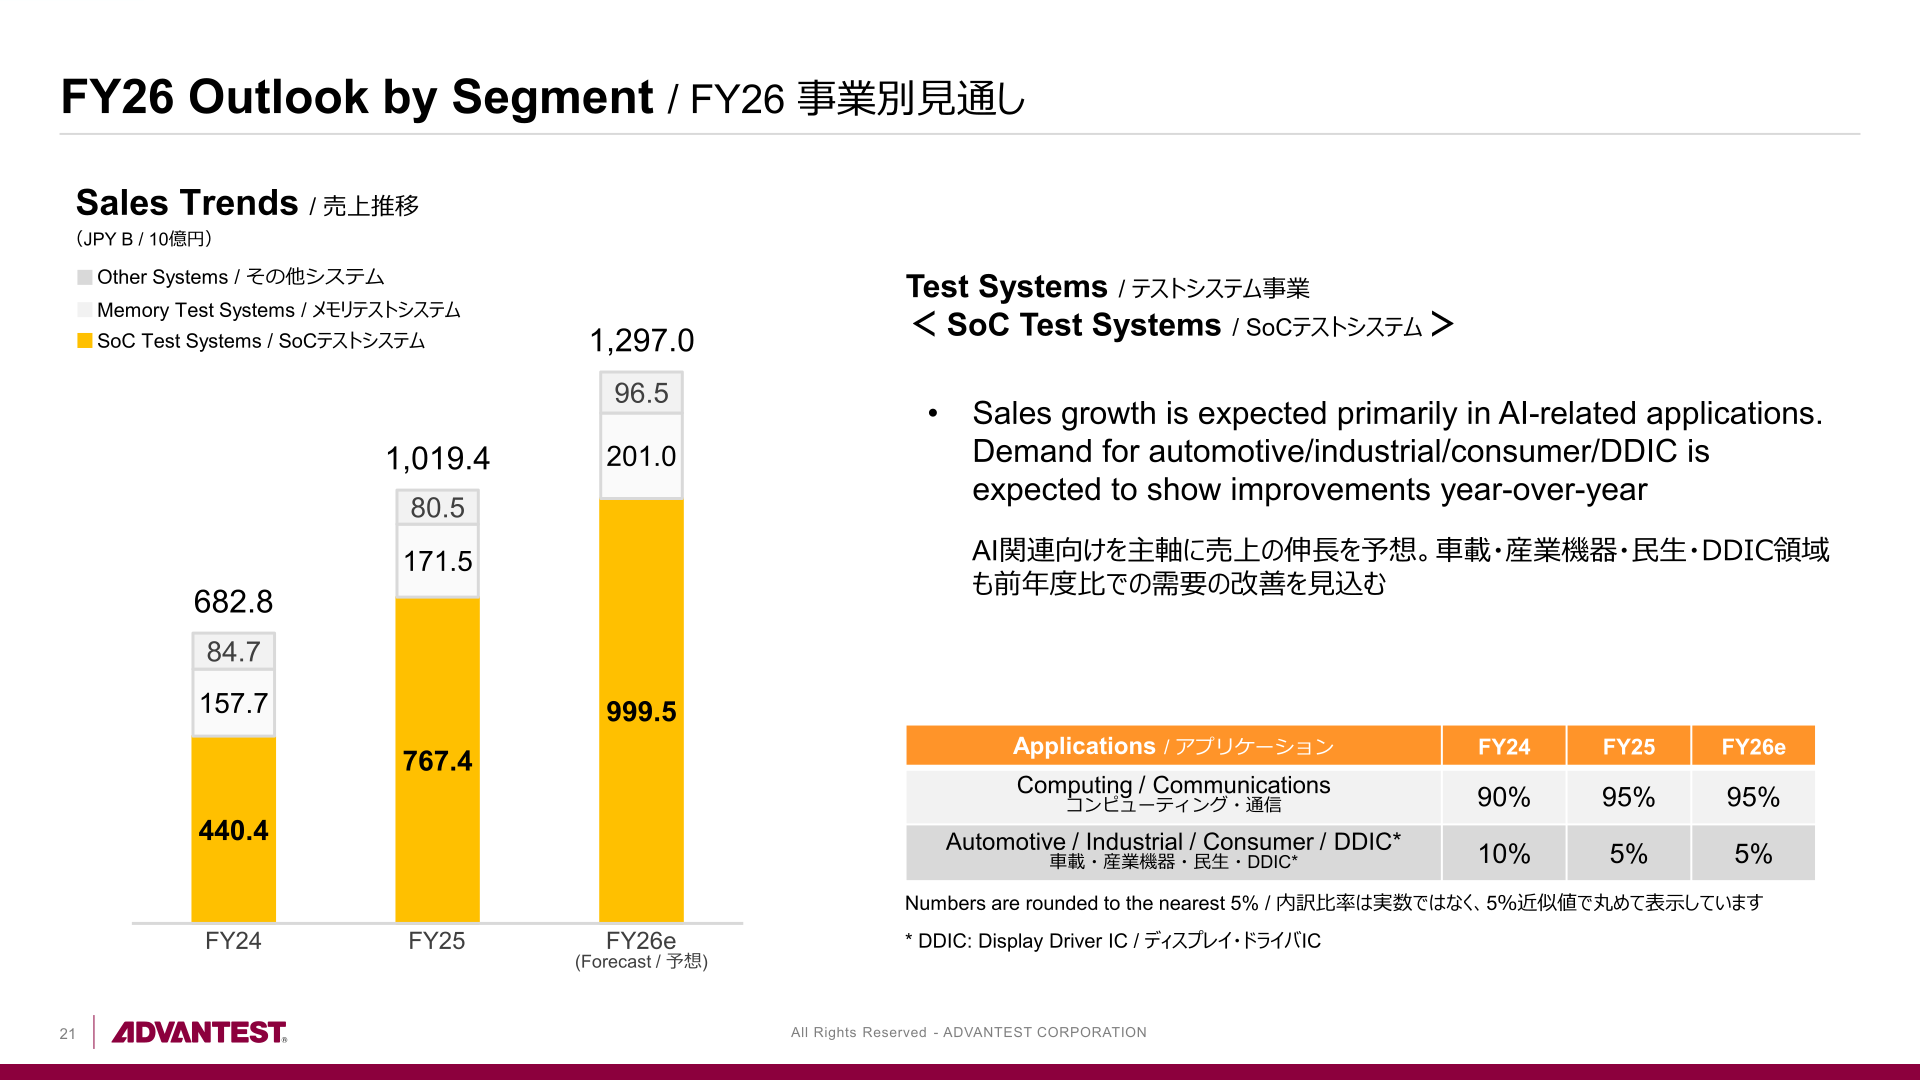
By segment, Advantest expects Test Systems sales of ¥1,297.0B in FY26 (FY25: ¥1,019.4B), comprising SoC Test Systems of ¥999.5B (¥767.4B), Memory Test Systems of ¥201.0B (¥171.5B) and Other Systems of ¥96.5B (¥80.5B). Services & Others is expected to reach ¥123.0B (¥109.2B), split between Support Services of ¥70.5B (¥65.0B) and Others of ¥52.5B (¥44.2B). In SoC Test Systems, sales growth is expected primarily in AI-related applications, with demand for automotive/industrial/consumer/DDIC expected to show improvements year over year; the computing/communications application mix is expected to remain at 95% in FY26e, unchanged from FY25 (FY24: 90%). In Memory Test Systems, sales growth is expected particularly for high-performance DRAM supported by strong appetite for tester investments, with DRAM accounting for 90% of the mix in FY26e, in line with FY25 (FY24: 95%). Support Services growth is attributed to the steady growth of the installed base, and growth in Others is expected primarily in test interface boards. Application mix figures are rounded to the nearest 5%.
Financial Position and Cash Flow
Total assets stood at ¥1,171.8B as of March 31, 2026, against ¥854.2B as of March 31, 2025. Equity attributable to owners of the parent rose to ¥795.7B from ¥506.5B, lifting the ratio of equity attributable to owners of the parent to 67.9% from 59.3%, and ROE was 57.6% against 34.4% in the prior year. Cash flows from operating activities were ¥335.2B (FY24: ¥286.0B) and cash flows from investing activities were -¥34.6B (FY24: -¥42.2B), producing free cash flows of ¥300.6B against ¥243.8B a year earlier. R&D expenses were ¥78.1B, equivalent to 6.9% of sales, down from 9.2% in FY24 as sales grew; capital expenditure was ¥34.3B and depreciation and amortization ¥25.6B.
Shareholder Returns
The dividend per share for FY25 was 59 yen, an increase of 20 yen from 39 yen in FY24; on a quarterly basis, 29 yen was paid at the end of Q2 and 30 yen at the end of Q4 (FY24: 19 yen and 20 yen). Share repurchases amounted to ¥114.2B, up ¥64.2B from ¥50.0B in FY24. The total return ratio, which Advantest defines as total dividends plus total share repurchases divided by net income, was 42%, down 7 points from 49% in FY24. A dividend forecast for FY26 cannot be confirmed from the materials.
| Item | FY2025 (FY25) | FY2024 (FY24) | Change |
|---|---|---|---|
| Dividend Per Share | 59 JPY | 39 JPY | +20 JPY |
| Share Repurchase | ¥114.2B | ¥50.0B | +¥64.2B |
| Total Return Ratio | 42% | 49% | -7pts |
Medium-Term Plan (MTP3) Progress
FY25 was the second year of Advantest’s Third Mid-Term Management Plan (MTP3), covering FY24 to FY26, under which the company continues to execute four strategies: outpacing the growth in its core market; expanding into adjacent and new businesses; driving operational excellence; and enhancing sustainability. On the first strategy, Advantest reports continued semiconductor tester market share expansion, the launch of several next-generation test solutions, and strengthened R&D capabilities to address mid- and long-term industry challenges. On the second, the company cites steady progress in expanding into silicon validation, deepened partnerships with three probe card manufacturers, and scaling collaboration initiatives to create test value, including the “Advantest Innovation Center.”
On operational excellence, Advantest points to advanced supply chain management and strong supplier collaboration that enables it to fulfil surging customer demand, and to expanding the governed internal use of AI to accelerate operations and improve efficiency. On sustainability, the company is enhancing talent acquisition, development and retention capabilities and building an attractive workplace to support business expansion, and despite business expansion expects GHG emissions (Scope 1 and 2) to remain broadly in line with the prior-year level.
Advantest highlights three areas of progress for the year. First, sustained leadership in the SoC tester market: a 10 percentage point year-on-year increase in SoC tester share, sustained and grown positions at major customers, and a majority share of the global AI accelerator business. Second, advancing technology leadership in next-generation semiconductor testing: timely deployment of next-generation semiconductor test solutions, the first high-volume ATE order for Silicon Photonics (SiPh), the opening of the “Advantest Innovation Center,” and participation in Applied Materials’ EPIC (Equipment and Process Innovation and Commercialization) platform. Third, robust progress in capacity expansion: the company states that its production capacity expansion efforts have been progressing ahead of the original plan, and it is accelerating the production capacity ramp-up to 10,000 systems per year while expanding the module lineup for SoC test systems and strategically driving supply chain transformation.
This article is an analysis based on publicly available information and is not a recommendation to buy or sell any specific securities. Investment decisions are your own responsibility.
![[Obayashi] Investors’ Guide 2026 — The Complete 24-Article Breakdown](https://japan-equity.com/wp-content/uploads/2026/07/hub_cover-1024x1024.png)
![[Obayashi] IR & SR Policy — Feeding Dialogue Back into Management](https://japan-equity.com/wp-content/uploads/2026/07/p32_sq-1024x1024.jpg)
![[Obayashi] Real Estate Development — 18.7% Margin, ¥287.7bn Unrealized Gains](https://japan-equity.com/wp-content/uploads/2026/07/p20_sq-1024x1024.jpg)
![[Obayashi] Domestic Civil Engineering — Resilience Spending Supports 9.6% Margin](https://japan-equity.com/wp-content/uploads/2026/07/p11_sq-1024x1024.jpg)
![[Obayashi] Share Price & External Ratings — vs TOPIX, ESG Index Inclusion](https://japan-equity.com/wp-content/uploads/2026/07/p40_sq-1024x1024.jpg)
![[Construction] ¥75.5tn Investment, Shrinking Workforce — Big-5 Market Share](https://japan-equity.com/wp-content/uploads/2026/07/p12_sq-1024x1024.jpg)



![[Obayashi] Capital Policy & Shareholder Returns — ROE 10%+, DOE ~5%, ¥100bn Buyback](https://japan-equity.com/wp-content/uploads/2026/07/p27_sq-1024x1024.jpg)
![[Obayashi] Reducing Cross-Shareholdings — ¥285.2bn Sold in Five Years](https://japan-equity.com/wp-content/uploads/2026/07/p29_sq-1024x1024.jpg)
![[Obayashi] ¥750bn Investment Plan — ¥300bn to Development, ¥190bn to Tech/DX](https://japan-equity.com/wp-content/uploads/2026/07/p30_sq-1024x1024.jpg)
![[Obayashi] MTP2022 KPIs — Operating Profit ~2x Target, ROE 14.4%](https://japan-equity.com/wp-content/uploads/2026/07/p25_sq-1024x1024.jpg)
![[Obayashi] Cash Allocation — ¥420bn Investment CF Over Five Years](https://japan-equity.com/wp-content/uploads/2026/07/p26_sq-1024x1024.jpg)
![[Obayashi] Green Energy — 44 Plants, 344MW, and the Green Hydrogen Challenge](https://japan-equity.com/wp-content/uploads/2026/07/p21_sq-1024x1024.jpg)
![[Obayashi] Tackling the Labor Shortage — Robotics Construction®](https://japan-equity.com/wp-content/uploads/2026/07/p14_sq-1024x1024.jpg)
