
This article is based on publicly available IR materials and is not a recommendation to buy or sell any specific securities.
Japan Aviation Electronics Industry, Ltd. (JAE, 6807) announced its financial results for FY2025 on April 24, 2026. Net sales came to 227.9 billion yen, up 3% year-on-year, as the Connector Business saw growth in the automotive segment and in the industrial and infrastructure segment, where market recovery was observed. Operating profit was 8.94 billion yen, down 43% year-on-year, as increasing material costs, selling price decline resulting from intensifying competition, deterioration of the product mix, and increased costs associated with new product launches weighed considerably on profit. Net sales finished at 101% of the projections announced in October 2025, while operating profit came in at 89% and net profit at 118% of those projections.
Consolidated Results (Full-Year Actual)
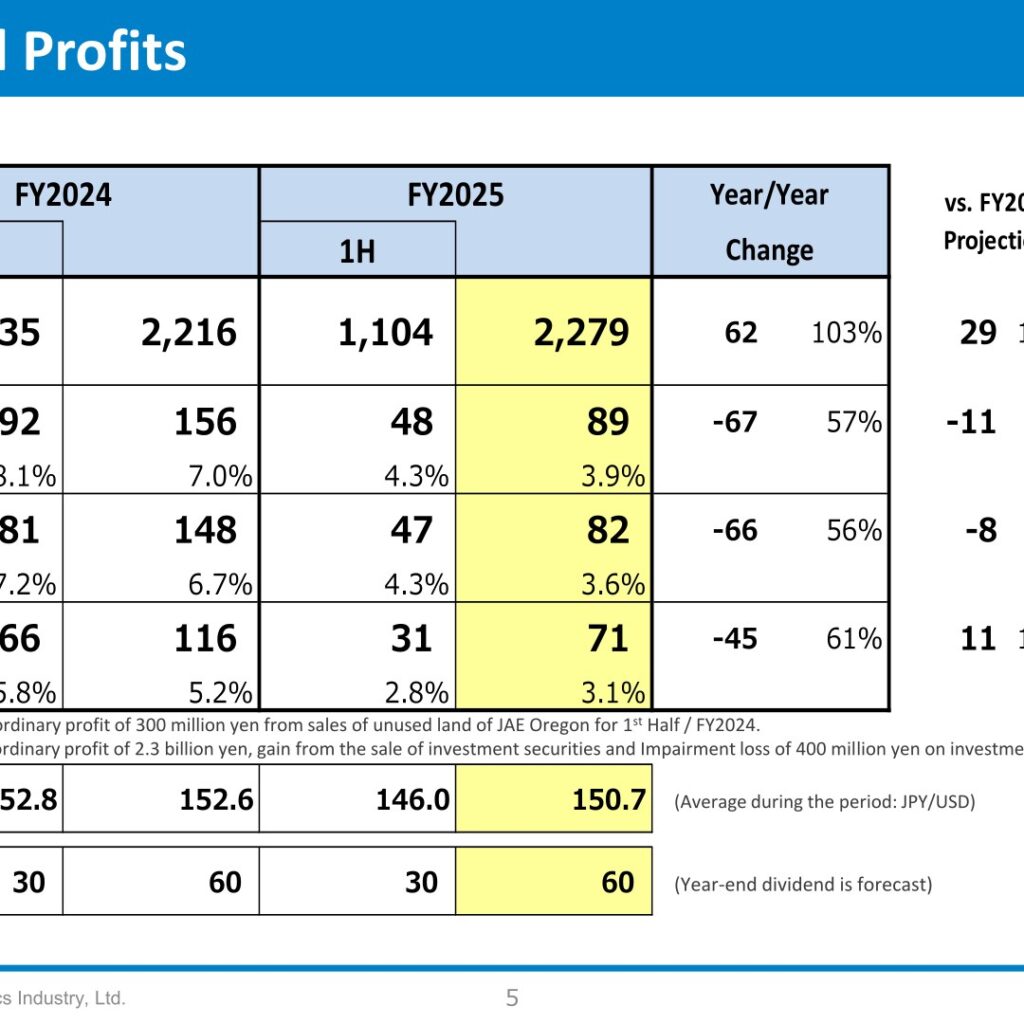
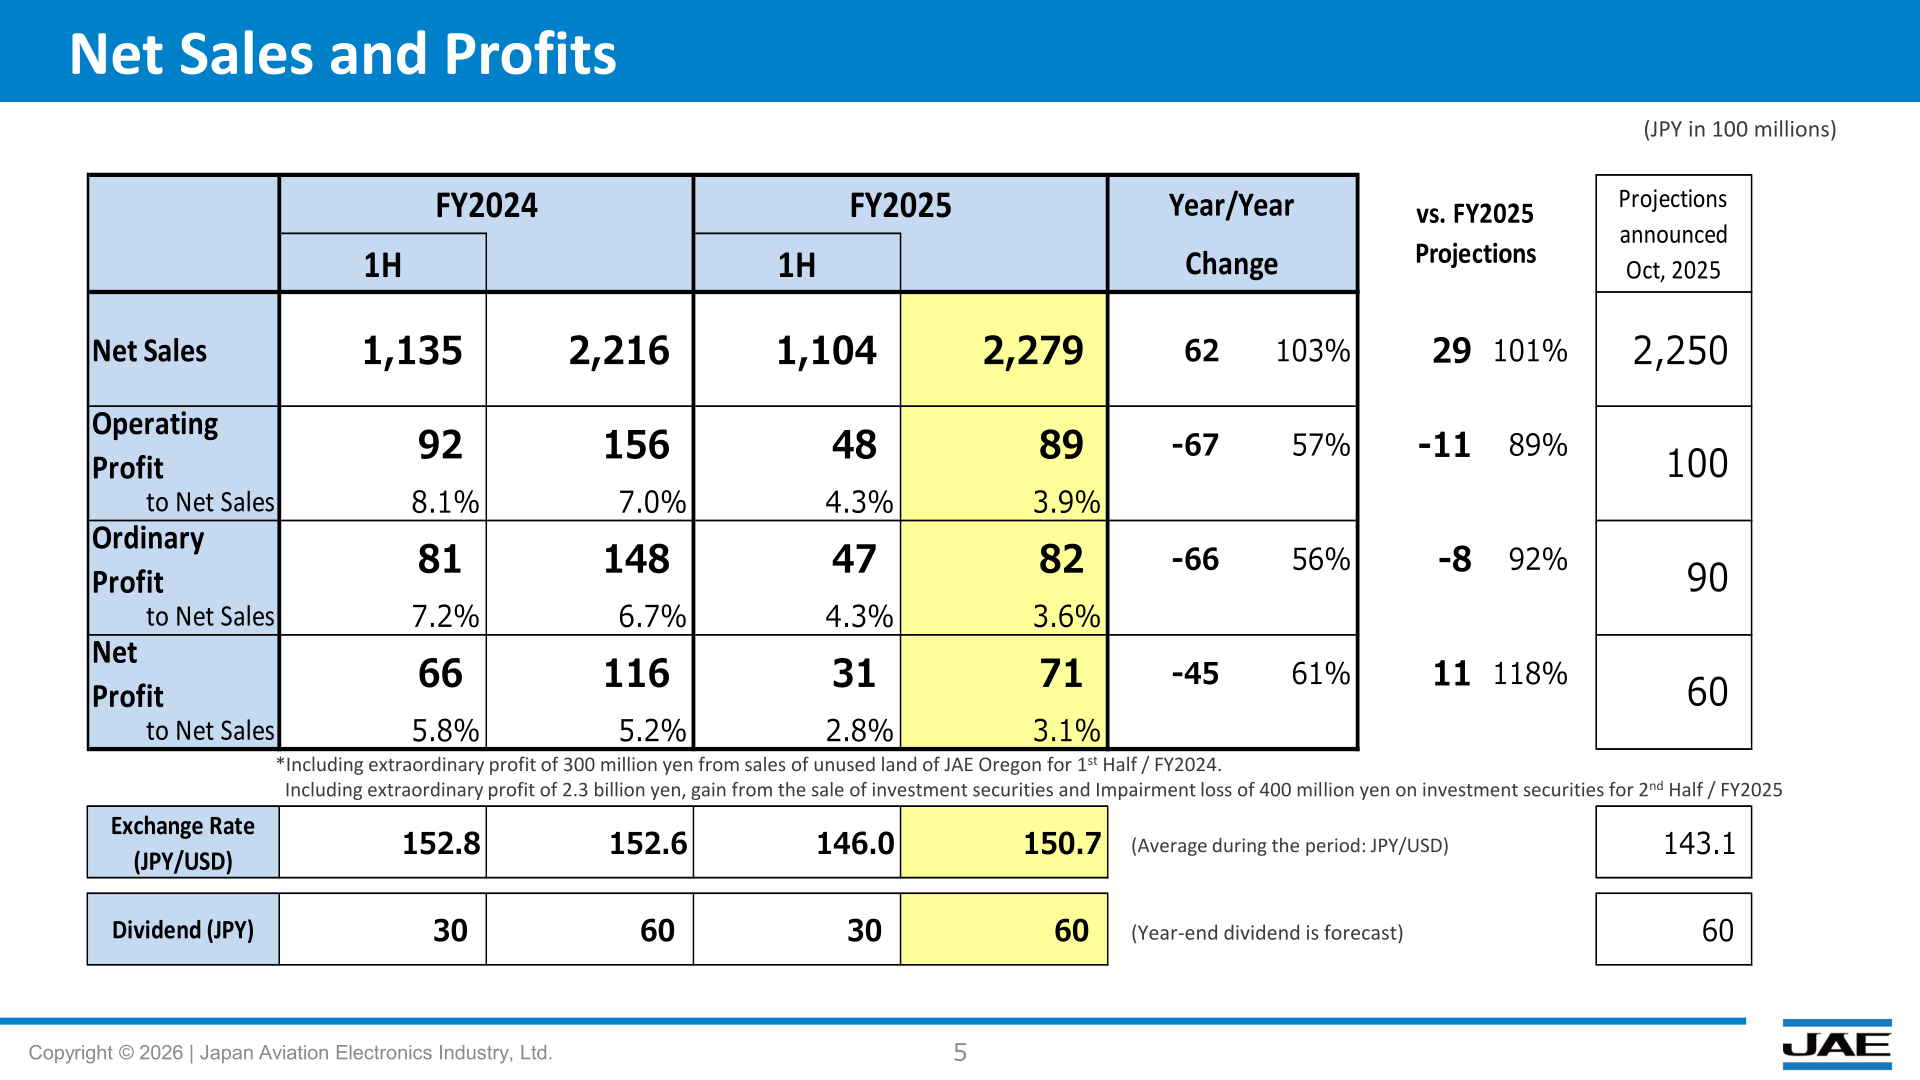
Net sales were 2,279 (JPY in 100 millions; the same unit applies to the tables below), up 62 from 2,216 in FY2024 (103% year-on-year). Operating profit fell to 89 from 156 (57%), with the operating margin declining to 3.9% from 7.0%. Ordinary profit was 82 versus 148 (56%), and net profit was 71 versus 116 (61%). The average exchange rate for FY2025 was 150.7 JPY/USD, compared with 152.6 in FY2024. The company notes that the FY2024 first half includes an extraordinary profit of 300 million yen from sales of unused land of JAE Oregon, and that the FY2025 second half includes an extraordinary profit of 2.3 billion yen, a gain from the sale of investment securities, and an impairment loss of 400 million yen on investment securities.
| Item (JPY in 100 millions) | FY2024 | FY2025 | Year/Year Change | Projections announced Oct 2025 |
|---|---|---|---|---|
| Net Sales | 2,216 | 2,279 | 62 (103%) | 2,250 |
| Operating Profit | 156 | 89 | -67 (57%) | 100 |
| Ordinary Profit | 148 | 82 | -66 (56%) | 90 |
| Net Profit | 116 | 71 | -45 (61%) | 60 |
| Exchange Rate (JPY/USD) | 152.6 | 150.7 | — | 143.1 |
Segment Results
In the Connector Business, net sales were 1,992 (103% year-on-year). USB Type-C for ICT devices grew while revenue for smartphones decreased year-on-year; in automotive, sales increased primarily driven by ADAS products for major Japanese customers despite declining demand in Europe; and industrial & infrastructure grew on market recovery in the second half of the fiscal year. Connector segment profit decreased by 5.79 billion yen from the previous year to 118.7, due to the surge of raw material costs, declining selling prices, deterioration in product mix, and higher costs related to new product launches. In the UIS Business, net sales were 77 (86%) as the automotive business scale shrank and industrial & infrastructure declined on delayed demand recovery; segment profit decreased by 180 million yen to 1.4. In the Aerospace Business, net sales were 205 (106%): revenue from sensors for oil drilling declined due to low crude oil prices, while aviation & space revenue grew significantly, driven by expansion in defense budgets. Aerospace segment profit decreased by 360 million yen to 21.9 due to an unfavorable sales mix, with private-sector sales down and public-sector sales up.
| Segment | Metric (JPY in 100 millions) | FY2024 | FY2025 | Year/Year Change |
|---|---|---|---|---|
| Connector | Sales | 1,928 | 1,992 | 64 (103%) |
| Connector | Segment Profit | 176.5 | 118.7 | -57.9 (67%) |
| UIS | Sales | 90 | 77 | -13 (86%) |
| UIS | Segment Profit | 3.2 | 1.4 | -1.8 (45%) |
| Aerospace | Sales | 193 | 205 | 12 (106%) |
| Aerospace | Segment Profit | 25.5 | 21.9 | -3.6 (86%) |
| Unallocatable cost/ Others | Segment Profit | -49.1 | -52.6 | -3.5 |
| Total | Sales | 2,216 | 2,279 | 62 (103%) |
| Total | Operation Profit | 156.2 | 89.4 | -66.8 (57%) |
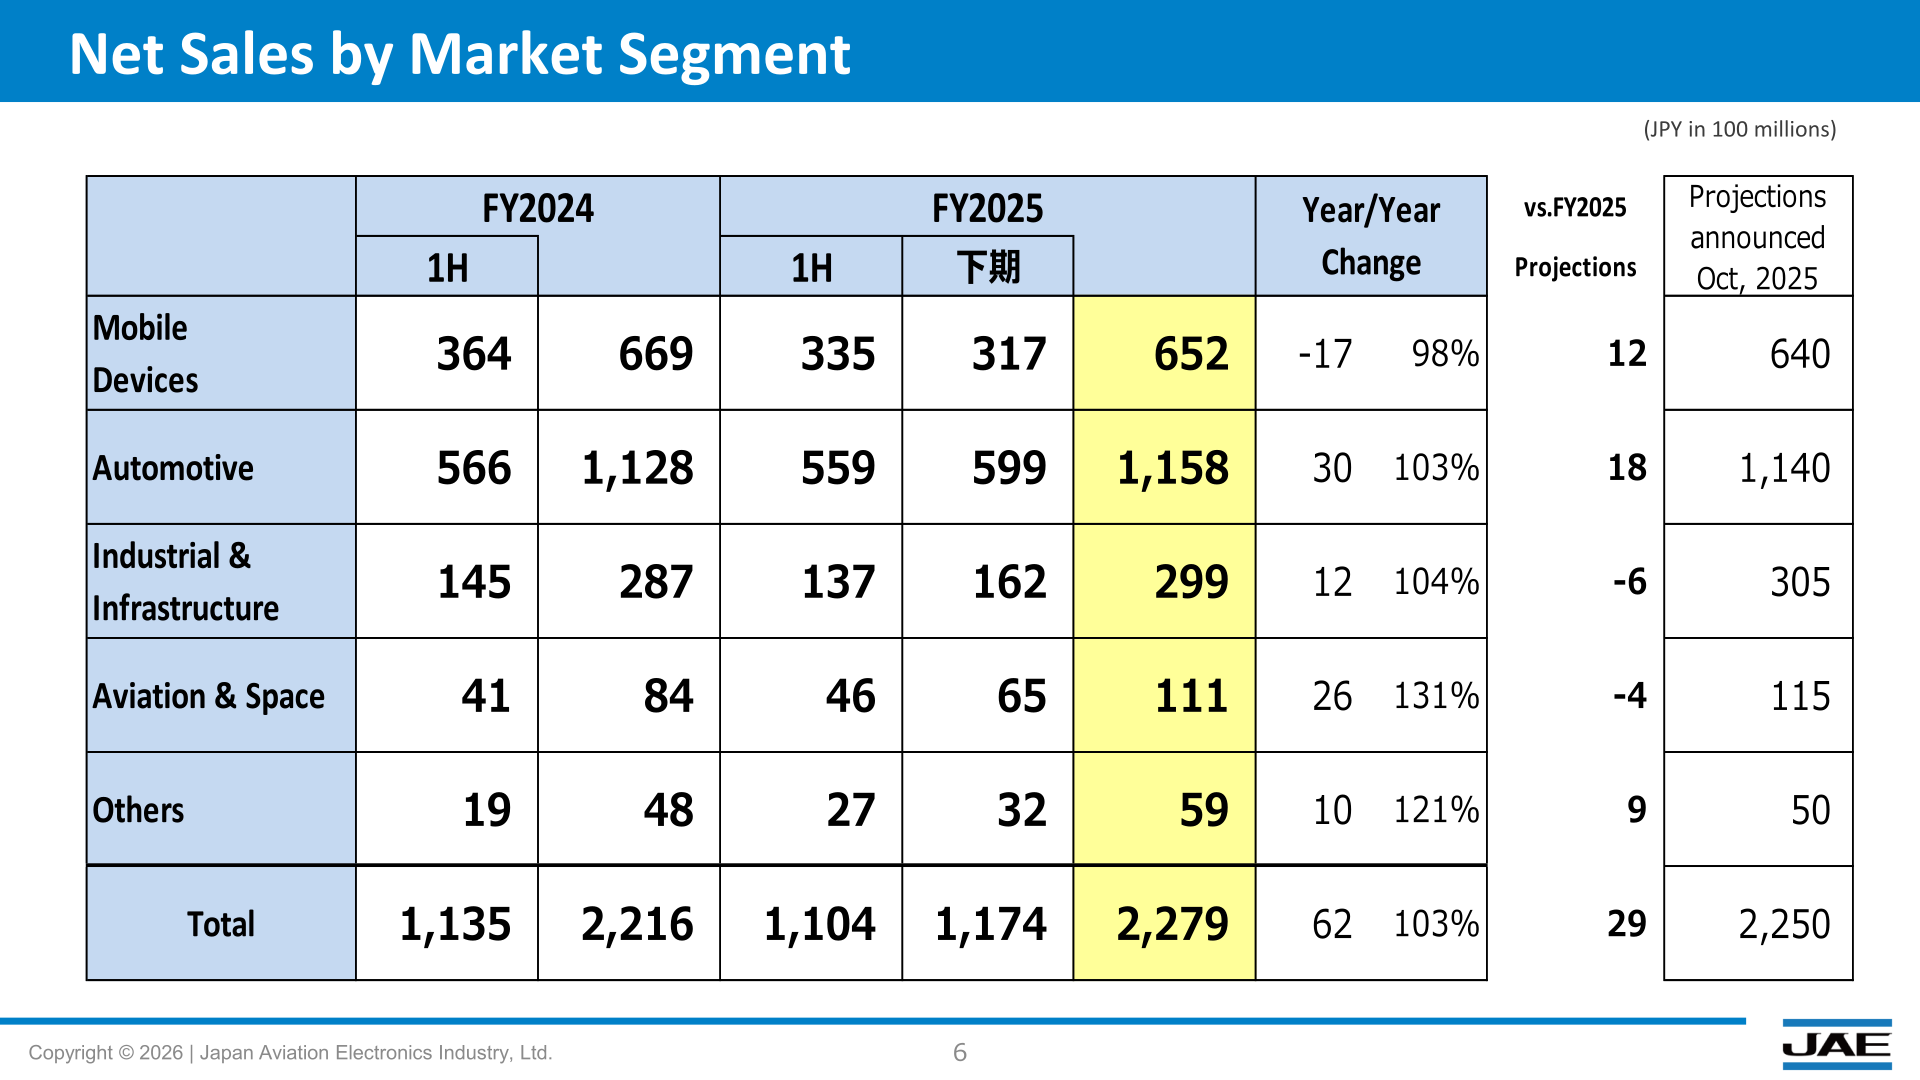
By market segment, net sales were: Mobile Devices 652 (98% year-on-year), Automotive 1,158 (103%), Industrial & Infrastructure 299 (104%), Aviation & Space 111 (131%), and Others 59 (121%).
FY2026 Forecast
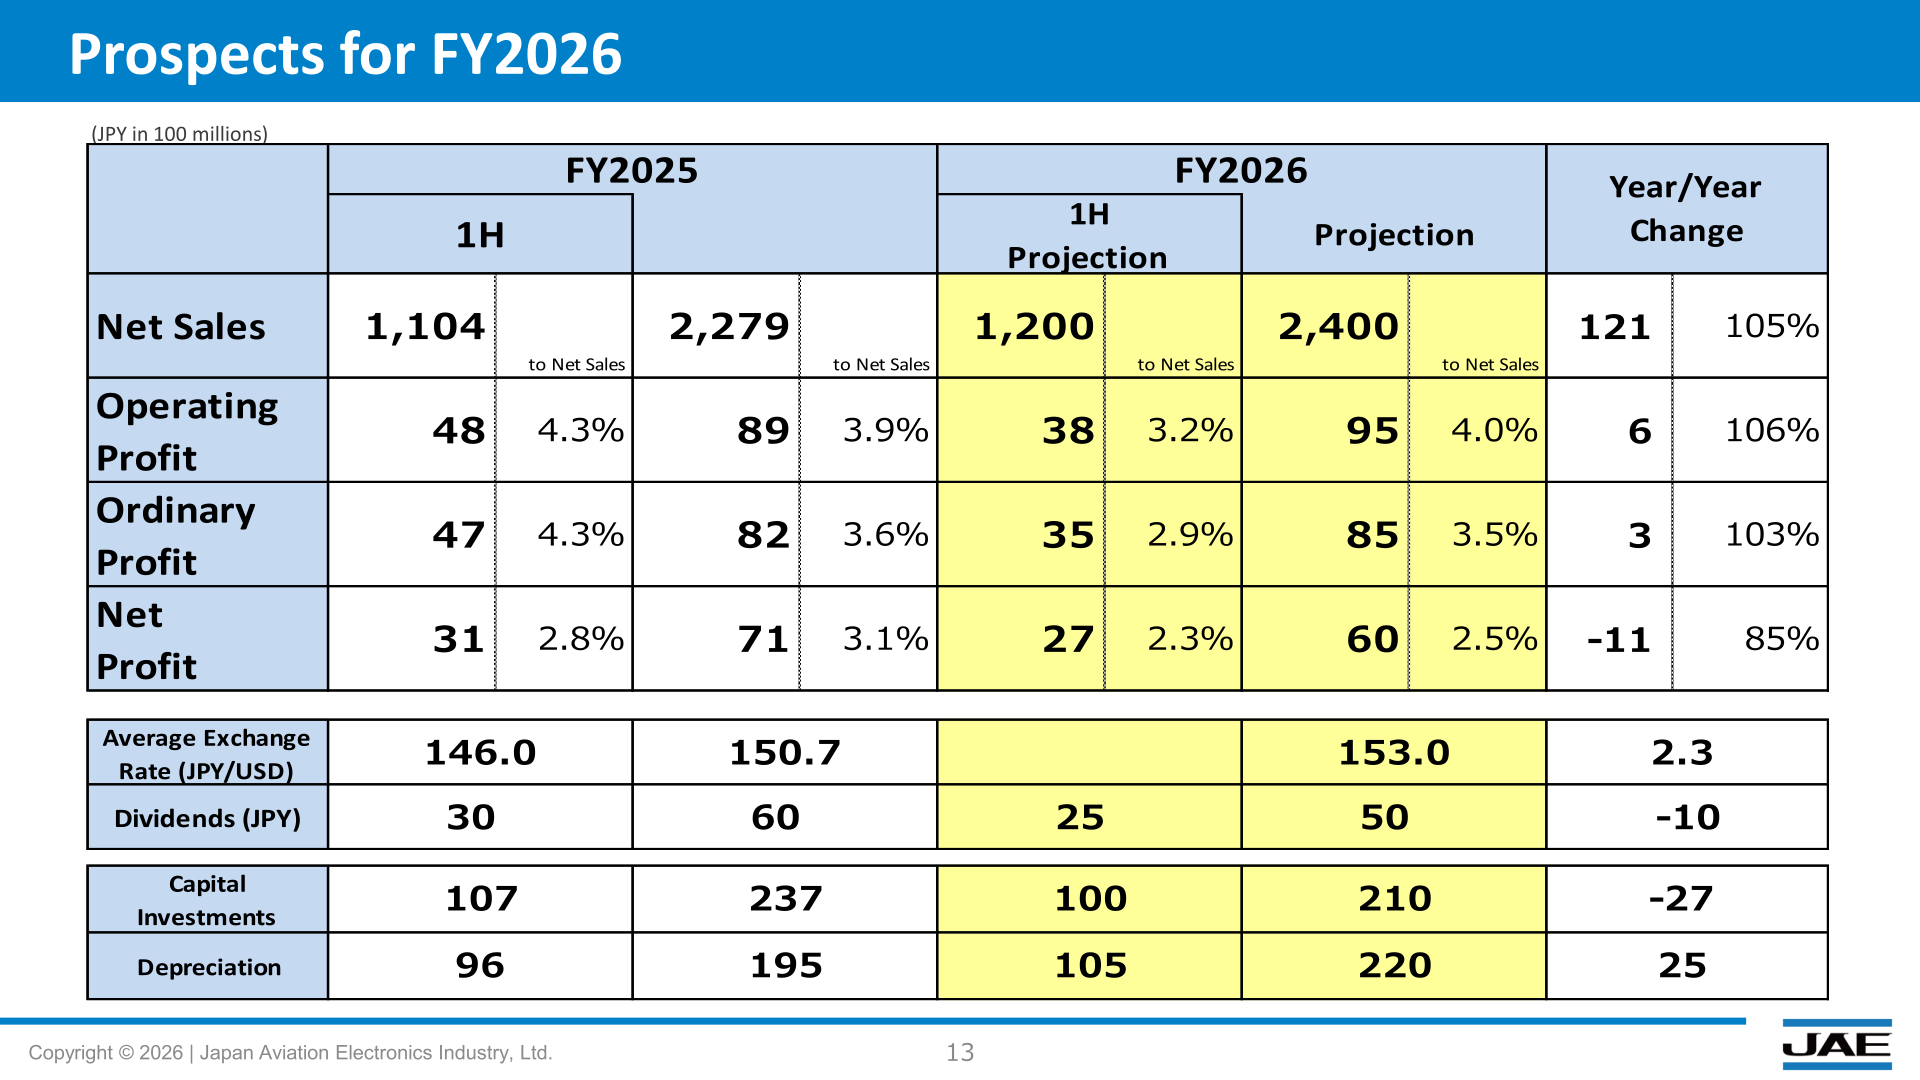
For FY2026, JAE projects net sales of 2,400 (105% year-on-year), operating profit of 95 (106%), ordinary profit of 85 (103%), and net profit of 60 (85%), assuming an average exchange rate of 153.0 JPY/USD. On market trends, the company notes that demand for high-end smartphones remains generally solid while parts of the market are affected by supply shortages in memory devices; demand from Japanese automotive customers remains strong; industrial and infrastructure recovery was made mainly on semiconductor manufacturing equipment and factory automation products, driven by AI demand; and in aviation & space, solid demand continues amid the expansion of Japan’s defense budget, with demand in the space sector, including U.S. satellite-related applications, on an upward trend. Regarding the situation in the Middle East, the company states that the financial impact on performance is difficult to assess at this point of time and that it will provide an updated disclosure if significant impacts on the performance forecast are expected.
| Item (JPY in 100 millions) | FY2025 | FY2026 Projection | Year/Year Change |
|---|---|---|---|
| Net Sales | 2,279 | 2,400 | 121 (105%) |
| Operating Profit | 89 | 95 | 6 (106%) |
| Ordinary Profit | 82 | 85 | 3 (103%) |
| Net Profit | 71 | 60 | -11 (85%) |
| Average Exchange Rate (JPY/USD) | 150.7 | 153.0 | 2.3 |
| Capital Investments | 237 | 210 | -27 |
| Depreciation | 195 | 220 | 25 |
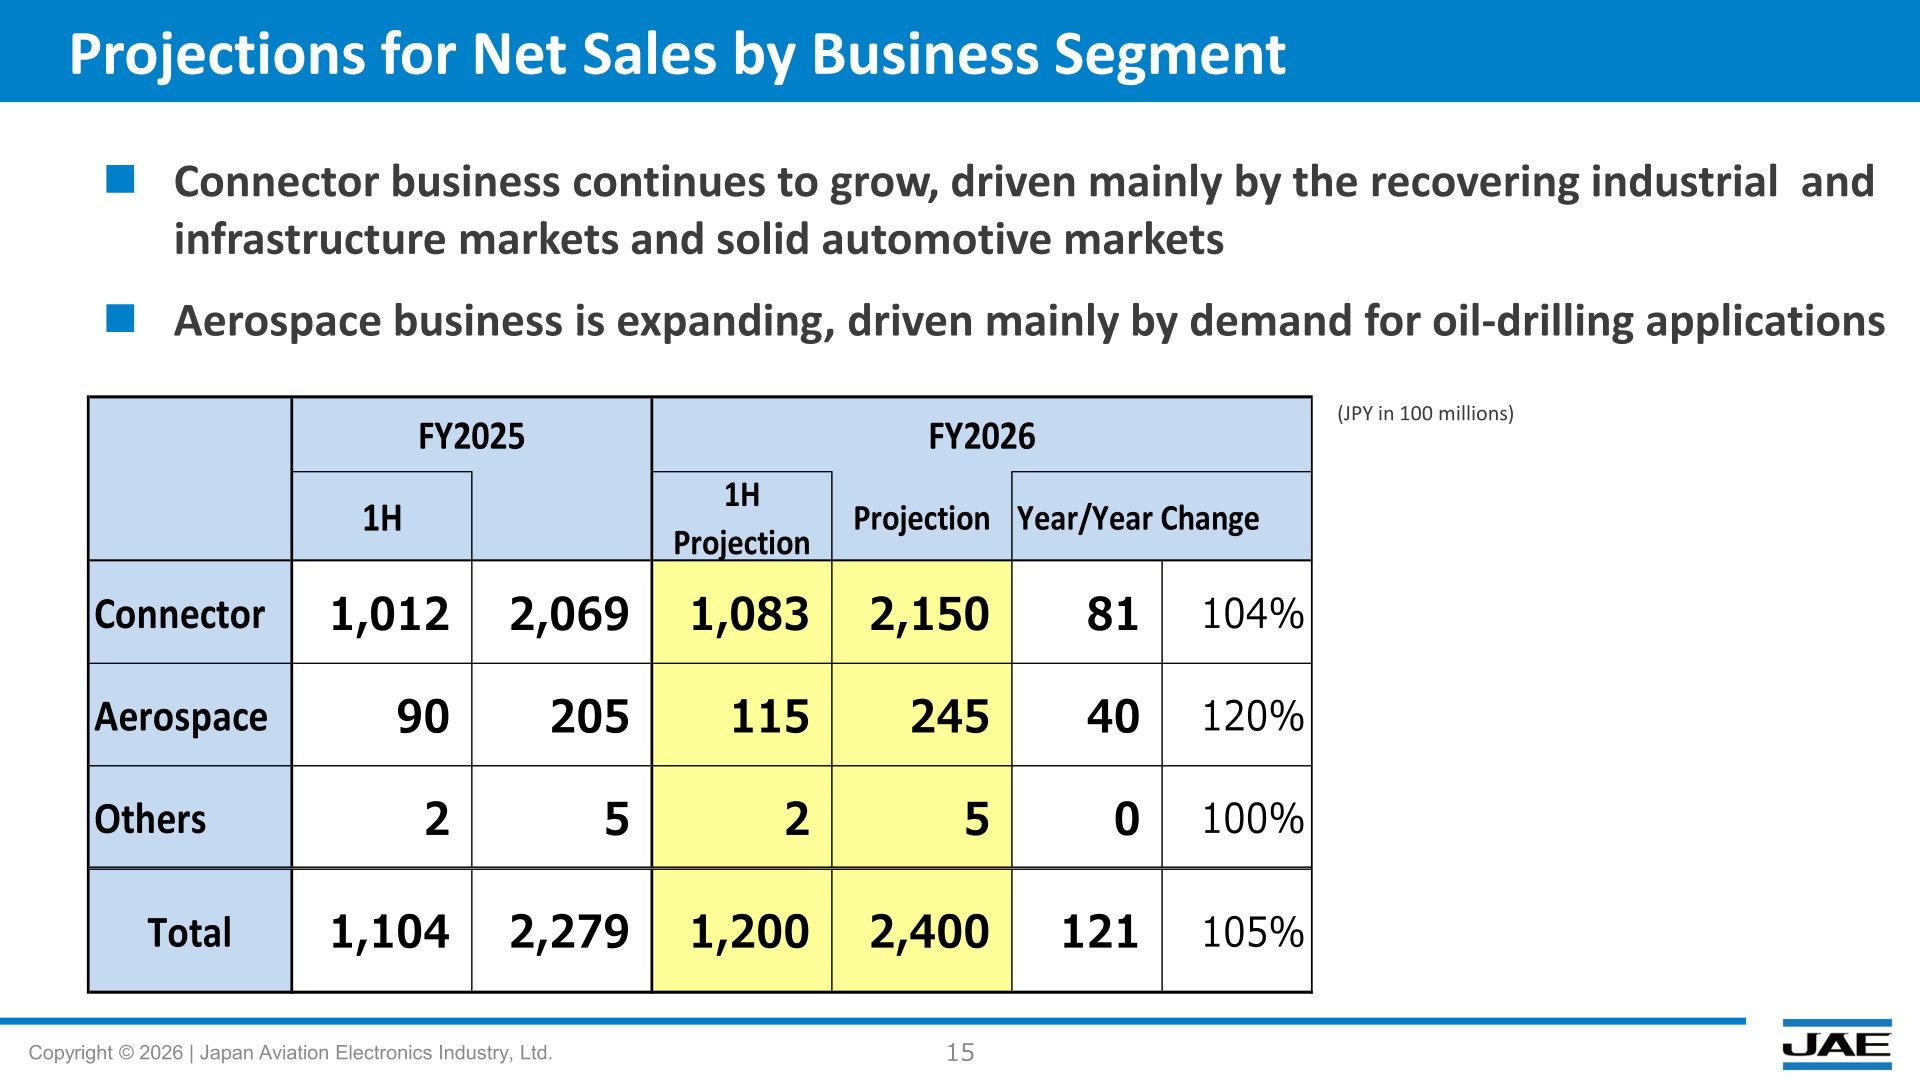
From FY2026, JAE has changed its reporting segments: as the User Interface Solutions Business has been declining in scale, it has been merged into the Connector Business to improve efficiency by consolidating management resources. Under the new classification, the company projects Connector sales of 2,150 (104% versus the combined FY2025 figure of 2,069) and Aerospace sales of 245 (120%). The Connector business is expected to continue growing, driven mainly by the recovering industrial and infrastructure markets and solid automotive markets, while the Aerospace business is expanding, driven mainly by demand for oil-drilling applications. By market segment, projections are: Mobile Devices 600 (92%), Automotive 1,230 (106%), Industrial & Infrastructure 400 (134%), Aviation & Space 130 (117%), and Others 40 (68%). For operating profit, the company expects the impact of persistently high raw material costs and increased depreciation expenses due to growth investments, as well as higher personnel and IT costs, to be outweighed by profit-boosting effects from increased sales, higher selling prices and improvement in product mix, cost reduction initiatives, and the elimination of new product launch costs.
Cash Flows and Financial Position
Net cash provided by operating activities was 170, down 194 from 363 in FY2024, and net cash used in investing activities was -244, resulting in free cash flows of -74 (versus 171 in FY2024). Interest-bearing debt increased by 48 to 418. Total assets were 2,321, equity was 1,442, and the equity ratio was 62.1% (up 0.1pt from 62.0%).
| Item (JPY in 100 millions) | FY2024 | FY2025 | Difference |
|---|---|---|---|
| Net cash provided by (used in) operating activities | 363 | 170 | -194 |
| Net cash provided by (used in) investing activities | -192 | -244 | -52 |
| Free Cash Flows | 171 | -74 | -245 |
| Interest-bearing Debt | 370 | 418 | 48 |
| Total assets | 2,154 | 2,321 | 167 |
| Equity | 1,336 | 1,442 | 107 |
| Equity ratio | 62.0% | 62.1% | 0.1pt |
Shareholder Returns
The dividend for FY2025 is 60 yen per share (of which 30 yen is the interim dividend; the materials note that the year-end dividend is a forecast), unchanged from 60 yen in FY2024 and in line with the projections announced in October 2025. For FY2026, JAE projects an annual dividend of 50 yen per share (of which 25 yen at the first half), a decrease of 10 yen from FY2025.
This article is an analysis based on publicly available information and is not a recommendation to buy or sell any specific securities. Investment decisions are your own responsibility.
![[Obayashi] Investors’ Guide 2026 — The Complete 24-Article Breakdown](https://japan-equity.com/wp-content/uploads/2026/07/hub_cover-1024x1024.png)
![[Obayashi] IR & SR Policy — Feeding Dialogue Back into Management](https://japan-equity.com/wp-content/uploads/2026/07/p32_sq-1024x1024.jpg)
![[Obayashi] Real Estate Development — 18.7% Margin, ¥287.7bn Unrealized Gains](https://japan-equity.com/wp-content/uploads/2026/07/p20_sq-1024x1024.jpg)
![[Obayashi] Domestic Civil Engineering — Resilience Spending Supports 9.6% Margin](https://japan-equity.com/wp-content/uploads/2026/07/p11_sq-1024x1024.jpg)
![[Obayashi] Share Price & External Ratings — vs TOPIX, ESG Index Inclusion](https://japan-equity.com/wp-content/uploads/2026/07/p40_sq-1024x1024.jpg)
![[Construction] ¥75.5tn Investment, Shrinking Workforce — Big-5 Market Share](https://japan-equity.com/wp-content/uploads/2026/07/p12_sq-1024x1024.jpg)



![[Obayashi] Capital Policy & Shareholder Returns — ROE 10%+, DOE ~5%, ¥100bn Buyback](https://japan-equity.com/wp-content/uploads/2026/07/p27_sq-1024x1024.jpg)
![[Obayashi] Reducing Cross-Shareholdings — ¥285.2bn Sold in Five Years](https://japan-equity.com/wp-content/uploads/2026/07/p29_sq-1024x1024.jpg)
![[Obayashi] ¥750bn Investment Plan — ¥300bn to Development, ¥190bn to Tech/DX](https://japan-equity.com/wp-content/uploads/2026/07/p30_sq-1024x1024.jpg)
![[Obayashi] MTP2022 KPIs — Operating Profit ~2x Target, ROE 14.4%](https://japan-equity.com/wp-content/uploads/2026/07/p25_sq-1024x1024.jpg)
![[Obayashi] Cash Allocation — ¥420bn Investment CF Over Five Years](https://japan-equity.com/wp-content/uploads/2026/07/p26_sq-1024x1024.jpg)
![[Obayashi] Green Energy — 44 Plants, 344MW, and the Green Hydrogen Challenge](https://japan-equity.com/wp-content/uploads/2026/07/p21_sq-1024x1024.jpg)
![[Obayashi] Tackling the Labor Shortage — Robotics Construction®](https://japan-equity.com/wp-content/uploads/2026/07/p14_sq-1024x1024.jpg)
