
This article is based on publicly available IR materials and is not a recommendation to buy or sell any specific securities.
Note: Mabuchi Motor’s fiscal year ends on December 31; the company labels the period covered here as “2025” (fiscal year ended December 31, 2025), which this site classifies as FY2025. Mabuchi Motor Co., Ltd. (6592) released its “Full-Year Results Briefing for Fiscal Year Ended December 31, 2025” briefing materials dated February 13, 2026. Net sales rose 2.1% year on year to ¥200.417 billion, surpassing ¥200 billion for the first time and reaching a record high, and operating income increased 17.7% to ¥25.467 billion; net profit also rose to a new record, with profit attributable to owners of parent up 104.8% to ¥26.2 billion. For 2026 the company forecasts net sales of ¥213.0 billion (up 6.3%) and operating income of ¥26.0 billion (up 2.1%), expecting higher sales and profit supported by contributions from M&A. The 2025 dividend forecast was raised to ¥106 per share (¥53 on a split-adjusted basis; record high), the 2026 dividend is expected to be ¥56 per share (record high), and treasury stock will be acquired with an upper limit of ¥19.0 billion/24.0 million shares in 2026, for an expected total return ratio of 150.2% in 2026.
Consolidated Results (Full-Year Actual, 2025)
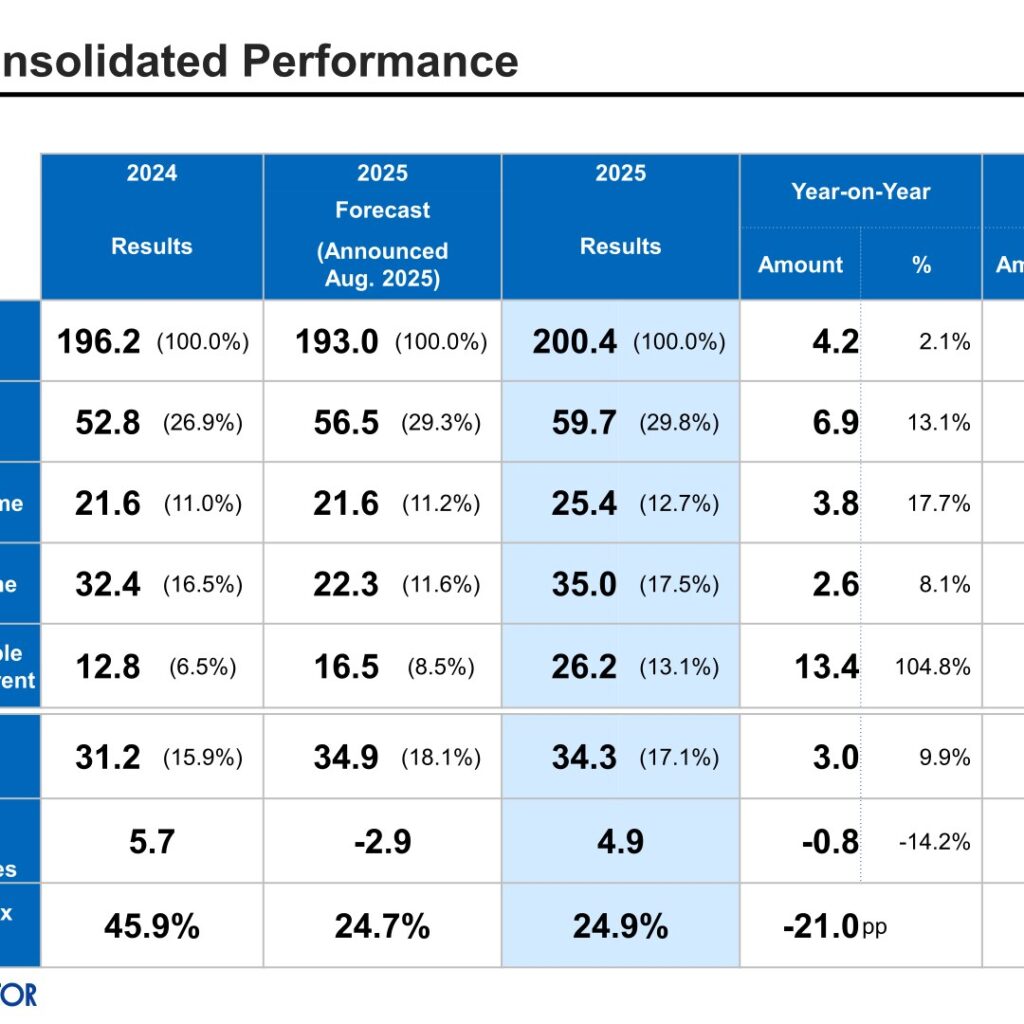
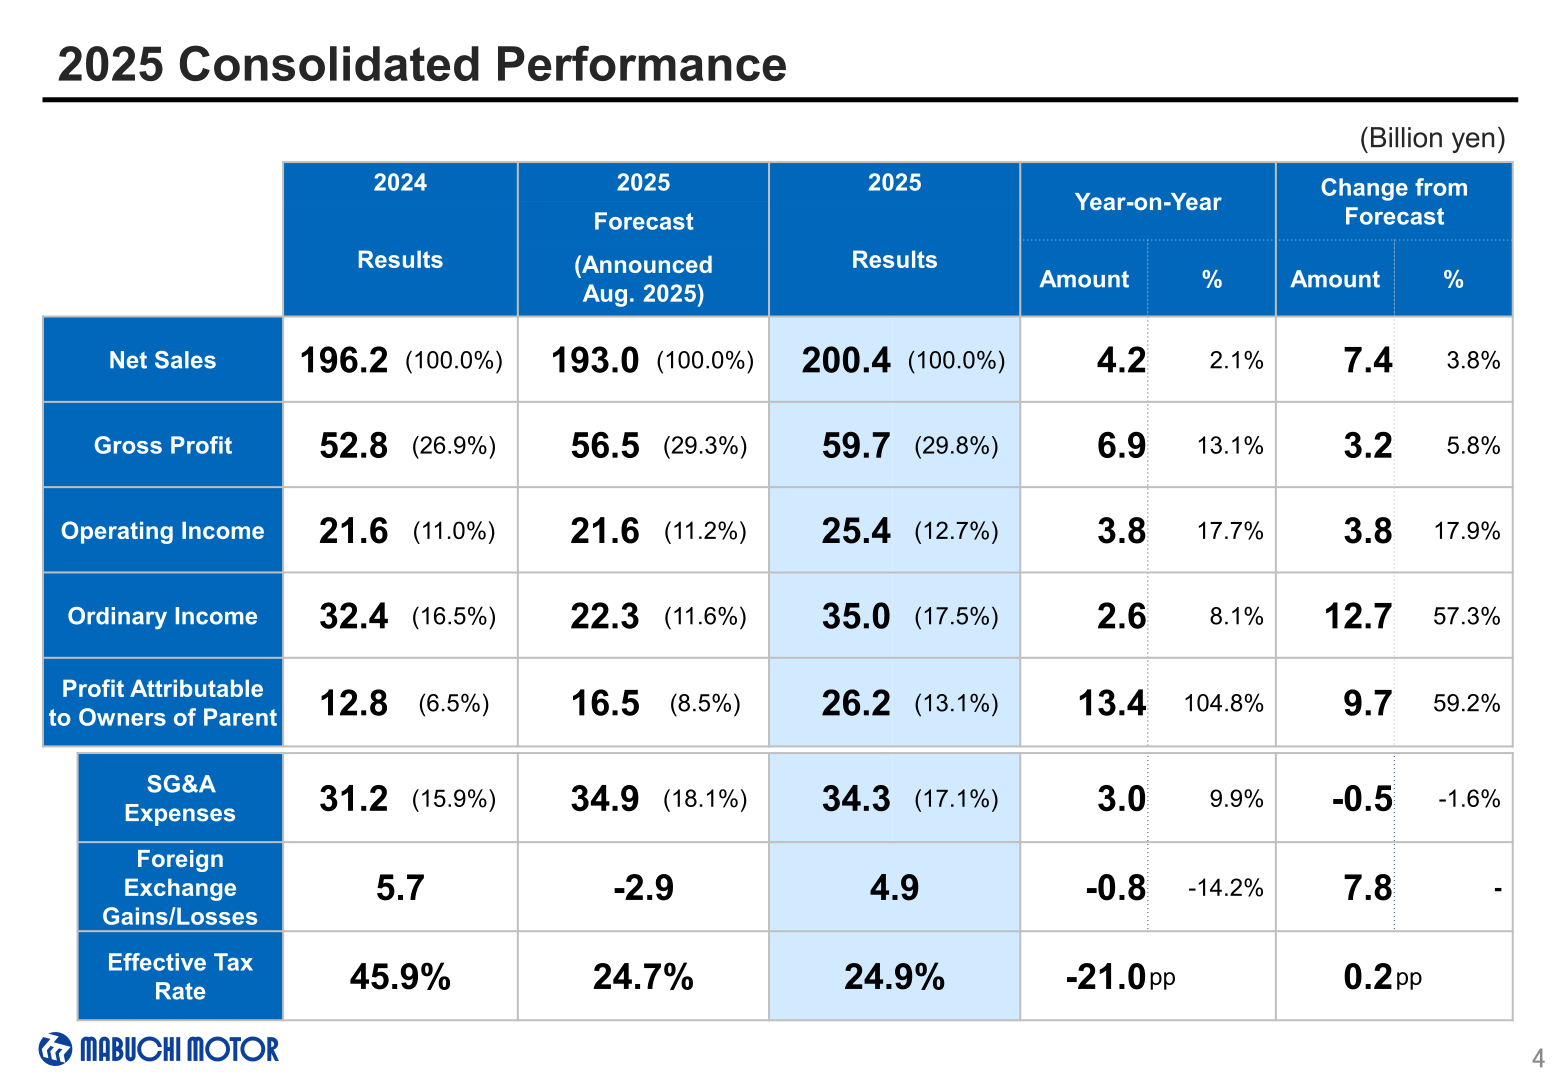
Net sales were ¥200.4 billion, up ¥4.2 billion (2.1%) from ¥196.2 billion in 2024 and ¥7.4 billion (3.8%) above the forecast announced in August 2025 (¥193.0 billion). Gross profit was ¥59.7 billion (29.8% of net sales), up 13.1% year on year. Operating income was ¥25.4 billion (12.7% margin), up ¥3.8 billion (17.7%) year on year and ¥3.8 billion (17.9%) above the August forecast of ¥21.6 billion. Ordinary income was ¥35.0 billion (up 8.1%) and profit attributable to owners of parent was ¥26.2 billion (up ¥13.4 billion, 104.8%). SG&A expenses were ¥34.3 billion (up 9.9%), foreign exchange gains were ¥4.9 billion (¥5.7 billion in 2024), and the effective tax rate fell to 24.9% from 45.9%. For automotive products, sales of motors for mirrors and door lock actuators increased, and sales of motors for new applications also rose, including motors for grille shutter actuators and flush fillers. Sales of life and industrial products increased with the addition of Mabuchi OB Gear System and Mabuchi Micro Tech to the Mabuchi Group, in addition to steady sales of motors for health and medical care. Operating income increased due to factors contributing to higher profit such as improvements in selling prices and the product mix, which more than offset factors that caused a decline in profit such as cost increases.
| Item (Billion yen) | 2024 Results | 2025 Forecast (Aug. 2025) | 2025 Results | YoY Amount | YoY % | vs. Forecast Amount | vs. Forecast % |
|---|---|---|---|---|---|---|---|
| Net Sales | 196.2 | 193.0 | 200.4 | 4.2 | 2.1% | 7.4 | 3.8% |
| Gross Profit | 52.8 (26.9%) | 56.5 (29.3%) | 59.7 (29.8%) | 6.9 | 13.1% | 3.2 | 5.8% |
| Operating Income | 21.6 (11.0%) | 21.6 (11.2%) | 25.4 (12.7%) | 3.8 | 17.7% | 3.8 | 17.9% |
| Ordinary Income | 32.4 (16.5%) | 22.3 (11.6%) | 35.0 (17.5%) | 2.6 | 8.1% | 12.7 | 57.3% |
| Profit Attributable to Owners of Parent | 12.8 (6.5%) | 16.5 (8.5%) | 26.2 (13.1%) | 13.4 | 104.8% | 9.7 | 59.2% |
| SG&A Expenses | 31.2 (15.9%) | 34.9 (18.1%) | 34.3 (17.1%) | 3.0 | 9.9% | -0.5 | -1.6% |
| Foreign Exchange Gains/Losses | 5.7 | -2.9 | 4.9 | -0.8 | -14.2% | 7.8 | – |
| Effective Tax Rate | 45.9% | 24.7% | 24.9% | -21.0pp | – | 0.2pp | – |
Sales quantity was 1,342 million pieces (down 0.4% year on year; up 2.5% versus the forecast) and production quantity was 1,326 million pieces (down 0.2%). The yen was up 1.2% year on year against the U.S. dollar (average ¥149.71 versus ¥151.58 in 2024); it weakened against the euro (¥169.00 versus ¥163.95) and strengthened against the RMB (¥20.96 versus ¥21.29). Exchange rate sensitivity: a ¥1 depreciation resulted in increases of ¥1.18 billion in net sales and ¥0.23 billion in operating income. In the year-on-year operating income bridge from ¥21.6 billion to ¥25.4 billion, selling prices and product mix contributed ¥4.5 billion, commodities prices (copper, steel, precious metals) ¥0.6 billion, foreign exchange ¥0.6 billion and sales quantity ¥0.2 billion, while cost was a negative factor of ¥1.7 billion. Versus the plan announced in August 2025, operating income increased due to cost cutting and an increase in sales quantity, which more than offset negative factors in selling prices and product mix. Net cash provided by operating activities decreased by ¥4.7 billion year on year to ¥35.3 billion, mainly due to an increase in the amount of income taxes paid and other factors, while free cash flow increased by ¥0.4 billion to ¥24.8 billion.
Sales Results by Market
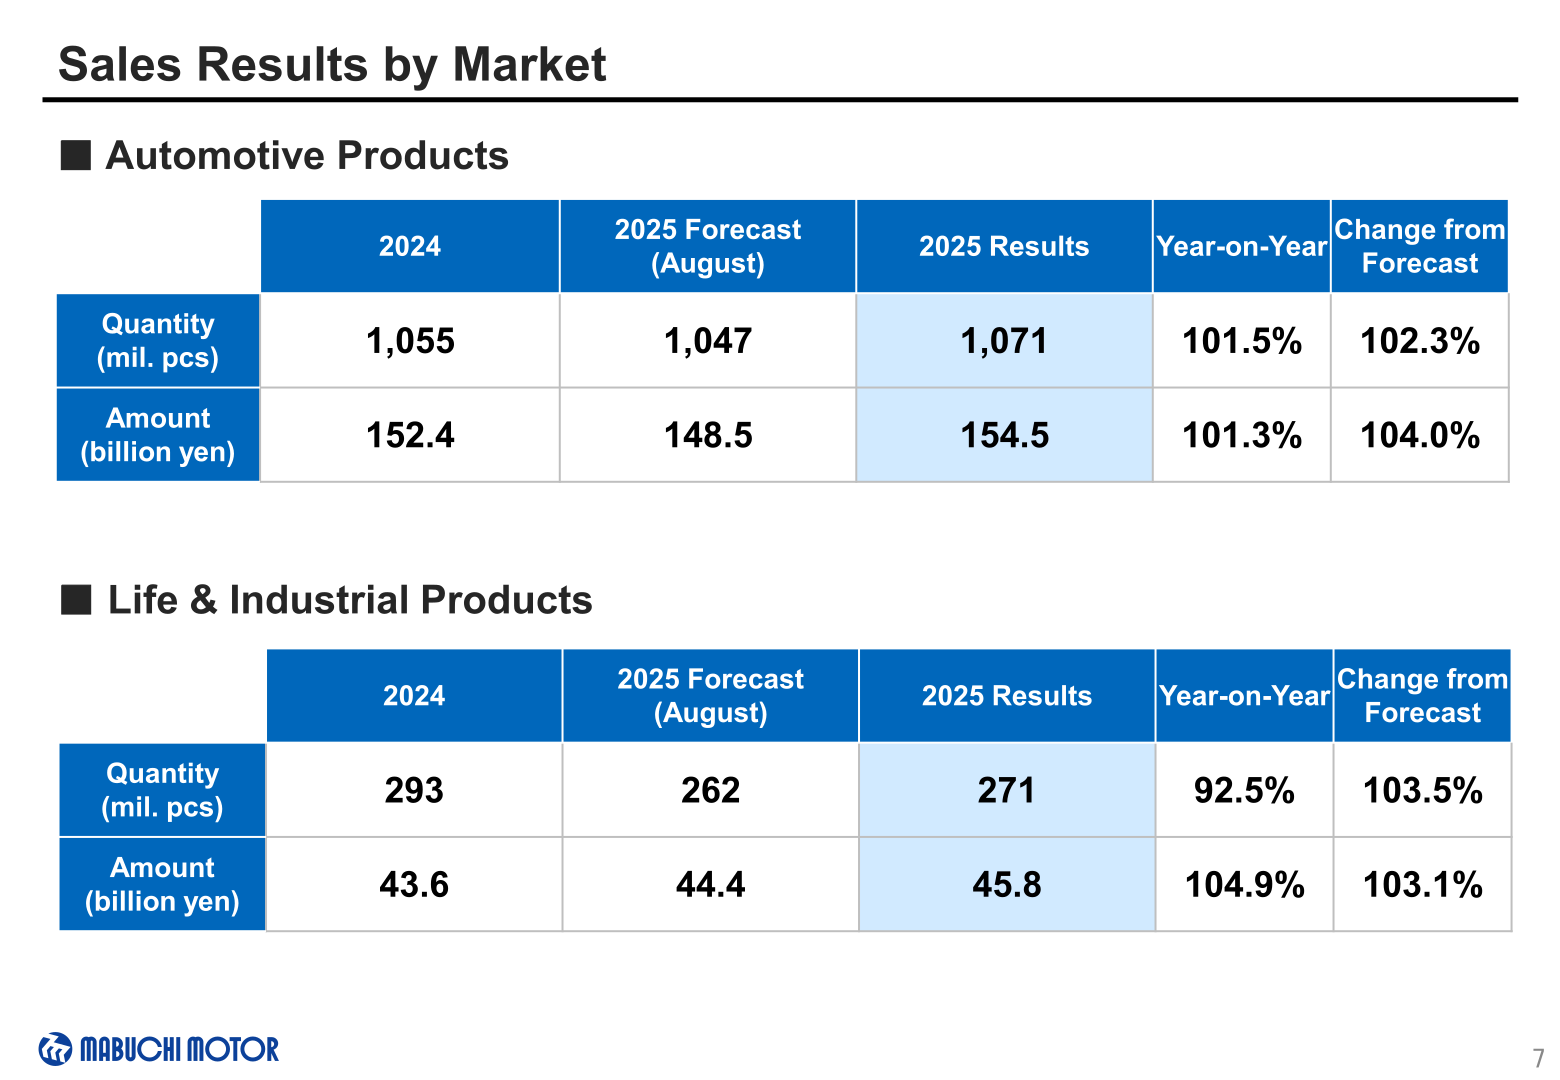
Motor sales (excluding sales of parts and equipment) totaled ¥200.3 billion in 2025 (102.1% year on year, 103.8% of the August forecast), with sales quantity of 1,342 million pieces (99.6%). Automotive Products accounted for 77.1% of motor sales and Life & Industrial Products for 22.9%. Automotive Products sales were ¥154.5 billion (101.3% year on year; 104.0% of forecast) on 1,071 million pieces (101.5%). Life & Industrial Products sales were ¥45.8 billion (104.9% year on year; 103.1% of forecast) on 271 million pieces (92.5%).
Within Automotive Products, medium-sized motors posted sales of ¥76.1 billion (99.5% year on year; 104.7% of forecast). Sales of PW (power window lifter) motors decreased overall due to the end of production and sale of older-generation products at Taiwan Mabuchi and decreasing market shares of some products in China, although PW motor sales increased in the U.S. and Europe; EPB (electric parking brake) motors decreased due to production adjustments at U.S. OEMs; PS (power seat) motors remained nearly unchanged; and motors for valve actuators rose due to increased demand for products for PHEVs. Small motors posted sales of ¥78.3 billion (103.2% year on year; 103.3% of forecast): sales of motors for mirrors and door lock actuators remained steady due to an increase in automobile production, motors for air conditioning damper actuators decreased due to a decline in orders from certain customers, and motors for other applications rose as sales of motors for grille shutter actuators, fuel fillers, etc. increased. In Life & Industrial Products, sales of products for health and medical applications remained strong; sales of products for home appliances, power tools and housing equipment and those for personal care decreased due to the company’s profitability-oriented order acceptance policy; and sales of products for other applications increased due to the inclusion of Mabuchi OB Gear System and Mabuchi Micro Tech into the Mabuchi Group.
| Market | Metric | 2024 | 2025 Forecast (August) | 2025 Results | Year-on-Year | Change from Forecast |
|---|---|---|---|---|---|---|
| Automotive Products | Quantity (mil. pcs) | 1,055 | 1,047 | 1,071 | 101.5% | 102.3% |
| Automotive Products | Amount (billion yen) | 152.4 | 148.5 | 154.5 | 101.3% | 104.0% |
| Automotive Products: Medium-Sized Motors | Amount (billion yen) | 76.5 | 72.7 | 76.1 | 99.5% | 104.7% |
| Automotive Products: Small Motors | Amount (billion yen) | 75.9 | 75.8 | 78.3 | 103.2% | 103.3% |
| Life & Industrial Products | Quantity (mil. pcs) | 293 | 262 | 271 | 92.5% | 103.5% |
| Life & Industrial Products | Amount (billion yen) | 43.6 | 44.4 | 45.8 | 104.9% | 103.1% |
| Total (motor sales) | Quantity (mil. pcs) | 1,348 | 1,310 | 1,342 | 99.6% | 102.5% |
| Total (motor sales) | Amount (billion yen) | 196.1 | 193.0 | 200.3 | 102.1% | 103.8% |
2026 Forecast
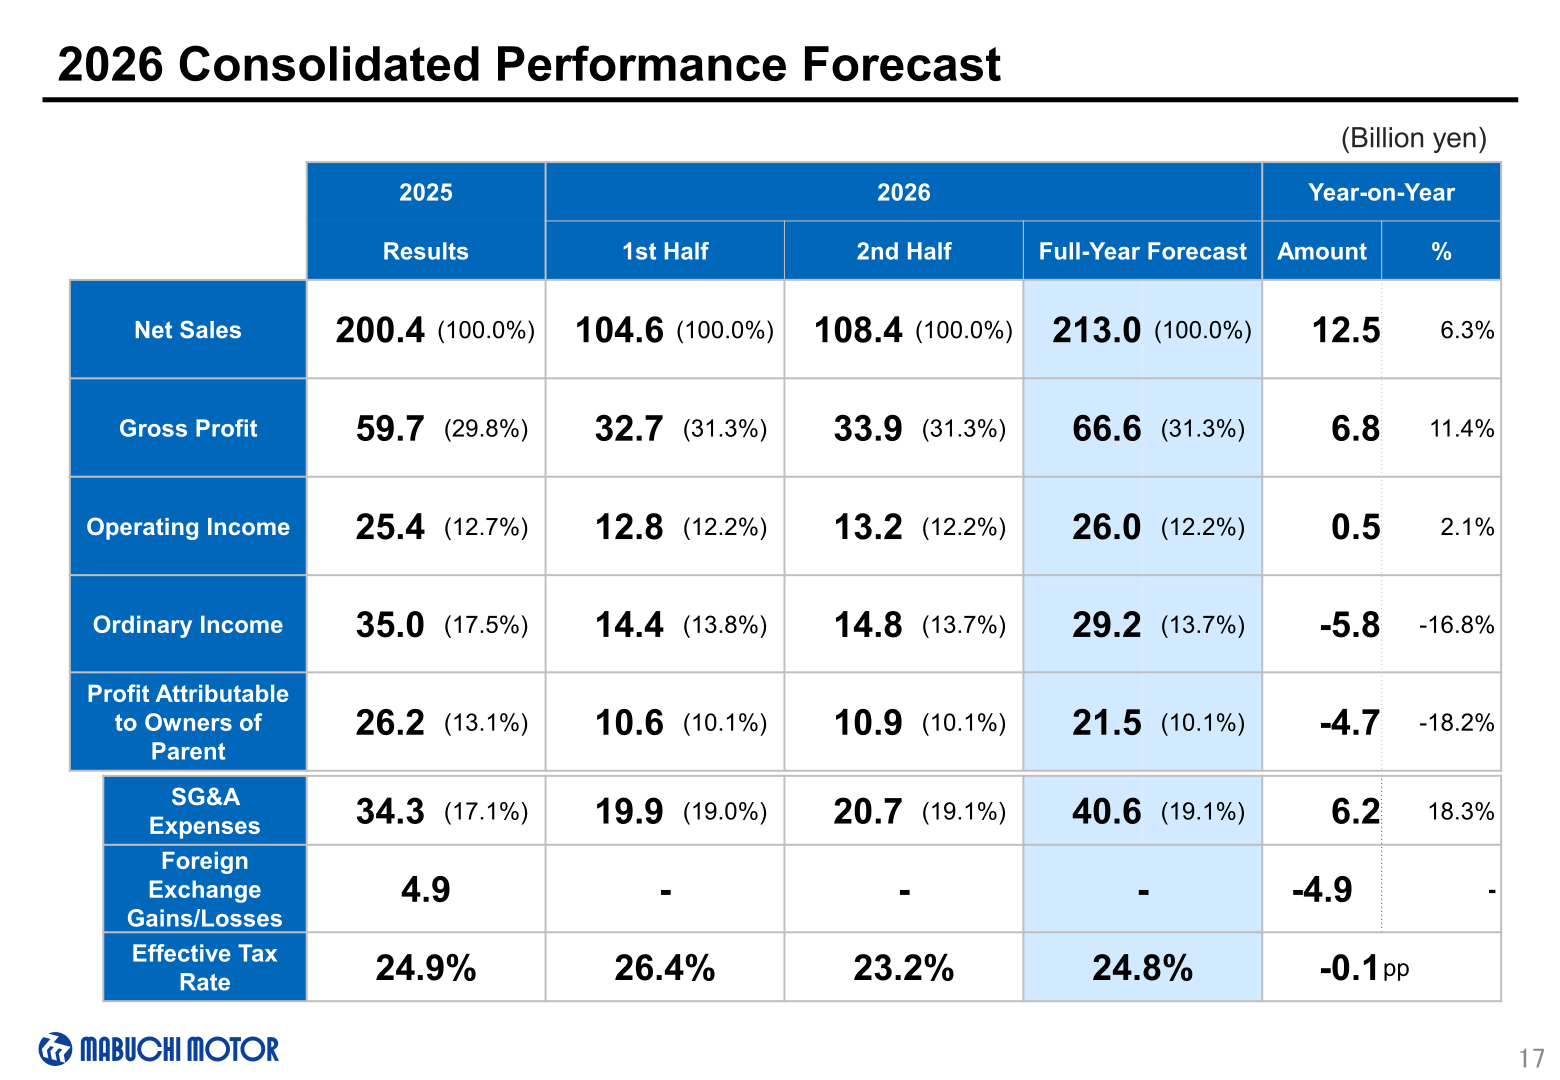
For 2026, the company forecasts net sales of ¥213.0 billion (up ¥12.5 billion, 6.3%), gross profit of ¥66.6 billion (31.3% of net sales, up 11.4%), operating income of ¥26.0 billion (12.2% margin, up ¥0.5 billion, 2.1%), ordinary income of ¥29.2 billion (down 16.8%) and profit attributable to owners of parent of ¥21.5 billion (down ¥4.7 billion, 18.2%). SG&A expenses are forecast at ¥40.6 billion (up 18.3%) and the effective tax rate at 24.8%. The exchange rate projection is ¥150 against the U.S. dollar (with 0.2% year-on-year depreciation), ¥168.54 against the euro and ¥21.13 against the RMB; exchange rate sensitivity is ¥1.27 billion in net sales and ¥0.26 billion in operating income per ¥1 depreciation (full-year basis). Sales quantity is forecast at 1,340 million pieces (down 0.1%) and production quantity at 1,330 million pieces (up 0.4%), excluding subsidiaries integrated through M&A. The sales volume of motors for automotive products is expected to increase slightly, primarily attributed to the scaling back of China’s government subsidy policy and a decline in demand in Europe and the U.S. due to tariff policies, despite the anticipated growth in automobile production in India. Sales of motors for life and industrial products are expected to increase, reflecting steady sales of motors for health and medical care, an increase in sales of motors for machinery and mobility, and the contribution of companies that joined the Group through M&A, although sales of motors for home appliances, power tools, and housing equipment and those for personal care will be sluggish. Operating income is expected to increase mainly due to improvements in selling prices and the product mix (¥8.1 billion positive in the bridge), which will more than offset factors for reducing profit such as an increase in SG&A expenses for growth (cost ¥4.3 billion and commodities prices ¥2.7 billion as negative factors).
| Item (Billion yen) | 2025 Results | 2026 1st Half Forecast | 2026 2nd Half Forecast | 2026 Full-Year Forecast | YoY Amount | YoY % |
|---|---|---|---|---|---|---|
| Net Sales | 200.4 | 104.6 | 108.4 | 213.0 | 12.5 | 6.3% |
| Gross Profit | 59.7 (29.8%) | 32.7 (31.3%) | 33.9 (31.3%) | 66.6 (31.3%) | 6.8 | 11.4% |
| Operating Income | 25.4 (12.7%) | 12.8 (12.2%) | 13.2 (12.2%) | 26.0 (12.2%) | 0.5 | 2.1% |
| Ordinary Income | 35.0 (17.5%) | 14.4 (13.8%) | 14.8 (13.7%) | 29.2 (13.7%) | -5.8 | -16.8% |
| Profit Attributable to Owners of Parent | 26.2 (13.1%) | 10.6 (10.1%) | 10.9 (10.1%) | 21.5 (10.1%) | -4.7 | -18.2% |
| SG&A Expenses | 34.3 (17.1%) | 19.9 (19.0%) | 20.7 (19.1%) | 40.6 (19.1%) | 6.2 | 18.3% |
| Effective Tax Rate | 24.9% | 26.4% | 23.2% | 24.8% | -0.1pp | – |
| USD (average during the period) | ¥149.71 | ¥150.00 | ¥150.00 | ¥150.00 | 0.29 | 0.2% |
By market, 2026 sales are forecast at ¥159.2 billion for Automotive Products (103.0% year on year; 1st half ¥78.7 billion, 107.3%; 2nd half ¥80.4 billion, 99.1%) and ¥53.7 billion for Life & Industrial Products (117.4%; 1st half ¥25.8 billion, 120.2%; 2nd half ¥27.9 billion, 114.9%), for a total of ¥213.0 billion (106.3%), with Automotive Products at 74.8% and Life & Industrial Products at 25.2% of sales. Automotive medium-sized motors are forecast at ¥80.7 billion (106.0%): sales of PW motors for Chinese OEMs will decrease but those for Japanese and U.S. OEMs will increase; PS motors will increase significantly, chiefly due to Japanese customers and the beginning of sales to new European customers; and valve actuator products will increase due in part to new projects for European and U.S. OEMs. Automotive small motors are forecast at ¥78.4 billion (100.1%), with motors for mirrors, door lock actuators and air conditioning damper actuators forecast to be steady and sales of motors for SVS (seat ventilation systems) and grill shutter actuators, etc. to increase. Life & Industrial Products are forecast at ¥53.7 billion (117.4%): products for health and medical applications will remain strong due to the expansion of applications, and sales of products for other applications are expected to increase significantly due to mobility and machinery applications and the companies that have joined the Group via mergers and acquisitions.
| Market | 2025 Results (billion yen) | 2026 Forecast (billion yen) | Year-on-Year |
|---|---|---|---|
| Automotive Products | 154.5 | 159.2 | 103.0% |
| Automotive Products: Medium-Sized Motors | 76.1 | 80.7 | 106.0% |
| Automotive Products: Small Motors | 78.3 | 78.4 | 100.1% |
| Life & Industrial Products | 45.8 | 53.7 | 117.4% |
| Total | 200.3 | 213.0 | 106.3% |
Capital expenditures of ¥12.5 billion are planned for 2026 (¥10.2 billion in 2025), mainly for equipment for new products and labor-saving equipment to handle orders received over the medium to long terms; the main items are ¥9.2 billion in production facilities investment and ¥1.1 billion in R&D expenditures. Depreciation and amortization is forecast at ¥13.8 billion (¥13.2 billion in 2025), and R&D expenses are expected to increase ¥1.0 billion year on year to ¥8.7 billion due to initiatives for future growth.
Shareholder Returns
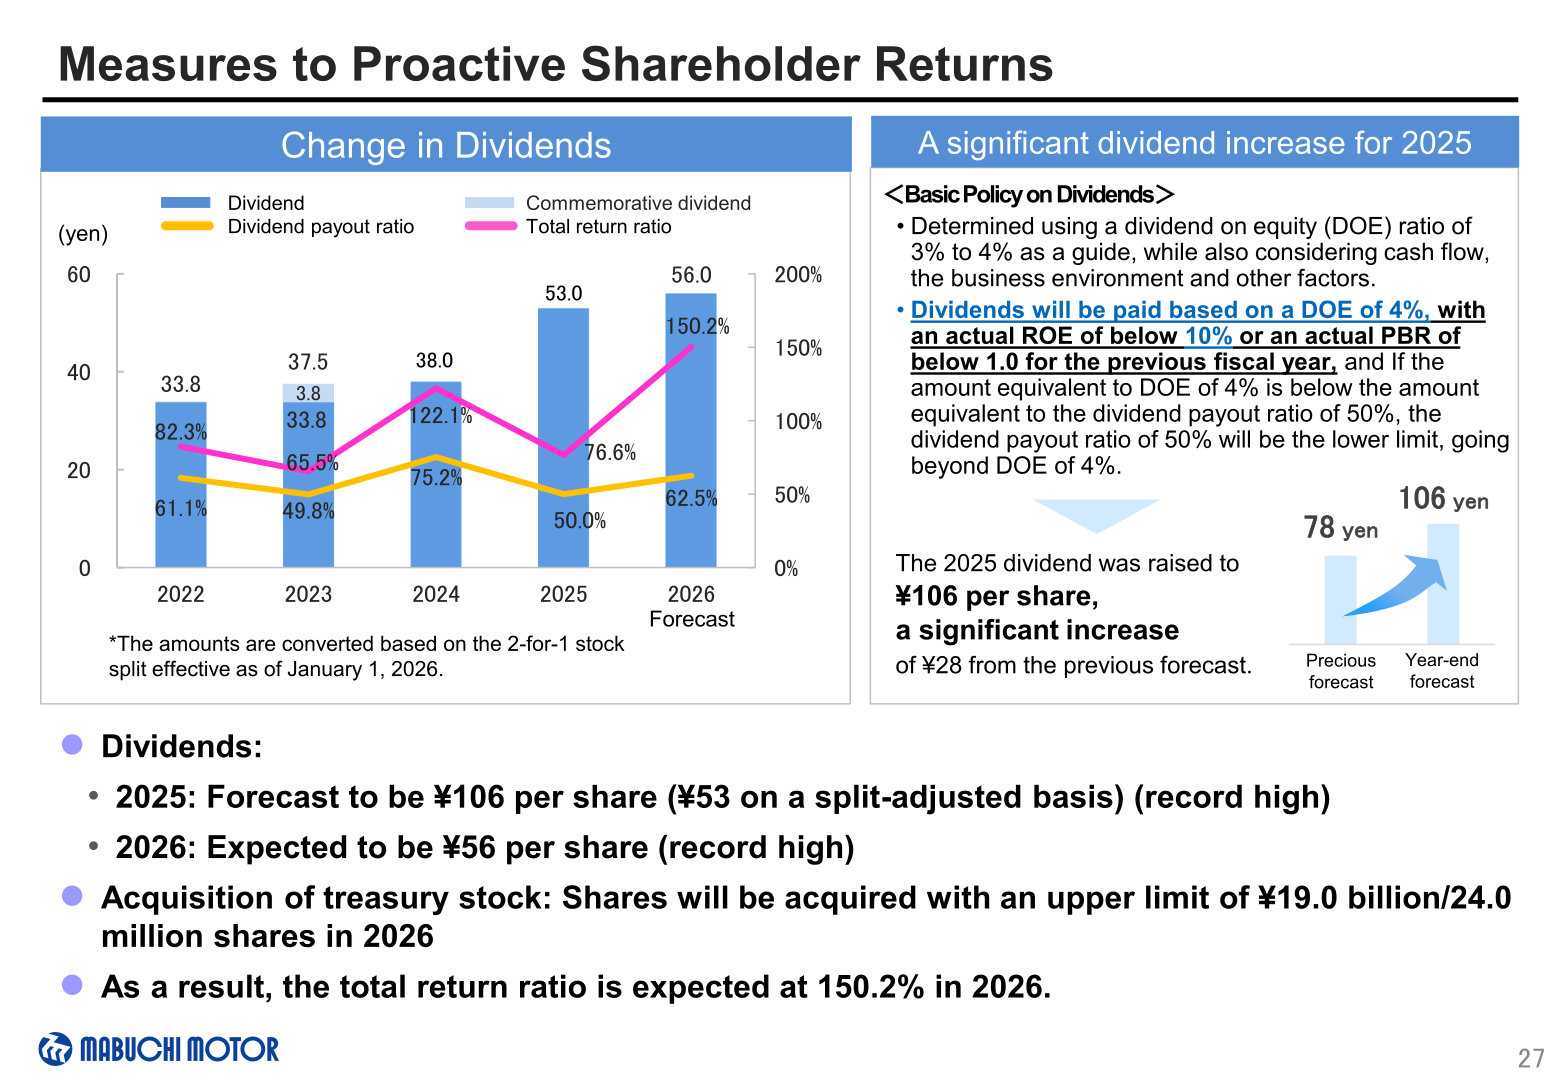
The company has changed its basic policy on dividends to achieve an ROE of 10% or higher by 2030, with the new policy adopted and implemented beginning with the year-end dividend for 2025. Dividends are determined using a dividend on equity (DOE) ratio of 3% to 4% as a guide, while also considering cash flow, the business environment and other factors; dividends will be paid based on a DOE of 4% when actual ROE is below 10% or actual PBR is below 1.0 for the previous fiscal year, and if the amount equivalent to DOE of 4% is below the amount equivalent to a dividend payout ratio of 50%, the 50% payout ratio will be the lower limit. Reflecting this change, the 2025 dividend was raised to ¥106 per share, a significant increase of ¥28 from the previous forecast of ¥78 (¥53 on a split-adjusted basis; record high), after the 2-for-1 stock split effective as of January 1, 2026. For 2026, the dividend is expected to be ¥56 per share (record high). On a split-adjusted basis, dividends per share were ¥33.8 in 2022, ¥37.5 in 2023 (including a ¥3.8 commemorative dividend), ¥38.0 in 2024 and ¥53.0 in 2025; the dividend payout ratio was 50.0% in 2025 (75.2% in 2024) and is forecast at 62.5% in 2026, while the total return ratio was 76.6% in 2025 (122.1% in 2024). Regarding treasury stock, after finishing the ongoing share buyback of ¥7.0 billion, the company will implement a share buyback of ¥19.0 billion in 2026 (an increase of ¥12.0 billion compared to the 2025-2026 plan), with an upper limit of ¥19.0 billion/24.0 million shares, and will flexibly implement share buybacks as needed moving toward an ROE of 10%. As a result, the total return ratio is expected at 150.2% in 2026. Under the 2024-2026 cash allocation policy, the share buyback was approx. ¥7.0 billion and total dividends approx. ¥9.6 billion in 2025, and the 2026 forecasts are a share buyback of approx. ¥19.0 billion and total dividends of approx. ¥15.0 billion.
| Item | 2024 | 2025 | 2026 (Forecast) |
|---|---|---|---|
| Dividend per share (split-adjusted, yen) | 38.0 | 53.0 | 56.0 |
| Dividend per share (pre-split basis) | – | ¥106 (raised from ¥78) | – |
| Dividend payout ratio | 75.2% | 50.0% | 62.5% |
| Total return ratio | 122.1% | 76.6% | 150.2% |
| Share buyback (approx.) | ¥6.0 billion | ¥7.0 billion | ¥19.0 billion (upper limit ¥19.0 billion/24.0 million shares) |
| Total amount of dividends (approx.) | ¥10.2 billion | ¥9.6 billion | ¥15.0 billion |
Management Plan 2030 / Topics
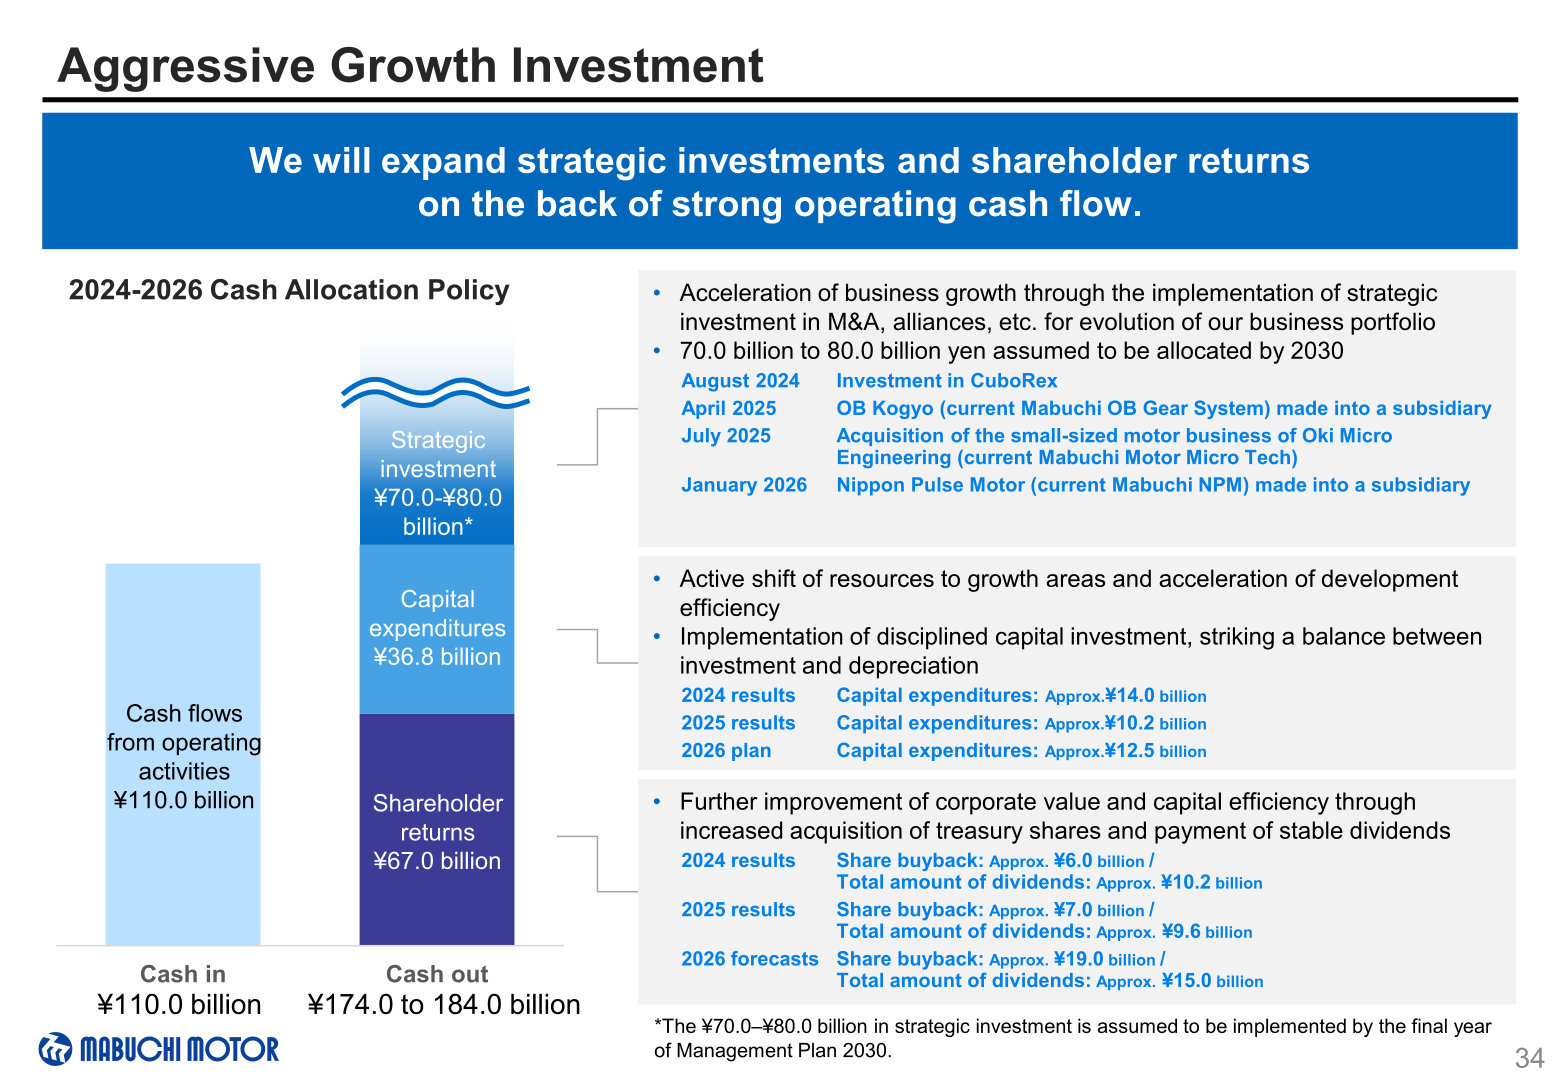
Under Management Plan 2030 (2024-2030), the guidance is net sales of 300 billion yen, an operating income ratio of 15% or higher, ROIC of 12% or higher and ROE of 10% or higher (ROE was introduced in August 2025 and will be included in MVP starting with the 2026 results). The company measures progress with Mabuchi Motor Value Points (MVP), combining financial and non-financial indicators; the 2025 MVP result was 77.3 Pt. (61.8 Pt. in 2024; goal of 100 Pt. in 2030), with net sales 16.7 Pt., operating income ratio 21.2 Pt., ROIC 21.0 Pt. and sustainability goals (8 goals in total) 18.4 Pt. The company states that growth in sales of motors for automotive products will accelerate from 2027, while for Life & Industrial Products and new fields, M&A activities and other initiatives will accelerate growth from 2026. To achieve an ROE of 10% as quickly as possible, the company will use leverage to invest in growth, purchase ¥19.0 billion of treasury stock in 2026, and invest 70.0 to 80.0 billion yen in growth by 2030. The 2024-2026 cash allocation policy assumes cash flows from operating activities of ¥110.0 billion against cash out of ¥174.0 to 184.0 billion (strategic investment ¥70.0-¥80.0 billion, capital expenditures ¥36.8 billion and shareholder returns ¥67.0 billion). Growth investments focus on the 3 M fields (Medical, Mobility, Machinery) under the e-MOTO concept: following the August 2024 investment in CuboRex, OB Kogyo (current Mabuchi OB Gear System) was made a subsidiary in April 2025, the small-sized motor business of Oki Micro Engineering (current Mabuchi Motor Micro Tech) was acquired in July 2025, and Nippon Pulse Motor (current Mabuchi NPM) was made a subsidiary in January 2026, bringing expertise in industrial network protocols and motor control. New orders for brushless motors and unit products increased in the 3 M fields, including motors for high-end e-bikes for a major Japanese customer and brushless motor units for belt conveyors. The company joined KyoHA (Kyoto Humanoid Association) in October 2025, established Mabuchi Engineering and an R&D center at Vietnam Mabuchi in October 2025, and India Mabuchi (established March 2025) began full-scale sales activities in 2026. In September 2025 the company acquired SBT certification, setting a new target of reducing Scope 1 and 2 emissions by 42% from the 2023 level by 2030, and it achieved an “AA” rating in MSCI’s ESG rating for the first time.
This article is an analysis based on publicly available information and is not a recommendation to buy or sell any specific securities. Investment decisions are your own responsibility.
![[Obayashi] Investors’ Guide 2026 — The Complete 24-Article Breakdown](https://japan-equity.com/wp-content/uploads/2026/07/hub_cover-1024x1024.png)
![[Obayashi] IR & SR Policy — Feeding Dialogue Back into Management](https://japan-equity.com/wp-content/uploads/2026/07/p32_sq-1024x1024.jpg)
![[Obayashi] Real Estate Development — 18.7% Margin, ¥287.7bn Unrealized Gains](https://japan-equity.com/wp-content/uploads/2026/07/p20_sq-1024x1024.jpg)
![[Obayashi] Domestic Civil Engineering — Resilience Spending Supports 9.6% Margin](https://japan-equity.com/wp-content/uploads/2026/07/p11_sq-1024x1024.jpg)
![[Obayashi] Share Price & External Ratings — vs TOPIX, ESG Index Inclusion](https://japan-equity.com/wp-content/uploads/2026/07/p40_sq-1024x1024.jpg)
![[Construction] ¥75.5tn Investment, Shrinking Workforce — Big-5 Market Share](https://japan-equity.com/wp-content/uploads/2026/07/p12_sq-1024x1024.jpg)



![[Obayashi] Capital Policy & Shareholder Returns — ROE 10%+, DOE ~5%, ¥100bn Buyback](https://japan-equity.com/wp-content/uploads/2026/07/p27_sq-1024x1024.jpg)
![[Obayashi] Reducing Cross-Shareholdings — ¥285.2bn Sold in Five Years](https://japan-equity.com/wp-content/uploads/2026/07/p29_sq-1024x1024.jpg)
![[Obayashi] ¥750bn Investment Plan — ¥300bn to Development, ¥190bn to Tech/DX](https://japan-equity.com/wp-content/uploads/2026/07/p30_sq-1024x1024.jpg)
![[Obayashi] MTP2022 KPIs — Operating Profit ~2x Target, ROE 14.4%](https://japan-equity.com/wp-content/uploads/2026/07/p25_sq-1024x1024.jpg)
![[Obayashi] Cash Allocation — ¥420bn Investment CF Over Five Years](https://japan-equity.com/wp-content/uploads/2026/07/p26_sq-1024x1024.jpg)
![[Obayashi] Green Energy — 44 Plants, 344MW, and the Green Hydrogen Challenge](https://japan-equity.com/wp-content/uploads/2026/07/p21_sq-1024x1024.jpg)
![[Obayashi] Tackling the Labor Shortage — Robotics Construction®](https://japan-equity.com/wp-content/uploads/2026/07/p14_sq-1024x1024.jpg)
