
This article is based on publicly available IR materials and is not a recommendation to buy or sell any specific securities.
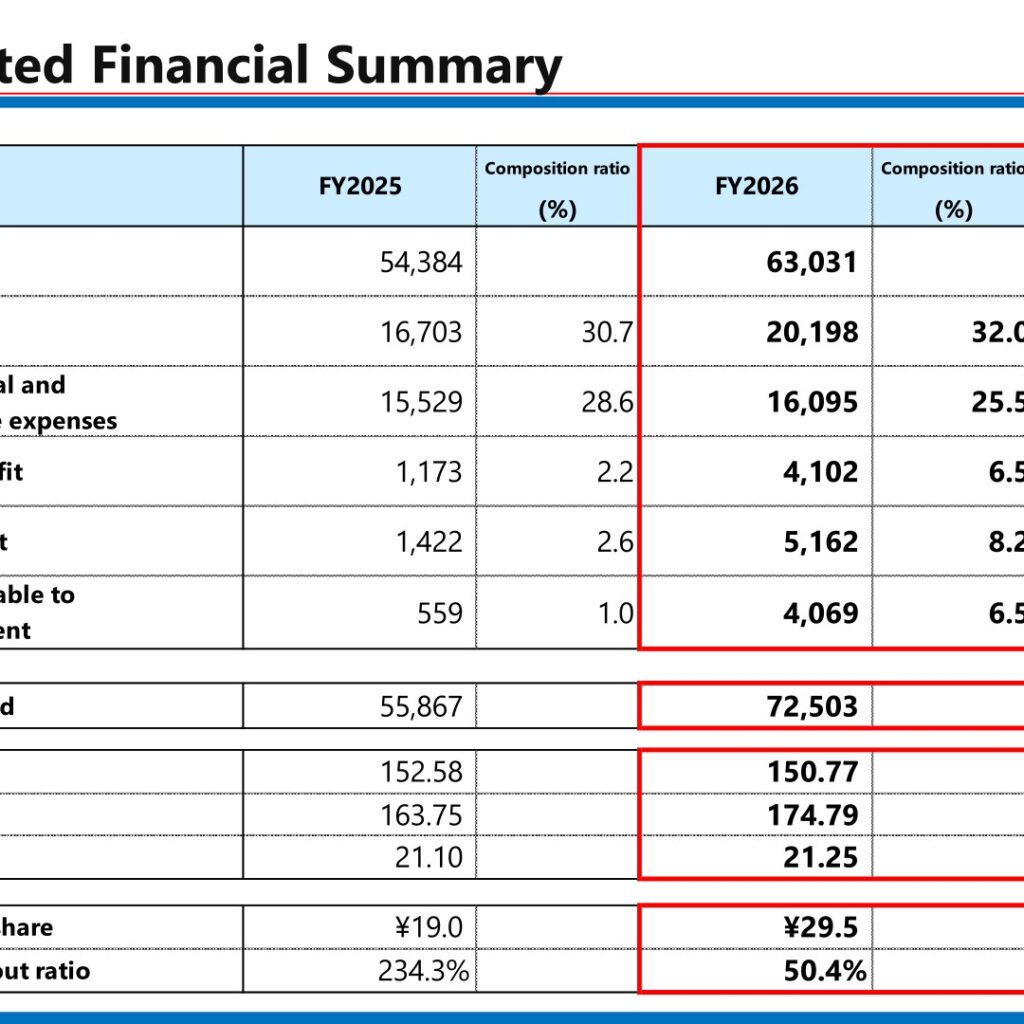
Nippon Thompson Co., Ltd. (IKO brand; Tokyo Stock Exchange code 6480) reported consolidated net sales of 63,031 million yen for the fiscal year ended March 31, 2026, up 15.9% year on year, driven by a recovery in capital investment demand in Japan and overseas, particularly for electronics-related equipment. Operating profit rose 249.6% to 4,102 million yen, and profit attributable to owners of parent increased 626.8% (approximately sevenfold) to 4,069 million yen. Orders received grew 29.8% to 72,503 million yen, and the annual dividend was raised to 29.5 yen per share.
Note: The company’s materials label the fiscal year ended March 31, 2026 as “FY2026” and the fiscal year ending March 31, 2027 as “FY2027”; this article keeps the labels used in the materials, while the title uses this site’s FY2025 convention for the most recently completed fiscal year. The company also notes that it changed its accounting policy (the method for elimination of unrealized profits and losses) beginning with the first quarter of the fiscal year ending March 31, 2026, and that figures for FY2022 through FY2025 are stated after the change is applied retroactively.
Consolidated Results (Full-Year Actual)
Net sales increased 15.9% year on year, and the gross profit margin improved from 30.7% to 32.0%. Operating profit increased by 2,929 million yen year on year: the currency exchange effect was +201 million yen, the effect of the real increase in sales was +2,552 million yen, and improvement of the cost of sales ratio contributed +659 million yen, while selling, general and administrative expenses had a -484 million yen impact due to factors such as an increase in personnel expenses and system renovation costs. The year-end dividend was revised upward to 15.50 yen per share, an increase of 1.50 yen from the previously announced forecast.
| Item (Millions of yen) | FY2025 | FY2026 | Change (%) |
|---|---|---|---|
| Net sales | 54,384 | 63,031 | 15.9 |
| Gross profit | 16,703 | 20,198 | 20.9 |
| Selling, general and administrative expenses | 15,529 | 16,095 | 3.6 |
| Operating profit | 1,173 | 4,102 | 249.6 |
| Ordinary profit | 1,422 | 5,162 | 262.9 |
| Profit attributable to owners of parent | 559 | 4,069 | 626.8 |
| Orders received | 55,867 | 72,503 | 29.8 |
On the balance sheet, inventories decreased by 3,985 million yen from the end of the previous period to 35,249 million yen, due to proactive inventory utilization for sales, and interest-bearing liabilities decreased by 4,647 million yen to 28,958 million yen. The equity-to-asset ratio rose from 62.7% to 66.2%. Operating cash flow was 9,479 million yen, mainly due to the recording of profit before income taxes as well as a decrease in inventories, and capital expenditure was 3,115 million yen, focused on capacity expansion and production efficiency improvements. Net production increased 13.5% year on year to 52,369 million yen.
Segment Results
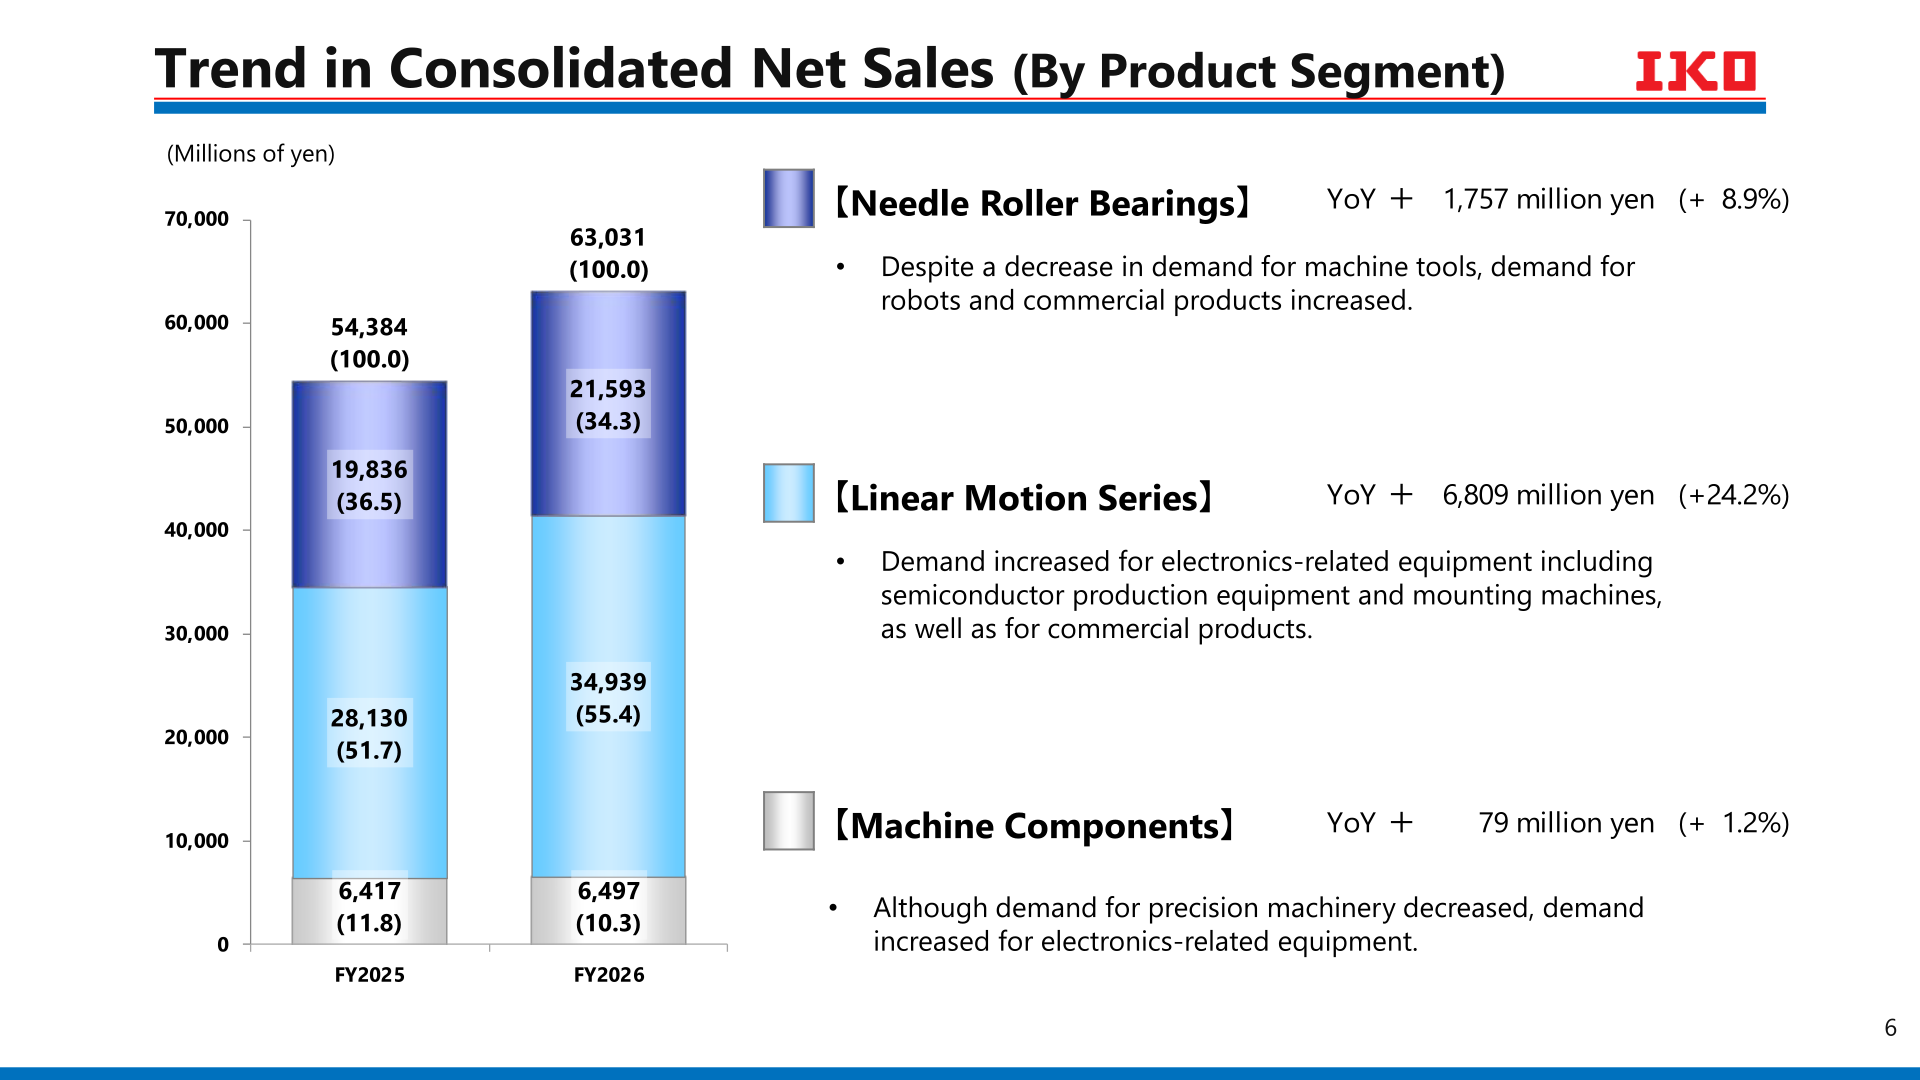
By product segment, the Linear Motion Series led growth, with demand increasing for electronics-related equipment including semiconductor production equipment and mounting machines, as well as for commercial products. In Needle Roller Bearings, despite a decrease in demand for machine tools, demand for robots and commercial products increased. In Machine Components, although demand for precision machinery decreased, demand increased for electronics-related equipment.
| Product Segment (Millions of yen) | FY2025 | FY2026 | YoY |
|---|---|---|---|
| Needle Roller Bearings | 19,836 | 21,593 | +1,757 million yen (+8.9%) |
| Linear Motion Series | 28,130 | 34,939 | +6,809 million yen (+24.2%) |
| Machine Components | 6,417 | 6,497 | +79 million yen (+1.2%) |
| Total | 54,384 | 63,031 | — |
By geographical area, net sales grew in all five regions. China posted the largest increase, up 56.4% year on year, due to increased demand for semiconductor production equipment and large-scale capital expenditure projects. In Japan, demand increased for electronics-related equipment including semiconductor production equipment and mounting machines, as well as for machine tools. In the Americas, demand increased for general industrial machinery such as robots and various types of medical equipment, and in Others, demand recovered mainly in Singapore and Taiwan.
| Geographical Area (Millions of yen) | FY2025 | FY2026 | YoY |
|---|---|---|---|
| Japan | 26,916 | 28,527 | +1,610 million yen (+6.0%) |
| Americas | 8,948 | 10,135 | +1,186 million yen (+13.3%) |
| Europe | 6,071 | 6,689 | +617 million yen (+10.2%) |
| China | 7,150 | 11,185 | +4,035 million yen (+56.4%) |
| Others | 5,296 | 6,493 | +1,196 million yen (+22.6%) |
| Total | 54,384 | 63,031 | — |
By industry category, sales to Distributors, the largest category at 50.0% of net sales, increased 22.1% year on year to 31,498 million yen, with demand associated with capital expenditure increasing mainly in the China market. Electronics rose 18.4% to 11,350 million yen on increased demand for semiconductor production equipment and mounting machines mainly in the domestic market, while Transportation Equipment declined 2.5% to 2,388 million yen as demand for equipment and production lines for automobile manufacturing decreased.
FY2027 Forecast
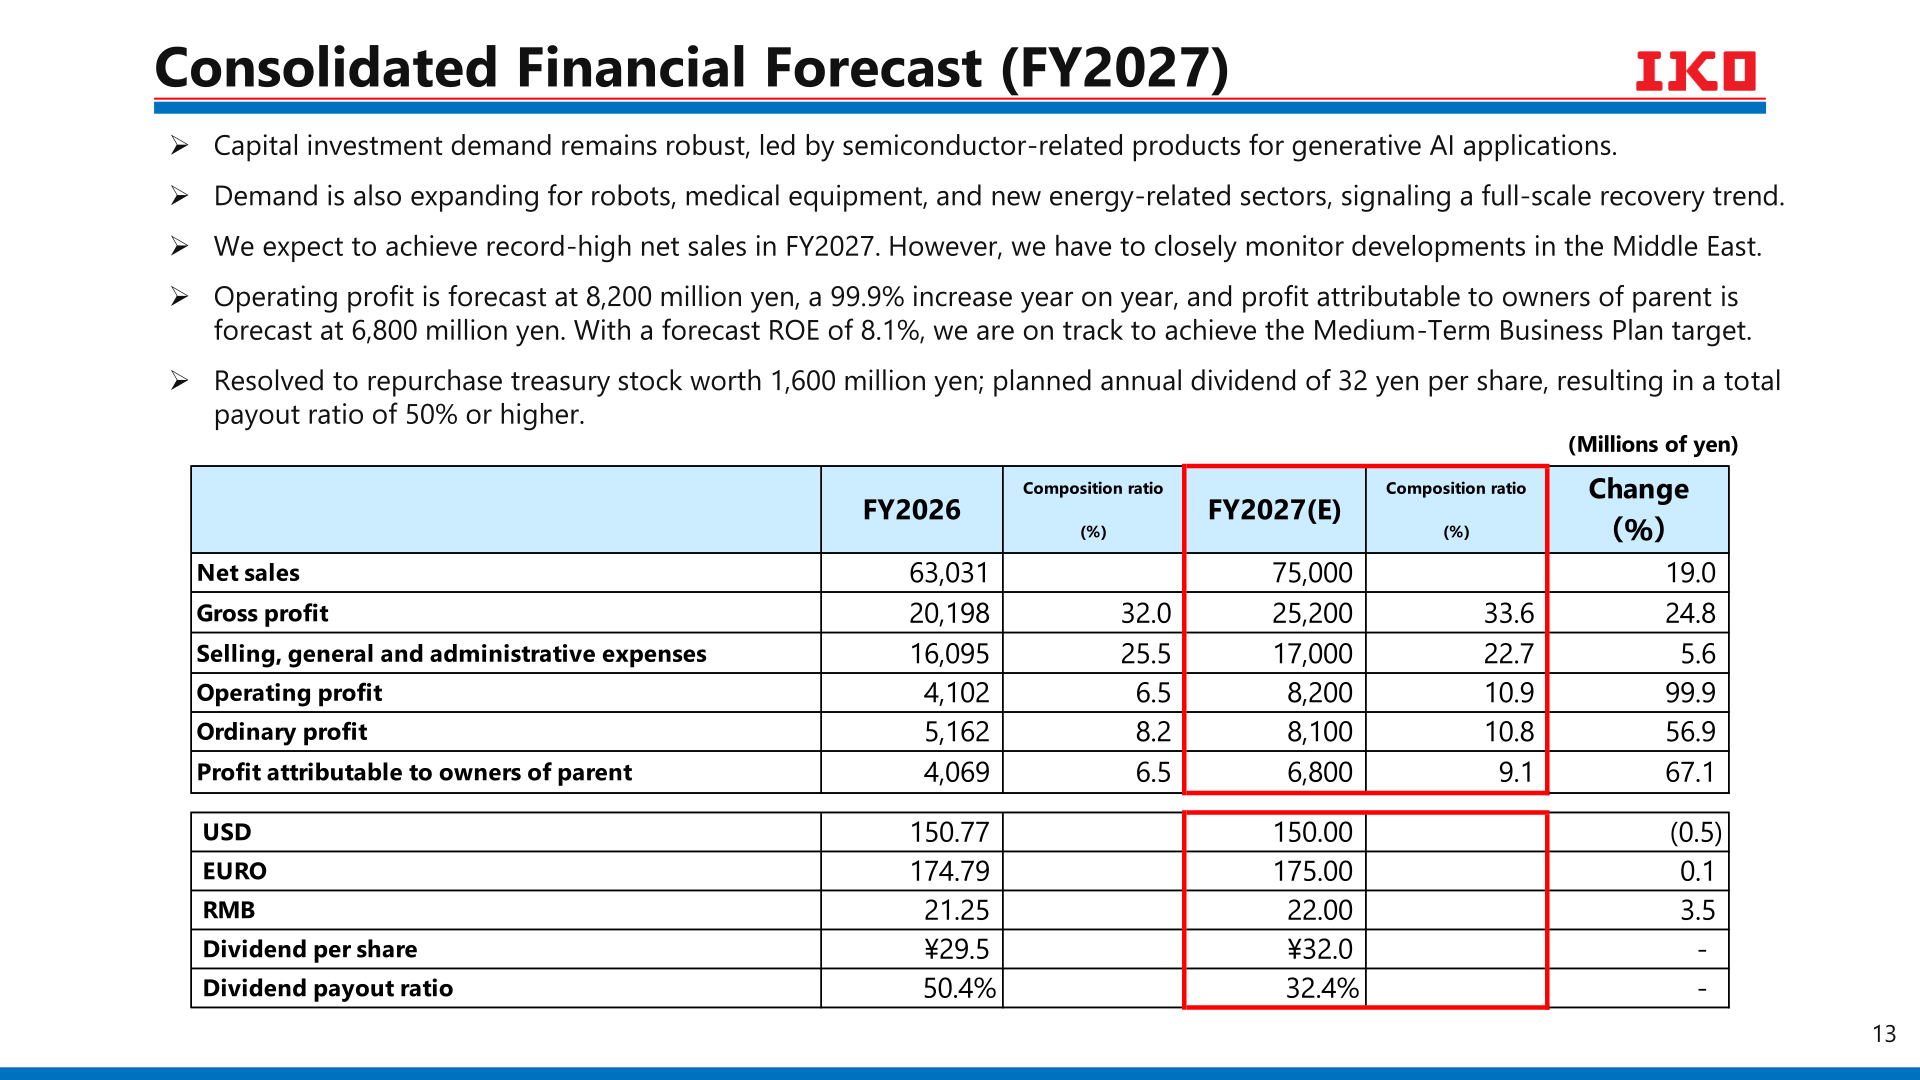
For the fiscal year ending March 31, 2027 (FY2027), the company notes that capital investment demand remains robust, led by semiconductor-related products for generative AI applications, and that demand is also expanding for robots, medical equipment, and new energy-related sectors, signaling a full-scale recovery trend. The company expects to achieve record-high net sales in FY2027, while noting that it has to closely monitor developments in the Middle East. Operating profit is forecast at 8,200 million yen, a 99.9% increase year on year, with a forecast ROE of 8.1%.
| Item (Millions of yen) | FY2026 (Actual) | FY2027 (E) | Change (%) |
|---|---|---|---|
| Net sales | 63,031 | 75,000 | 19.0 |
| Gross profit | 20,198 | 25,200 | 24.8 |
| Selling, general and administrative expenses | 16,095 | 17,000 | 5.6 |
| Operating profit | 4,102 | 8,200 | 99.9 |
| Ordinary profit | 5,162 | 8,100 | 56.9 |
| Profit attributable to owners of parent | 4,069 | 6,800 | 67.1 |
| Dividend per share | ¥29.5 | ¥32.0 | – |
By geographical area, the FY2027 net sales forecast is: Japan 32,600 million yen (+14.3%), Americas 11,100 million yen (+9.5%), Europe 7,400 million yen (+10.6%), China 15,100 million yen (+35.0%), and Others 8,800 million yen (+35.5%), for a total of 75,000 million yen (+19.0%). Exchange rate assumptions are 150.00 yen to the US dollar, 175.00 yen to the euro, and 22.00 yen to the RMB.
Shareholder Returns
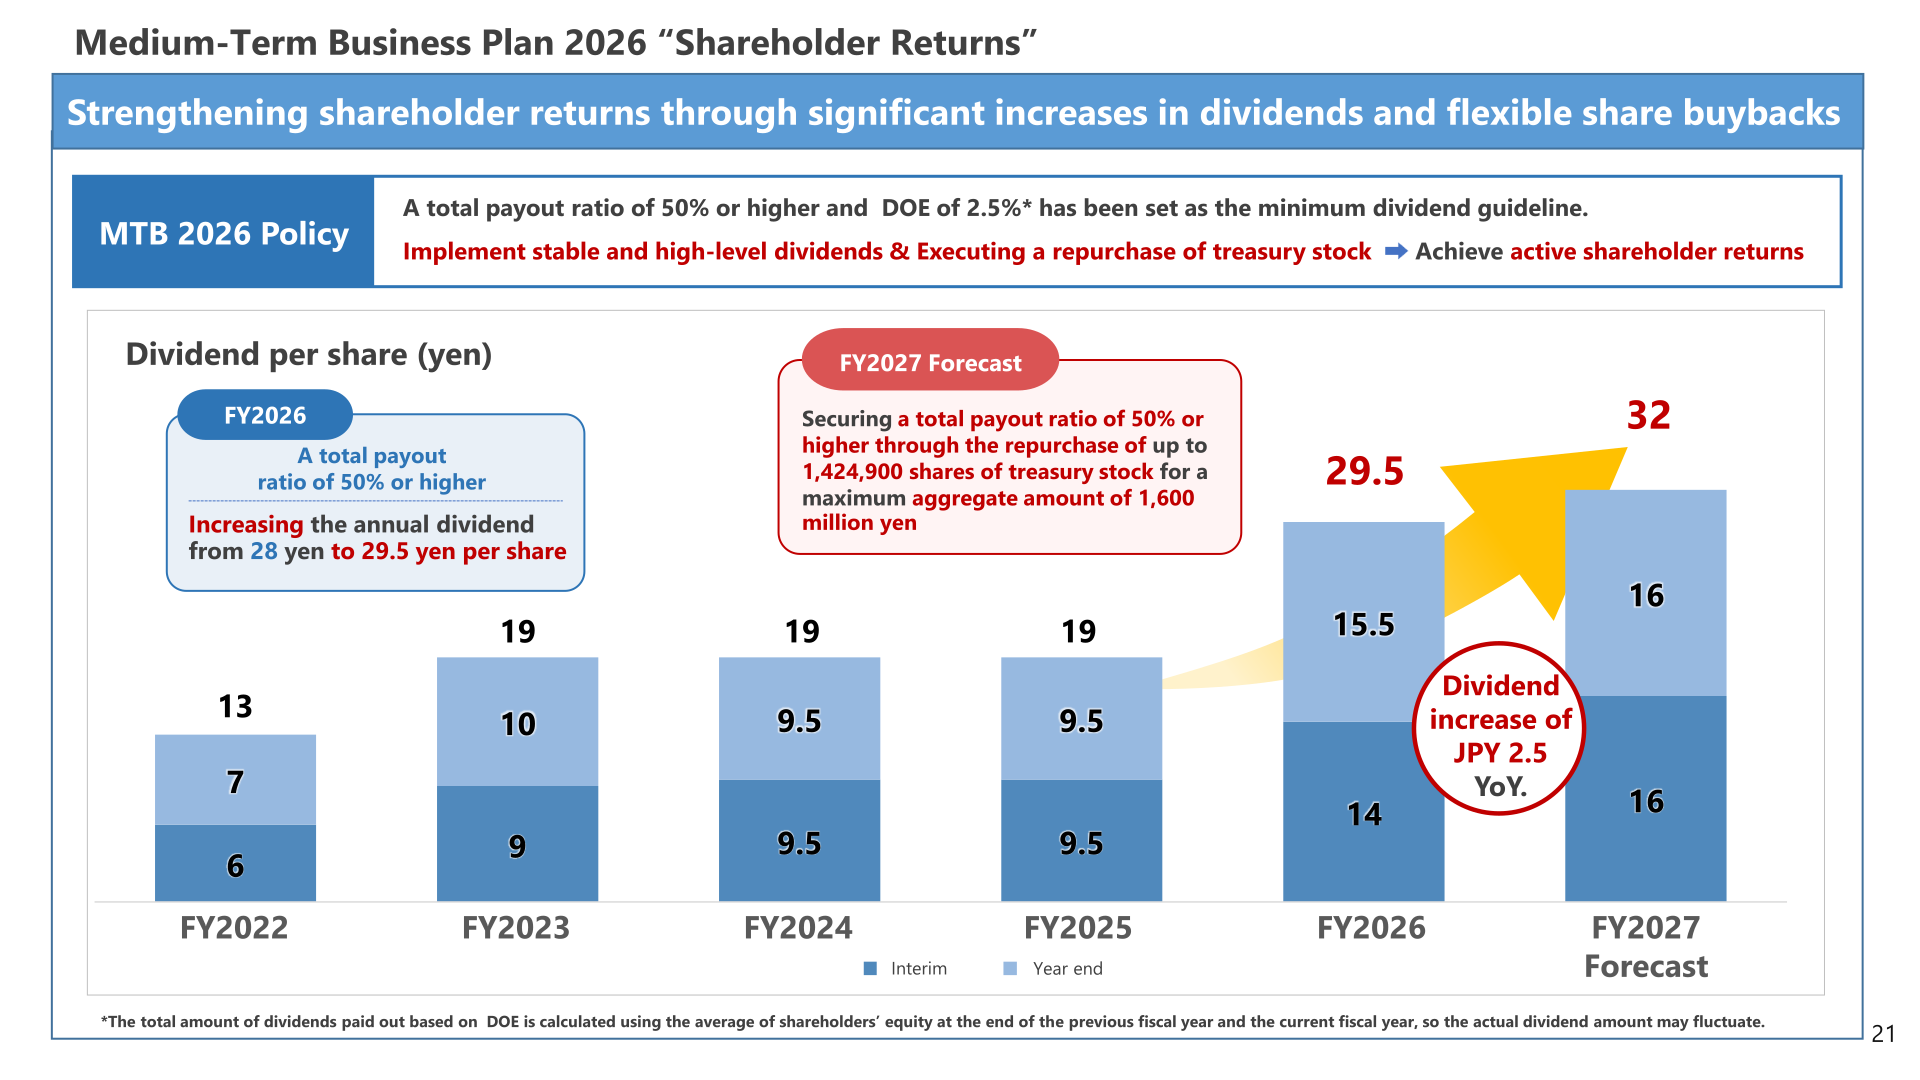
Under the Medium-Term Business Plan 2026 policy, a total payout ratio of 50% or higher and DOE of 2.5% has been set as the minimum dividend guideline, combining stable and high-level dividends with repurchases of treasury stock. For FY2026, the company increased the annual dividend from 28 yen to 29.5 yen per share (interim 14 yen, year-end 15.5 yen), for a dividend payout ratio of 50.4%. For FY2027, the company has resolved to repurchase up to 1,424,900 shares of treasury stock for a maximum aggregate amount of 1,600 million yen, and plans an annual dividend of 32 yen per share (interim 16 yen, year-end 16 yen), resulting in a total payout ratio of 50% or higher.
Medium-Term Business Plan
The Medium-Term Business Plan 2026, “Connect for Growth — The Future of Innovation, Connected by IKO,” positions this as a critical 3-year period to achieve “IKO VISION 2030” and practically implement growth strategies, with focused enhancement in areas of strength and rebuilding of the global business structure. The plan’s financial targets for the final year are operating profit of 6.5 billion yen or above and ROE of 8.0% or above; with FY2027 forecasts of operating profit of 8.2 billion yen and ROE of 8.1%, the company states it is on track to achieve the financial targets in FY2027. IKO VISION 2030 targets net sales of 100 billion yen or above, operating profit of 15 billion yen or above, ROE of 10% or above, and market capitalization of 100 billion yen or above.
Regional strategies include strengthening the collaborative framework with distributors in Japan, developing locally tailored models at the China production base, establishing R&D centers in Europe and the United States, and concentrating resources on humanoid robots, semiconductor production equipment, and medical equipment. The company also established a new sales office in Boston, where growth in cutting-edge technology is expected.
This article is an analysis based on publicly available information and is not a recommendation to buy or sell any specific securities. Investment decisions are your own responsibility.
![[Obayashi] Investors’ Guide 2026 — The Complete 24-Article Breakdown](https://japan-equity.com/wp-content/uploads/2026/07/hub_cover-1024x1024.png)
![[Obayashi] IR & SR Policy — Feeding Dialogue Back into Management](https://japan-equity.com/wp-content/uploads/2026/07/p32_sq-1024x1024.jpg)
![[Obayashi] Real Estate Development — 18.7% Margin, ¥287.7bn Unrealized Gains](https://japan-equity.com/wp-content/uploads/2026/07/p20_sq-1024x1024.jpg)
![[Obayashi] Domestic Civil Engineering — Resilience Spending Supports 9.6% Margin](https://japan-equity.com/wp-content/uploads/2026/07/p11_sq-1024x1024.jpg)
![[Obayashi] Share Price & External Ratings — vs TOPIX, ESG Index Inclusion](https://japan-equity.com/wp-content/uploads/2026/07/p40_sq-1024x1024.jpg)
![[Construction] ¥75.5tn Investment, Shrinking Workforce — Big-5 Market Share](https://japan-equity.com/wp-content/uploads/2026/07/p12_sq-1024x1024.jpg)



![[Obayashi] Capital Policy & Shareholder Returns — ROE 10%+, DOE ~5%, ¥100bn Buyback](https://japan-equity.com/wp-content/uploads/2026/07/p27_sq-1024x1024.jpg)
![[Obayashi] Reducing Cross-Shareholdings — ¥285.2bn Sold in Five Years](https://japan-equity.com/wp-content/uploads/2026/07/p29_sq-1024x1024.jpg)
![[Obayashi] ¥750bn Investment Plan — ¥300bn to Development, ¥190bn to Tech/DX](https://japan-equity.com/wp-content/uploads/2026/07/p30_sq-1024x1024.jpg)
![[Obayashi] MTP2022 KPIs — Operating Profit ~2x Target, ROE 14.4%](https://japan-equity.com/wp-content/uploads/2026/07/p25_sq-1024x1024.jpg)
![[Obayashi] Cash Allocation — ¥420bn Investment CF Over Five Years](https://japan-equity.com/wp-content/uploads/2026/07/p26_sq-1024x1024.jpg)
![[Obayashi] Green Energy — 44 Plants, 344MW, and the Green Hydrogen Challenge](https://japan-equity.com/wp-content/uploads/2026/07/p21_sq-1024x1024.jpg)
![[Obayashi] Tackling the Labor Shortage — Robotics Construction®](https://japan-equity.com/wp-content/uploads/2026/07/p14_sq-1024x1024.jpg)
