
This article is based on publicly available IR materials and is not a recommendation to buy or sell any specific securities.
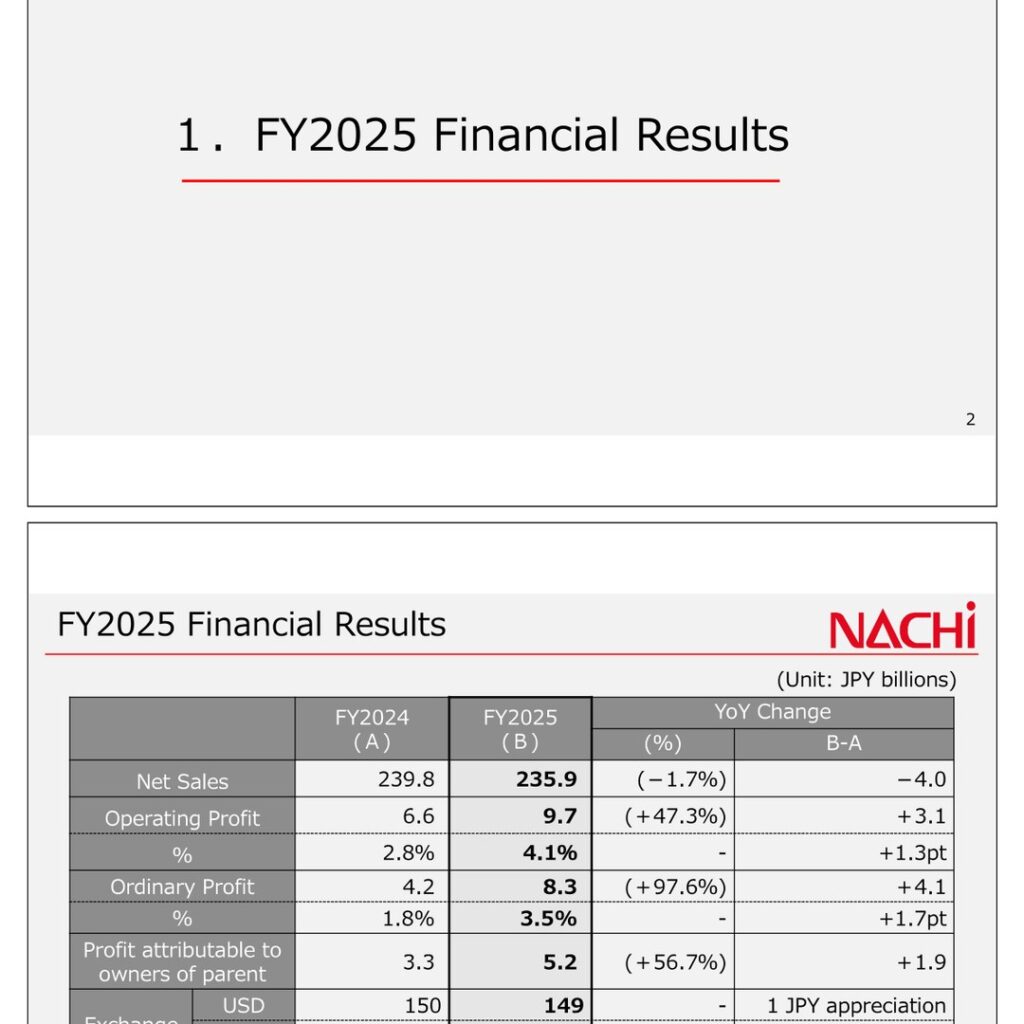
NACHI-FUJIKOSHI CORP. (Code: 6474) presented its “FY2025 Financial Results and FY2026 Outlook” dated January 14, 2026. The company’s FY2025 covers December 1, 2024 through November 30, 2025. Net sales declined 1.7% year on year to JPY 235.9 billion, while operating profit rose 47.3% to JPY 9.7 billion, ordinary profit increased 97.6% to JPY 8.3 billion, and profit attributable to owners of parent grew 56.7% to JPY 5.2 billion. For FY2026, the company plans net sales of JPY 243.0 billion and operating profit of JPY 12.1 billion, and the dividend per share is JPY 100.
Consolidated Results (Full-Year Actual)
Operating profit increased JPY 3.1 billion year on year to JPY 9.7 billion, lifting the operating margin from 2.8% to 4.1% (+1.3pt). Ordinary profit rose JPY 4.1 billion to JPY 8.3 billion. Exchange rates for the period were JPY 149 to the U.S. dollar (1 JPY appreciation), JPY 167 to the euro (4 JPY depreciation), and JPY 20.7 to the Chinese yuan (0.2 JPY appreciation). Figures below are in JPY billions, as presented in the materials.
| Item | FY2024 (A) | FY2025 (B) | YoY Change (%) | YoY Change (B-A) |
|---|---|---|---|---|
| Net Sales | 239.8 | 235.9 | (−1.7%) | −4.0 |
| Operating Profit | 6.6 | 9.7 | (+47.3%) | +3.1 |
| Operating Profit % | 2.8% | 4.1% | – | +1.3pt |
| Ordinary Profit | 4.2 | 8.3 | (+97.6%) | +4.1 |
| Ordinary Profit % | 1.8% | 3.5% | – | +1.7pt |
| Profit attributable to owners of parent | 3.3 | 5.2 | (+56.7%) | +1.9 |
| Dividend per share | JPY 100 | JPY 100 | – | – |
The factors affecting FY2025 operating profit totaled an increase of JPY 6.8 billion — reduction in fixed costs, SG&A and others (+3.2), cost reductions (+1.3), and price optimization (+2.3) — against a decrease of JPY 3.7 billion from increases in material costs (−1.1), lower capacity utilization (−2.0), and the impact of exchange rates (−0.6), taking operating profit from JPY 6.6 billion to JPY 9.7 billion.
On the balance sheet, ROE improved 1.1pt to 3.2%. Total assets were JPY 331.2 billion, total equity JPY 170.5 billion, and the equity ratio rose 4.1pt to 51.5%. Interest-bearing debt decreased JPY 7.9 billion to JPY 83.2 billion, and the net D/E ratio improved to 0.32. Capital expenditures were JPY 9.9 billion, depreciation and amortization JPY 18.7 billion, and regular employees numbered 6,532 (−411).
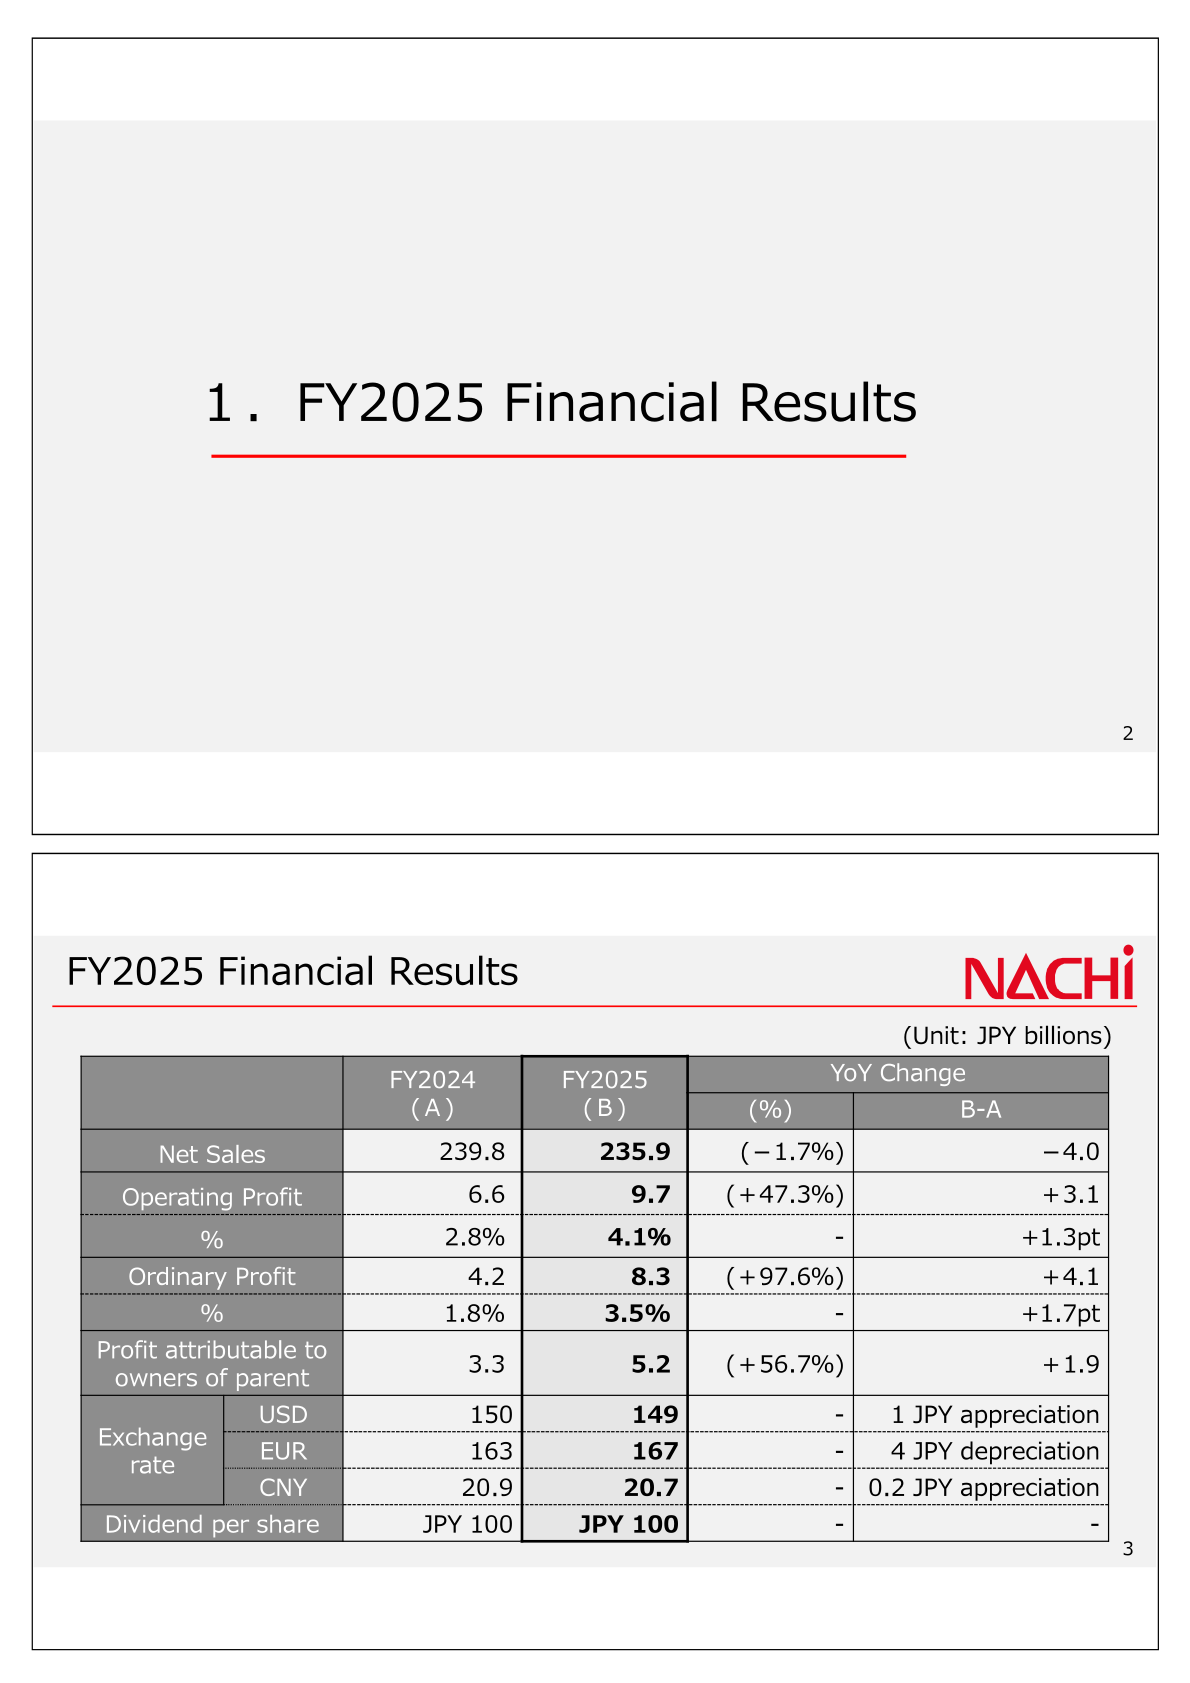
In extraordinary items, extraordinary income was JPY 3.1 billion (−1.7 YoY), consisting of gain on sales of investment securities of JPY 3.1 billion. Extraordinary losses were JPY 3.4 billion (−0.9 YoY), of which structural reform costs were JPY 3.1 billion, including impairment and inventory valuation losses (1.2), disposal losses on fixed assets and inventories (0.7), and special retirement payments (0.7).
Segment Results
In the Machinery & Tools segment, net sales fell 5.3% to JPY 73.4 billion while operating profit rose 10.3% to JPY 4.2 billion (margin 5.8%). Within the segment, Cutting Tools grew 2.8% to JPY 34.1 billion and Machine Tools rose 4.8% to JPY 13.9 billion, while Robots declined 18.3% to JPY 25.2 billion. In the Components segment, net sales edged up 0.6% to JPY 147.2 billion and operating profit rose 200.3% to JPY 4.9 billion (margin 3.4%): Bearings were JPY 85.4 billion (−0.4%), Hydraulic Equipment JPY 39.7 billion (−0.8%), and Automotive Hydraulic JPY 22.0 billion (+7.2%). The Other segment posted net sales of JPY 15.2 billion (−4.7%) and operating profit of JPY 0.4 billion (−55.1%).
| Segment | Item | FY2024 (A) | FY2025 (B) | YoY % |
|---|---|---|---|---|
| Machinery & Tools | Cutting Tools | 33.2 | 34.1 | +2.8% |
| Machinery & Tools | Machine Tools | 13.3 | 13.9 | +4.8% |
| Machinery & Tools | Robots | 30.9 | 25.2 | −18.3% |
| Machinery & Tools | Net Sales | 77.5 | 73.4 | −5.3% |
| Machinery & Tools | Operating Profit | 3.8 | 4.2 | +10.3% |
| Components | Bearings | 85.7 | 85.4 | −0.4% |
| Components | Hydraulic Equipment | 40.0 | 39.7 | −0.8% |
| Components | Automotive Hydraulic | 20.6 | 22.0 | +7.2% |
| Components | Net Sales | 146.3 | 147.2 | +0.6% |
| Components | Operating Profit | 1.6 | 4.9 | +200.3% |
| Other | Net Sales | 15.9 | 15.2 | −4.7% |
| Other | Operating Profit | 1.0 | 0.4 | −55.1% |
| Total | Net Sales | 239.8 | 235.9 | −1.7% |
| Total | Operating Profit | 6.6 | 9.7 | +47.3% |
By region, sales in Japan were JPY 115.9 billion (−1.3%), the Americas JPY 34.9 billion (−3.1%), Europe JPY 11.1 billion (−0.1%), China JPY 35.7 billion (−3.9%), India JPY 6.4 billion (+12.6%), and ASEAN & Others JPY 31.7 billion (−2.1%).
FY2026 Forecast
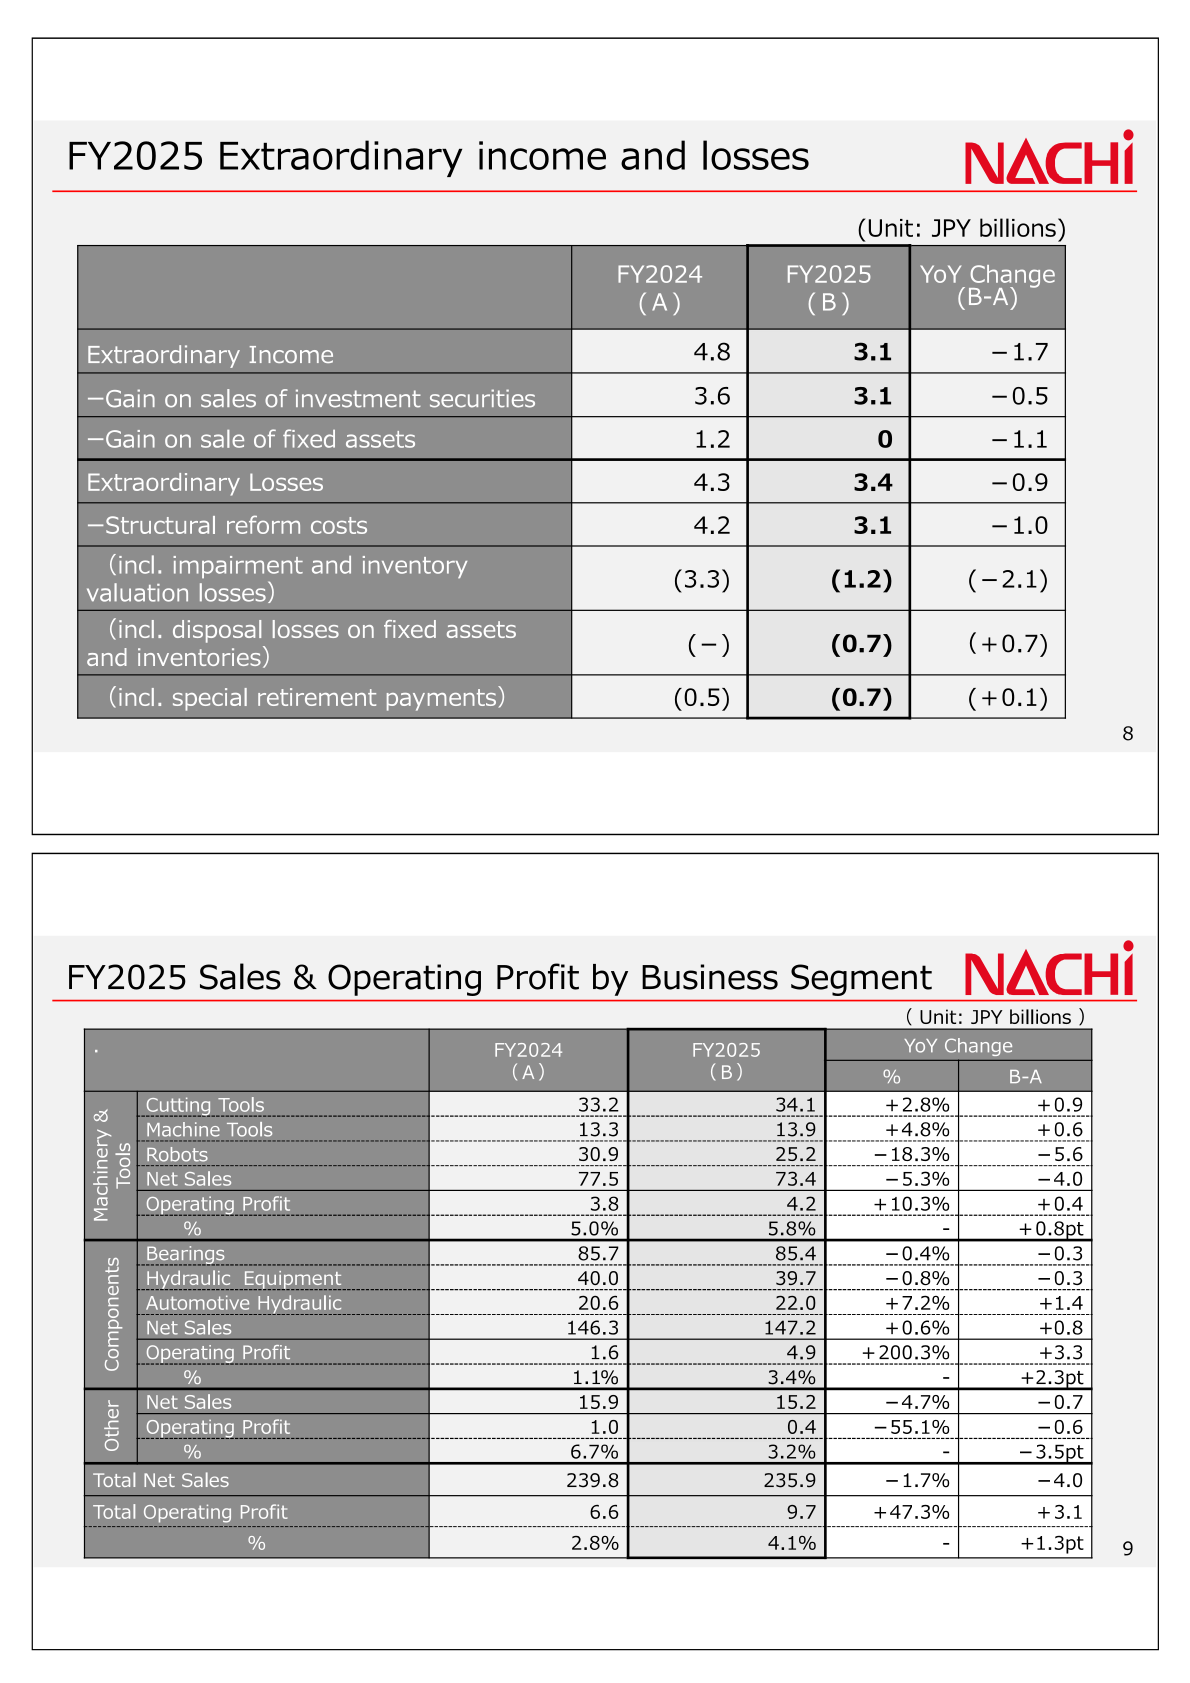
For FY2026, the company plans net sales of JPY 243.0 billion (+3.0%), operating profit of JPY 12.1 billion (+23.8%, margin 5.0%), ordinary profit of JPY 10.4 billion (+24.3%), and profit attributable to owners of parent of JPY 6.4 billion (+21.9%). Exchange rate assumptions are JPY 145 to the U.S. dollar, JPY 160 to the euro, and JPY 20.0 to the Chinese yuan — all yen appreciation versus FY2025.
| Item | FY2025 (A) | FY2026 Plan (B) | YoY Change (%) | YoY Change (B-A) |
|---|---|---|---|---|
| Net Sales | 235.9 | 243.0 | (+3.0%) | +7.1 |
| Operating Profit | 9.7 | 12.1 | (+23.8%) | +2.3 |
| Operating Profit % | 4.1% | 5.0% | – | +0.9pt |
| Ordinary Profit | 8.3 | 10.4 | (+24.3%) | +2.0 |
| Ordinary Profit % | 3.5% | 4.3% | – | +0.8pt |
| Profit attributable to owners of parent | 5.2 | 6.4 | (+21.9%) | +1.1 |
| Dividend per share | JPY 100 | JPY 100 | – | – |
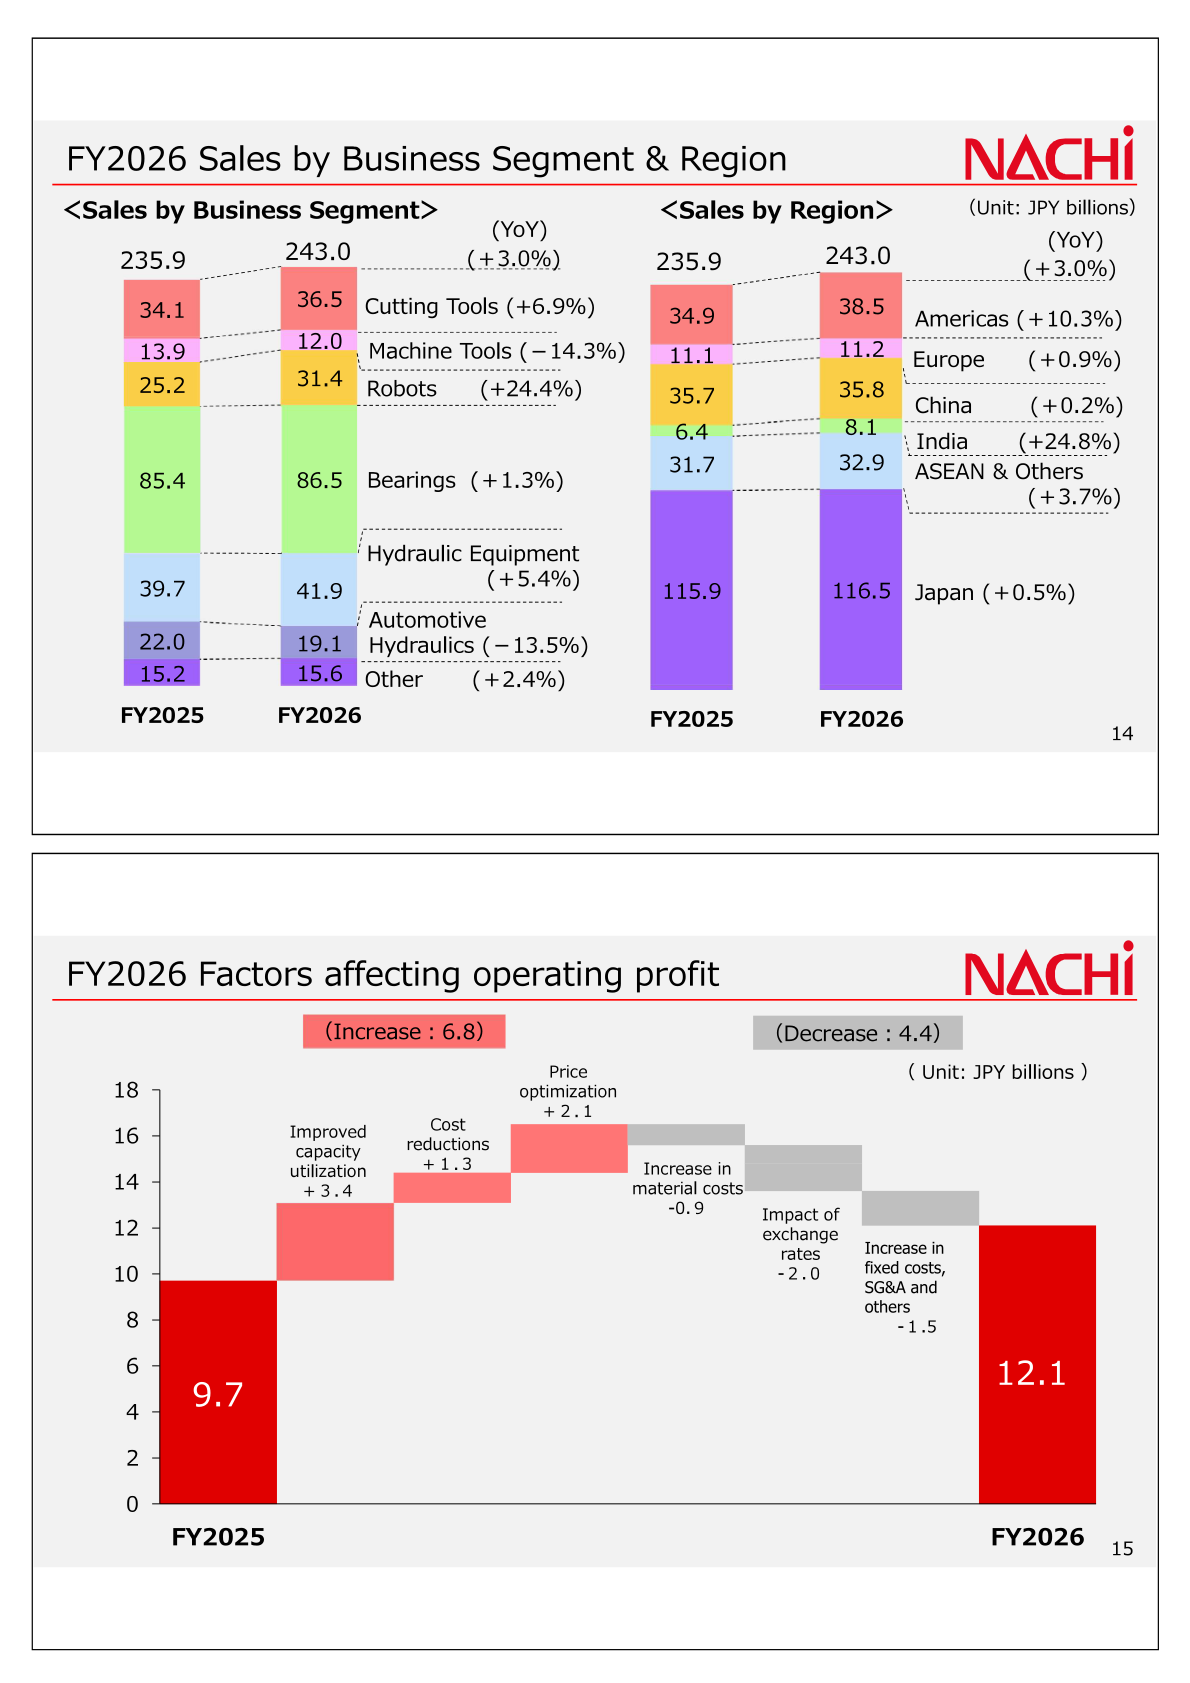
The planned operating profit increase factors total JPY 6.8 billion — improved capacity utilization (+3.4), cost reductions (+1.3), and price optimization (+2.1) — against decreases of JPY 4.4 billion from increases in material costs (−0.9), the impact of exchange rates (−2.0), and increases in fixed costs, SG&A and others (−1.5). By segment, Machinery & Tools plans net sales of JPY 79.9 billion (+8.8%) with operating profit of JPY 5.8 billion (+36.2%), led by Robots at JPY 31.4 billion (+24.4%) and Cutting Tools at JPY 36.5 billion (+6.9%), while Machine Tools are planned at JPY 12.0 billion (−14.3%). Components plans net sales of JPY 147.5 billion (+0.2%) and operating profit of JPY 5.7 billion (+15.4%). By region, the Americas are planned at JPY 38.5 billion (+10.3%) and India at JPY 8.1 billion (+24.8%). By half-year, the plan calls for net sales of JPY 118.5 billion with operating profit of JPY 5.7 billion in 1H and JPY 124.5 billion with JPY 6.4 billion in 2H. Capital expenditures are planned at JPY 22.0 billion (+12.1 YoY), with ROE of 3.7%.
On demand trends by industry, the company describes a challenging automotive environment due to domestic production adjustments, slowing EV demand and rising Chinese EV makers, while HEV demand remains solid. Construction machine demand is expected to recover in China and Europe, and in industrial machinery, demand for aerospace and power generation is recovering gradually.
Shareholder Returns
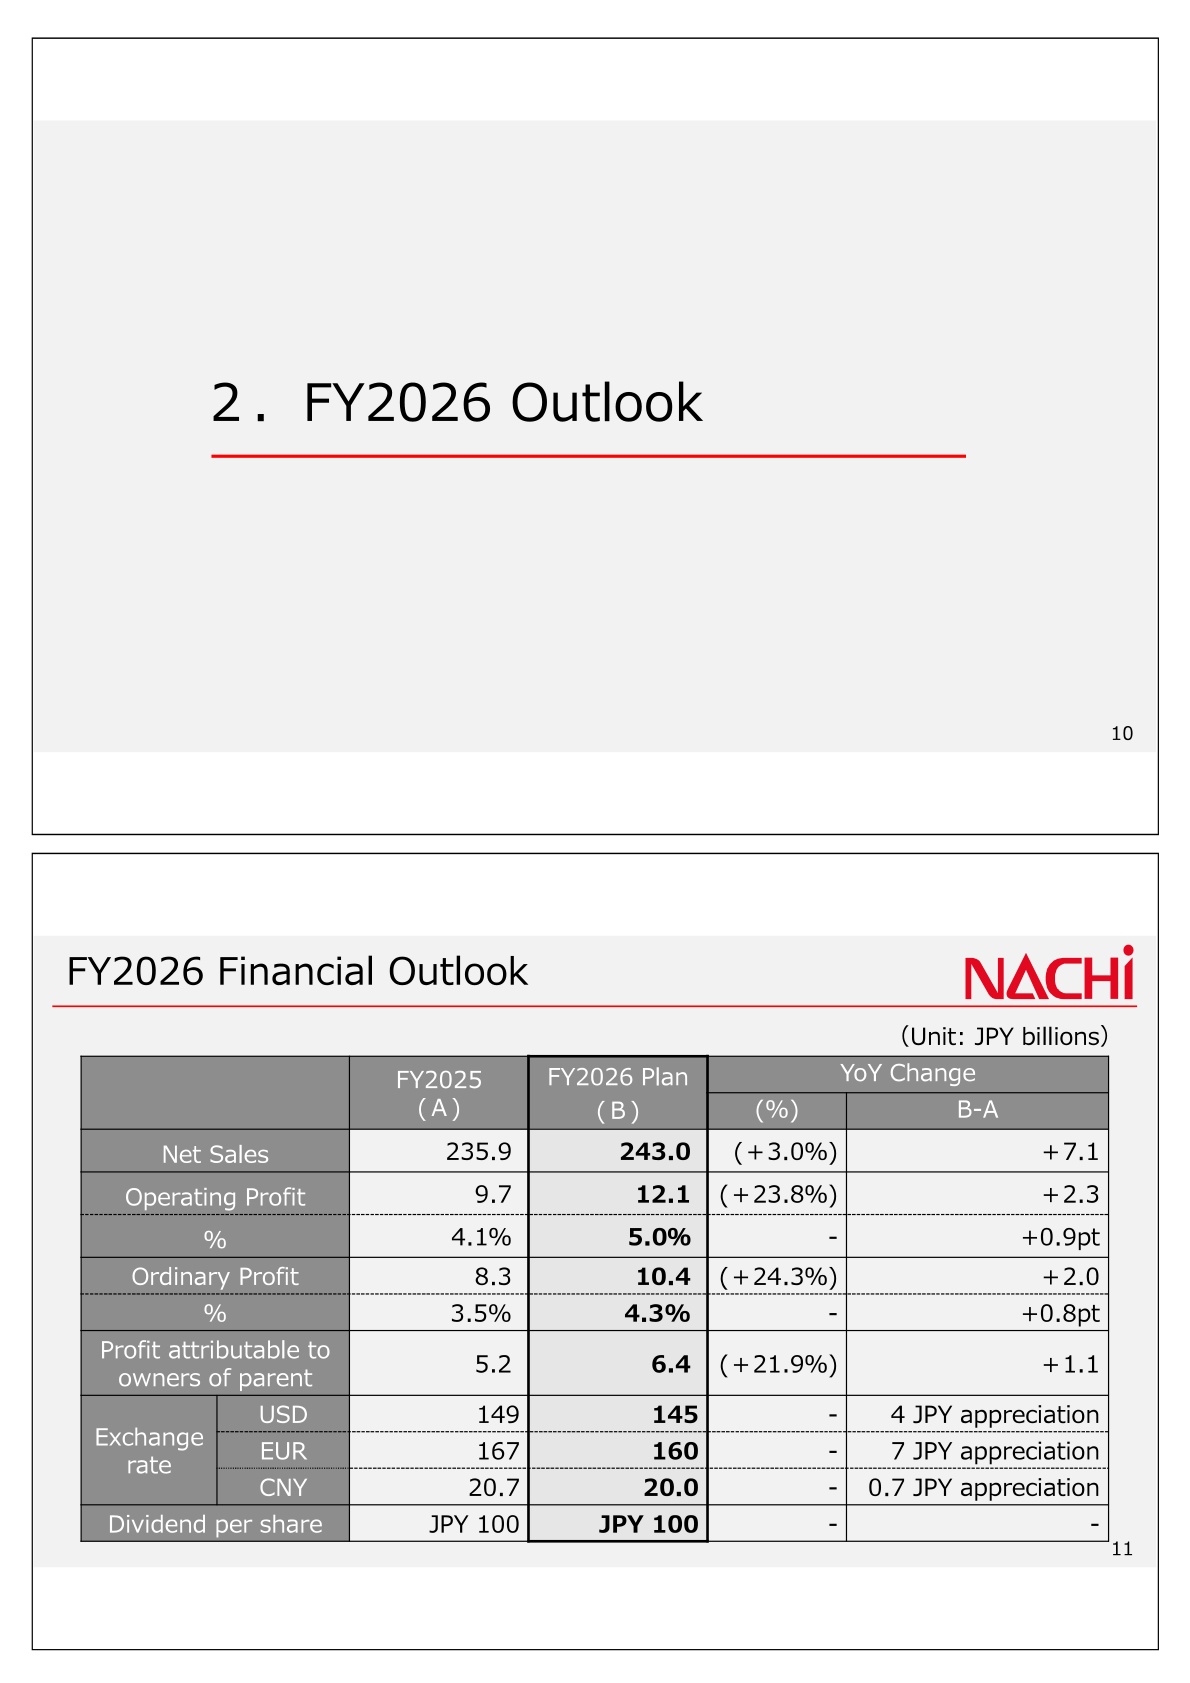
The dividend per share was JPY 100 for FY2024 and JPY 100 for FY2025, and the FY2026 plan is also JPY 100 per share, as shown in the results and outlook tables.
Topics: Sales Expansion in the U.S. and India
For FY2026, the company outlines sales expansion in the U.S., citing reshoring driven by protectionist policies, increasing U.S. investments by automakers, and rising labor costs. It aims to expand sales of all products, centered on Robots, to meet growing automation demand, establishing new sales offices in San Jose and Dallas with further expansion planned. In India, pointing to the largest population and economic growth, a high share of ICE/engine vehicles, and rising demand for quality as a global hub, the company will establish a new sales office in Pune to expand sales of all products, primarily for automotive applications, and plans to strengthen sales and production structures.
This article is an analysis based on publicly available information and is not a recommendation to buy or sell any specific securities. Investment decisions are your own responsibility.
![[Obayashi] Investors’ Guide 2026 — The Complete 24-Article Breakdown](https://japan-equity.com/wp-content/uploads/2026/07/hub_cover-1024x1024.png)
![[Obayashi] IR & SR Policy — Feeding Dialogue Back into Management](https://japan-equity.com/wp-content/uploads/2026/07/p32_sq-1024x1024.jpg)
![[Obayashi] Domestic Civil Engineering — Resilience Spending Supports 9.6% Margin](https://japan-equity.com/wp-content/uploads/2026/07/p11_sq-1024x1024.jpg)
![[Obayashi] Overseas Construction — Orders Reach ¥1.2tn](https://japan-equity.com/wp-content/uploads/2026/07/p15_sq-1024x1024.jpg)
![[Obayashi] Share Price & External Ratings — vs TOPIX, ESG Index Inclusion](https://japan-equity.com/wp-content/uploads/2026/07/p40_sq-1024x1024.jpg)
![[Construction] ¥75.5tn Investment, Shrinking Workforce — Big-5 Market Share](https://japan-equity.com/wp-content/uploads/2026/07/p12_sq-1024x1024.jpg)



![[Obayashi] Capital Policy & Shareholder Returns — ROE 10%+, DOE ~5%, ¥100bn Buyback](https://japan-equity.com/wp-content/uploads/2026/07/p27_sq-1024x1024.jpg)
![[Obayashi] Reducing Cross-Shareholdings — ¥285.2bn Sold in Five Years](https://japan-equity.com/wp-content/uploads/2026/07/p29_sq-1024x1024.jpg)
![[Obayashi] ¥750bn Investment Plan — ¥300bn to Development, ¥190bn to Tech/DX](https://japan-equity.com/wp-content/uploads/2026/07/p30_sq-1024x1024.jpg)
![[Obayashi] MTP2022 KPIs — Operating Profit ~2x Target, ROE 14.4%](https://japan-equity.com/wp-content/uploads/2026/07/p25_sq-1024x1024.jpg)
![[Obayashi] Cash Allocation — ¥420bn Investment CF Over Five Years](https://japan-equity.com/wp-content/uploads/2026/07/p26_sq-1024x1024.jpg)
![[Obayashi] Green Energy — 44 Plants, 344MW, and the Green Hydrogen Challenge](https://japan-equity.com/wp-content/uploads/2026/07/p21_sq-1024x1024.jpg)
![[Obayashi] Tackling the Labor Shortage — Robotics Construction®](https://japan-equity.com/wp-content/uploads/2026/07/p14_sq-1024x1024.jpg)
