
This article is based on publicly available IR materials and is not a recommendation to buy or sell any specific securities.
NTN Corporation announced its Consolidated Financial Results of FY2025 (the fiscal year ended March 31, 2026) on May 15, 2026. Net sales came to 826.3 billion yen (+0.1% YoY) and operating income to 31.0 billion yen (+8.1 billion yen YoY), with both sales and operating income increasing year on year and versus the previously announced forecast. Profit attributable to owners of parent turned positive at 12.9 billion yen, compared with a loss of 23.8 billion yen in FY2024. For FY2026, the company forecasts net sales of 810.0 billion yen, operating income of 33.0 billion yen and profit attributable to owners of parent of 15.0 billion yen, and plans an annual dividend of ¥13 per share, up ¥2 from the previous fiscal year.
Consolidated Results (Full-Year Actual)
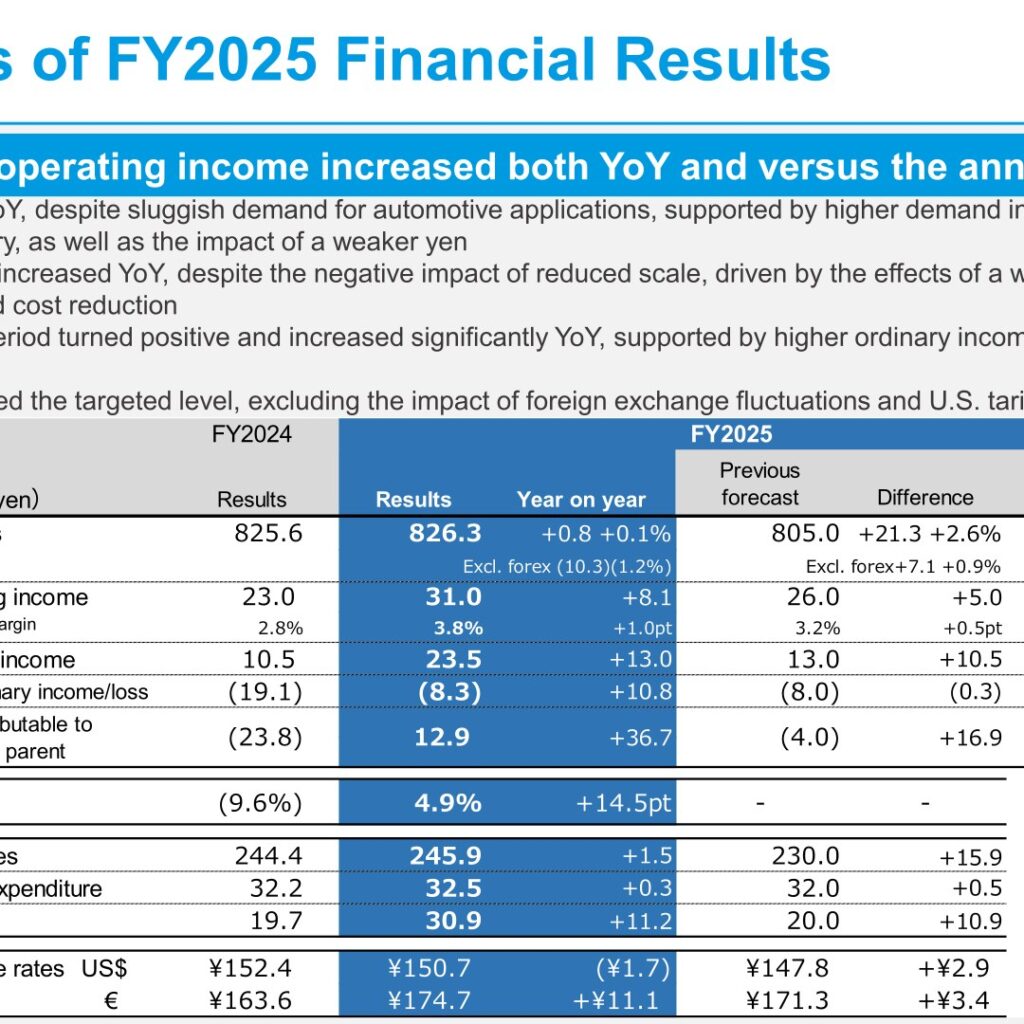
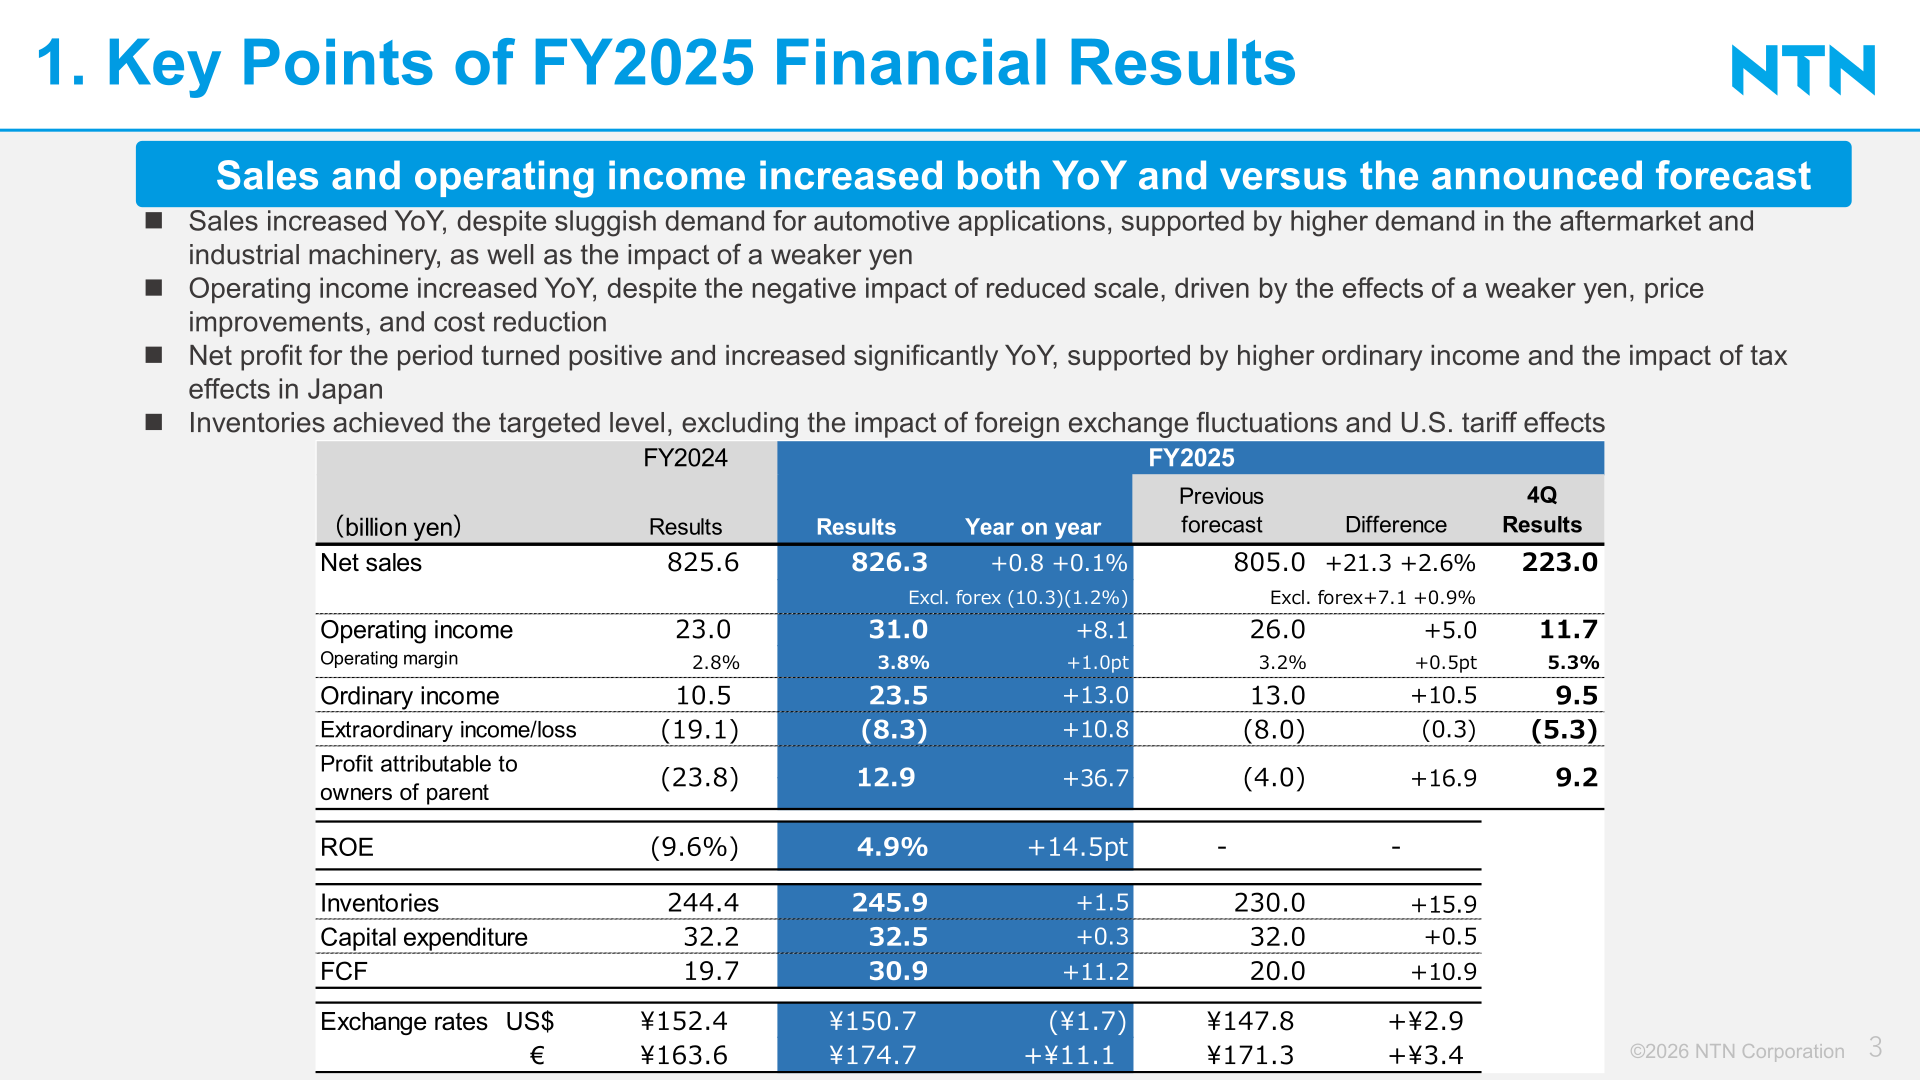
According to the presentation, sales increased YoY despite sluggish demand for automotive applications, supported by higher demand in the aftermarket and industrial machinery, as well as the impact of a weaker yen. Operating income increased YoY, despite the negative impact of reduced scale, driven by the effects of a weaker yen, price improvements, and cost reduction. Net profit for the period turned positive and increased significantly YoY, supported by higher ordinary income and the impact of tax effects in Japan. Inventories achieved the targeted level, excluding the impact of foreign exchange fluctuations and U.S. tariff effects. The operating margin improved to 3.8% from 2.8%, and ROE was 4.9% versus (9.6%) a year earlier. Free cash flow was 30.9 billion yen, up 11.2 billion yen. Average exchange rates were ¥150.7 to the US dollar and ¥174.7 to the euro.
| Item (billion yen) | FY2024 Results | FY2025 Results | Year on year | Previous forecast | Difference |
|---|---|---|---|---|---|
| Net sales | 825.6 | 826.3 | +0.8 (+0.1%) | 805.0 | +21.3 (+2.6%) |
| Operating income | 23.0 | 31.0 | +8.1 | 26.0 | +5.0 |
| Operating margin | 2.8% | 3.8% | +1.0pt | 3.2% | +0.5pt |
| Ordinary income | 10.5 | 23.5 | +13.0 | 13.0 | +10.5 |
| Extraordinary income/loss | (19.1) | (8.3) | +10.8 | (8.0) | (0.3) |
| Profit attributable to owners of parent | (23.8) | 12.9 | +36.7 | (4.0) | +16.9 |
| ROE | (9.6%) | 4.9% | +14.5pt | – | – |
| Inventories | 244.4 | 245.9 | +1.5 | 230.0 | +15.9 |
| Capital expenditure | 32.2 | 32.5 | +0.3 | 32.0 | +0.5 |
| FCF | 19.7 | 30.9 | +11.2 | 20.0 | +10.9 |
In the analysis of operating income (FY2024 results vs FY2025 results), positive factors totaled 18.9 billion yen, consisting of a decrease in variable costs (+8.4), sales price level (+5.8), structural reform effects (+3.2), exchange rates (+1.3) and a decrease in personnel costs and expenses (+0.2). Negative factors totaled (10.8) billion yen, consisting of scale effects, etc. (8.7) and tariff impacts (2.1). On tariffs, the cost impact was (8.3) billion yen against passing-on to selling price of +6.2 billion yen, for a P&L impact of (2.1) billion yen.
Segment Results
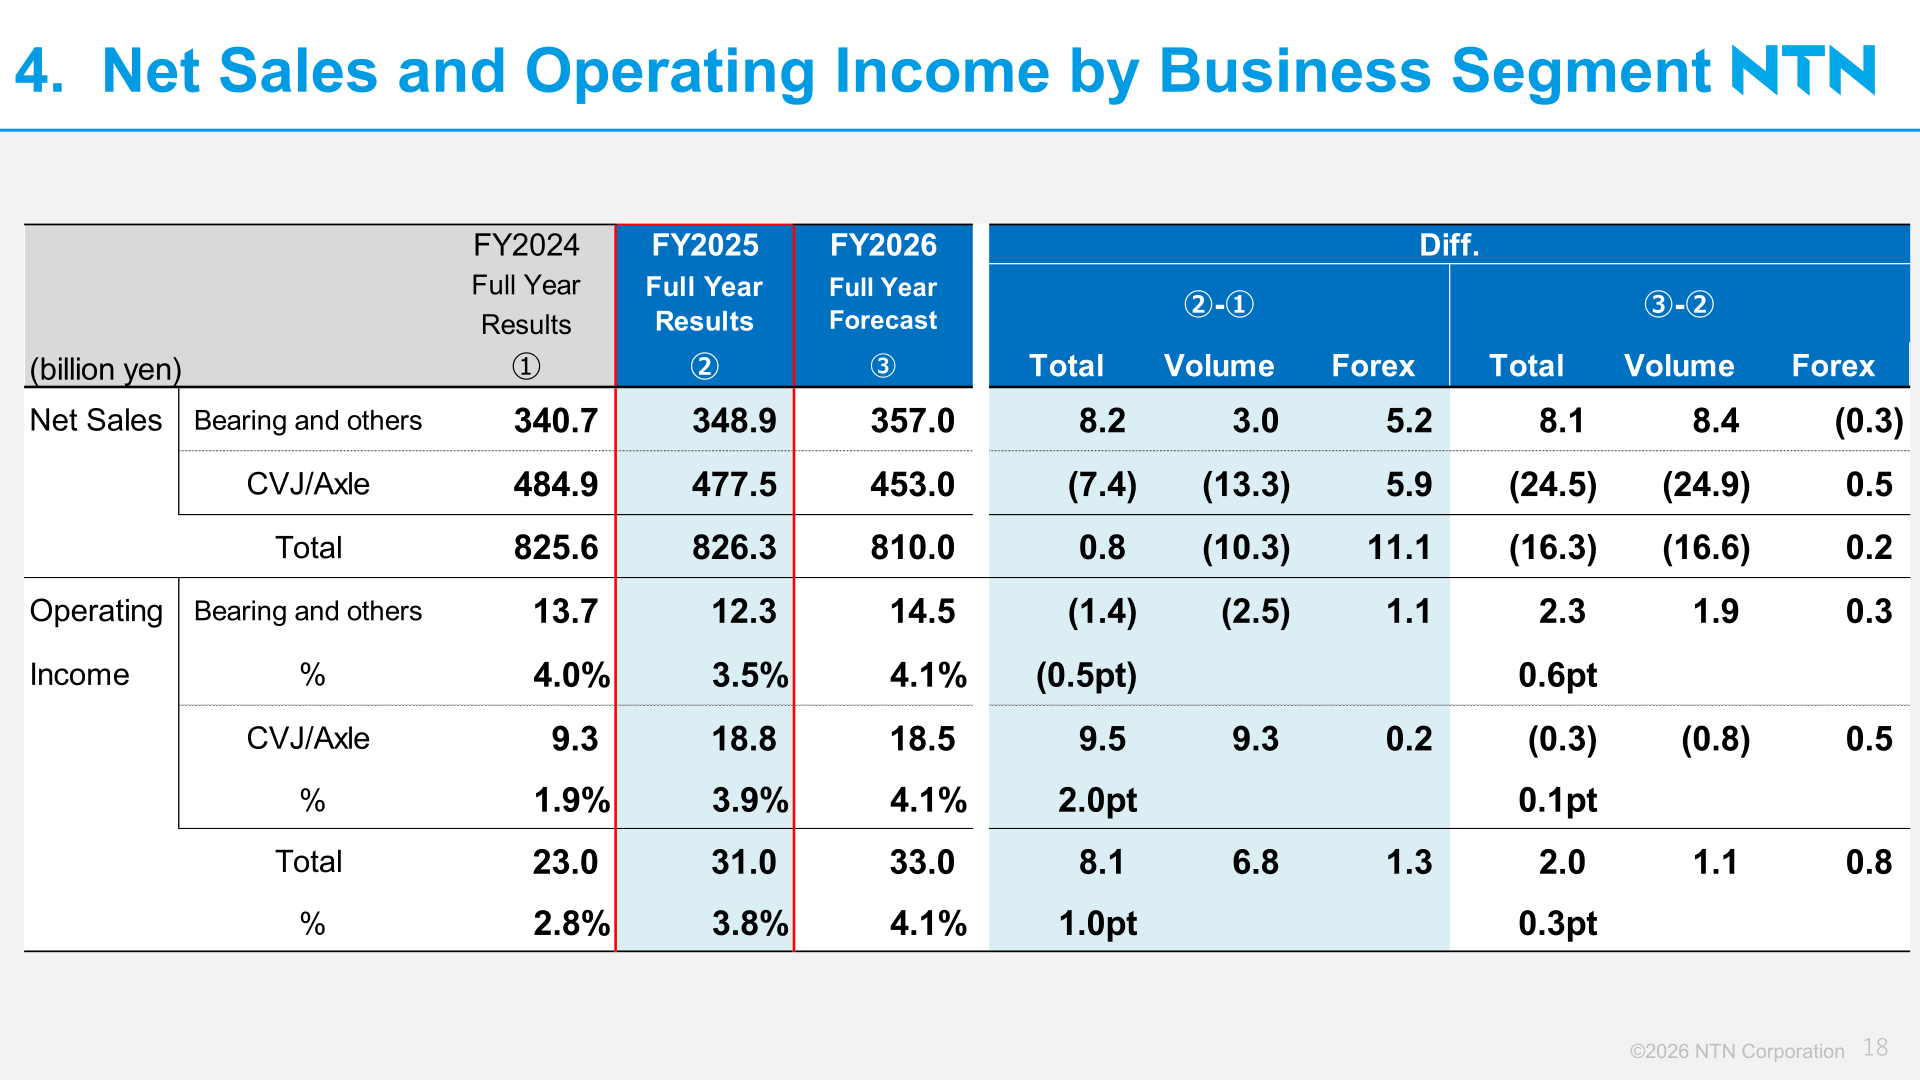
By business segment, Bearing and others recorded net sales of 348.9 billion yen (+8.2 billion yen YoY) and operating income of 12.3 billion yen ((1.4) billion yen YoY), with the operating margin declining to 3.5% from 4.0%. CVJ/Axle recorded net sales of 477.5 billion yen ((7.4) billion yen YoY) and operating income of 18.8 billion yen (+9.5 billion yen YoY), with the operating margin improving to 3.9% from 1.9%. The YoY change in CVJ/Axle sales consisted of (13.3) billion yen in volume and +5.9 billion yen in forex.
| Segment (billion yen) | Metric | FY2024 Results | FY2025 Results | Diff. (Total) | Volume | Forex |
|---|---|---|---|---|---|---|
| Bearing and others | Net sales | 340.7 | 348.9 | 8.2 | 3.0 | 5.2 |
| CVJ/Axle | Net sales | 484.9 | 477.5 | (7.4) | (13.3) | 5.9 |
| Total | Net sales | 825.6 | 826.3 | 0.8 | (10.3) | 11.1 |
| Bearing and others | Operating income | 13.7 | 12.3 | (1.4) | (2.5) | 1.1 |
| Bearing and others | Operating margin | 4.0% | 3.5% | (0.5pt) | ||
| CVJ/Axle | Operating income | 9.3 | 18.8 | 9.5 | 9.3 | 0.2 |
| CVJ/Axle | Operating margin | 1.9% | 3.9% | 2.0pt | ||
| Total | Operating income | 23.0 | 31.0 | 8.1 | 6.8 | 1.3 |
| Total | Operating margin | 2.8% | 3.8% | 1.0pt |
By company location (excluding intragroup sales), FY2025 net sales were 216.4 billion yen in Japan (+1.1 billion yen YoY), 262.5 billion yen in the Americas ((7.0) billion yen), 193.6 billion yen in Europe (+7.2 billion yen) and 153.9 billion yen in Asia and others ((0.6) billion yen).
FY2026 Forecast
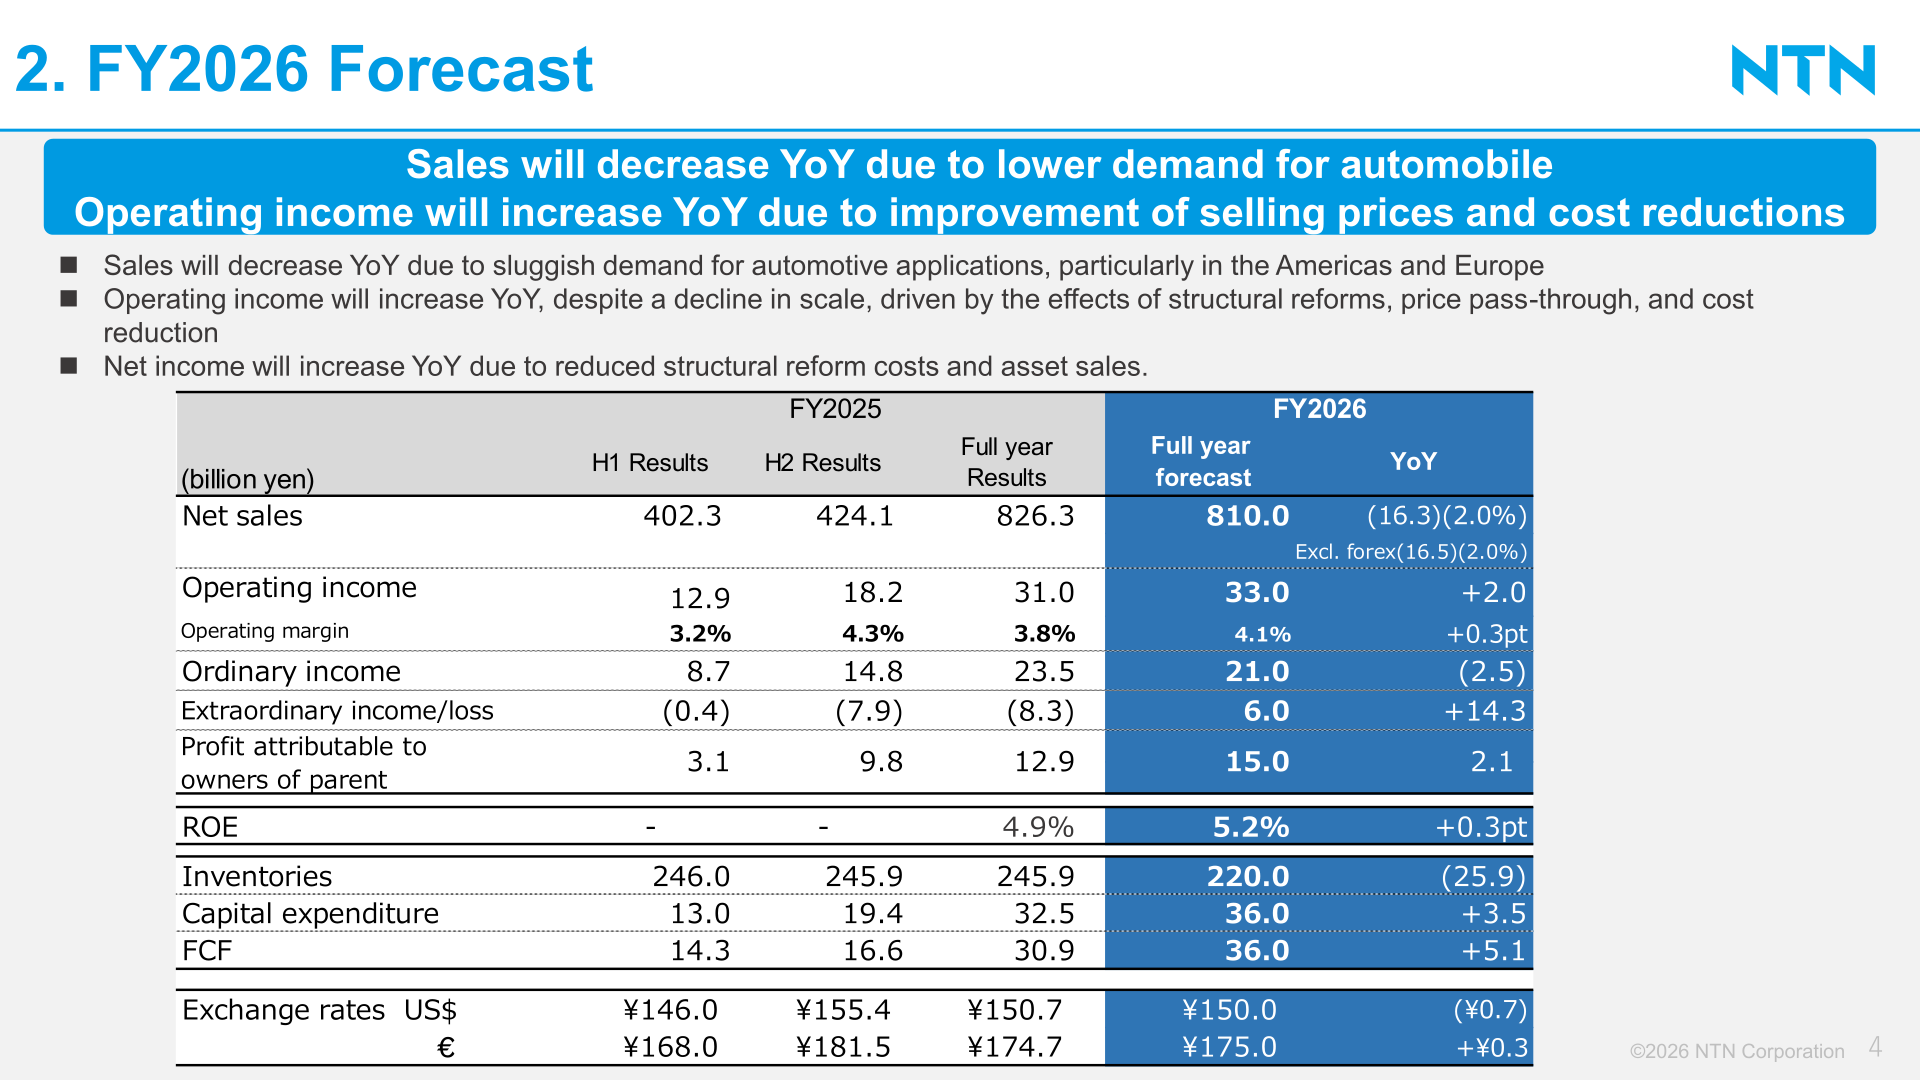
For FY2026, the company expects sales to decrease YoY due to sluggish demand for automotive applications, particularly in the Americas and Europe. Operating income is expected to increase YoY, despite a decline in scale, driven by the effects of structural reforms, price pass-through, and cost reduction. Net income is expected to increase YoY due to reduced structural reform costs and asset sales. Assumed exchange rates are ¥150.0 to the US dollar and ¥175.0 to the euro. By segment, Bearing and others expects sales and operating income to increase YoY (net sales 357.0 billion yen, operating income 14.5 billion yen), while CVJ and Axle expects sales and operating income to decrease YoY (net sales 453.0 billion yen, operating income 18.5 billion yen). The presentation also notes that NSK Ltd. and NTN Corporation have reached a basic agreement to establish a joint holding company by way of a joint share transfer and to integrate their businesses, and have executed a memorandum of understanding; any effects regarding this are not factored into the current forecasts.
| Item (billion yen) | FY2025 Full year Results | FY2026 Full year forecast | YoY |
|---|---|---|---|
| Net sales | 826.3 | 810.0 | (16.3) ((2.0%)) |
| Operating income | 31.0 | 33.0 | +2.0 |
| Operating margin | 3.8% | 4.1% | +0.3pt |
| Ordinary income | 23.5 | 21.0 | (2.5) |
| Extraordinary income/loss | (8.3) | 6.0 | +14.3 |
| Profit attributable to owners of parent | 12.9 | 15.0 | +2.1 |
| ROE | 4.9% | 5.2% | +0.3pt |
| Inventories | 245.9 | 220.0 | (25.9) |
| Capital expenditure | 32.5 | 36.0 | +3.5 |
| FCF | 30.9 | 36.0 | +5.1 |
Shareholder Returns
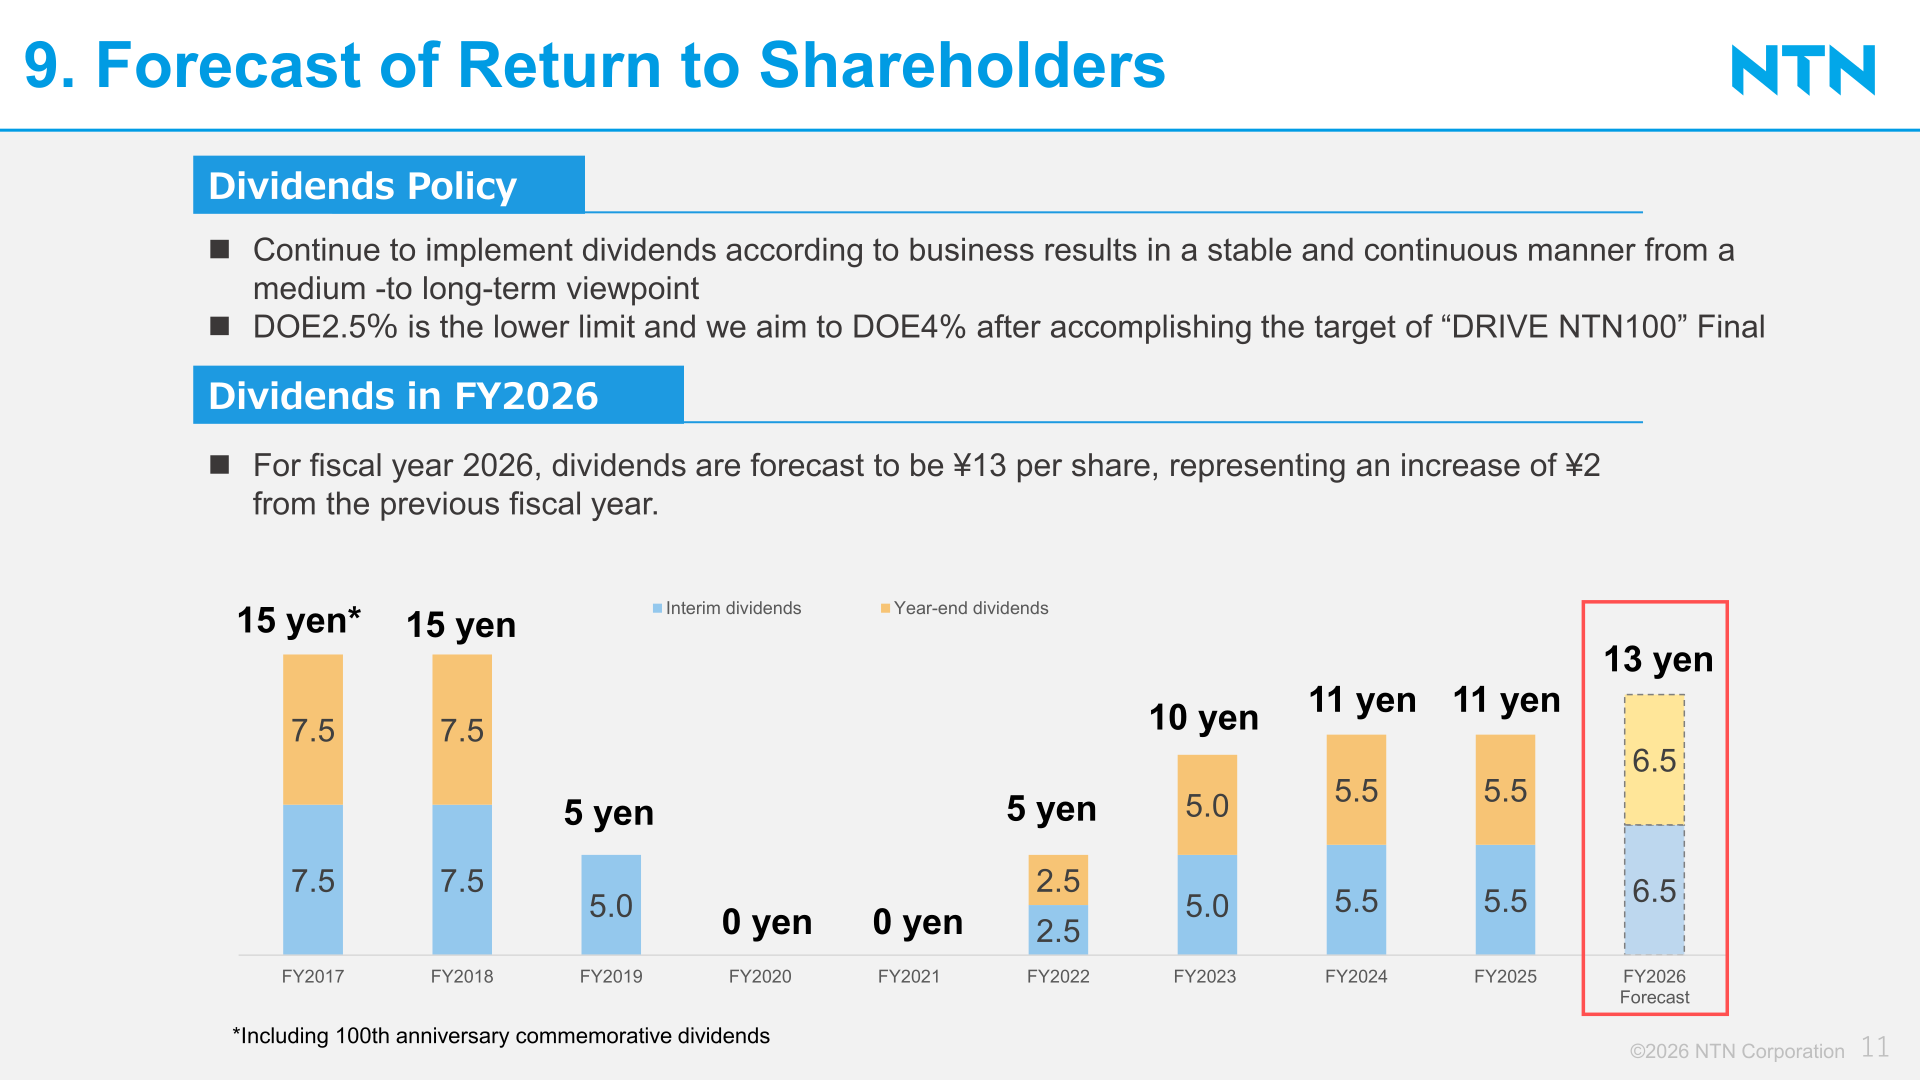
The FY2025 annual dividend is ¥11.0 per share (interim ¥5.5 / year-end ¥5.5). For fiscal year 2026, dividends are forecast to be ¥13 per share (interim ¥6.5 / year-end ¥6.5), representing an increase of ¥2 from the previous fiscal year. Under its dividend policy, the company will continue to implement dividends according to business results in a stable and continuous manner from a medium- to long-term viewpoint; DOE 2.5% is the lower limit, and it aims for DOE 4% after accomplishing the target of “DRIVE NTN100” Final.
| Item | FY2025 | FY2026 Forecast |
|---|---|---|
| Annual dividend per share | ¥11.0 | ¥13.0 |
| Interim | ¥5.5 | ¥6.5 |
| Year-end | ¥5.5 | ¥6.5 |
Medium-Term Plan / Topics
Structural reform under “DRIVE NTN100” Final (35 billion yen over 3 years) is progressing ahead of plan; as an effect of structural reforms, the company plans to achieve an improvement of approximately ¥10.0 billion by the third year compared with FY2023, with production reorganization promoted mainly in the Americas and China. In the aftermarket business, the company added 41 new distributors in FY2025, has expanded inventory for popular aftermarket products (over approximately 4,000 part numbers) and has begun establishing semi-standard inventory for MRO and other applications (approximately 800 part numbers). In its vision for FY2035, the company aims to achieve and further improve ROE that consistently exceeds shareholder capital cost, to increase the share of aftermarket sales to 40% or more, and to achieve carbon neutrality; for both Bearing and others and CVJ/Axle, it targets an operating margin above 10% from the next medium-term management plan onward.
This article is an analysis based on publicly available information and is not a recommendation to buy or sell any specific securities. Investment decisions are your own responsibility.
![[Obayashi] Investors’ Guide 2026 — The Complete 24-Article Breakdown](https://japan-equity.com/wp-content/uploads/2026/07/hub_cover-1024x1024.png)
![[Obayashi] IR & SR Policy — Feeding Dialogue Back into Management](https://japan-equity.com/wp-content/uploads/2026/07/p32_sq-1024x1024.jpg)
![[Obayashi] Real Estate Development — 18.7% Margin, ¥287.7bn Unrealized Gains](https://japan-equity.com/wp-content/uploads/2026/07/p20_sq-1024x1024.jpg)
![[Obayashi] Domestic Civil Engineering — Resilience Spending Supports 9.6% Margin](https://japan-equity.com/wp-content/uploads/2026/07/p11_sq-1024x1024.jpg)
![[Obayashi] Share Price & External Ratings — vs TOPIX, ESG Index Inclusion](https://japan-equity.com/wp-content/uploads/2026/07/p40_sq-1024x1024.jpg)
![[Construction] ¥75.5tn Investment, Shrinking Workforce — Big-5 Market Share](https://japan-equity.com/wp-content/uploads/2026/07/p12_sq-1024x1024.jpg)



![[Obayashi] Capital Policy & Shareholder Returns — ROE 10%+, DOE ~5%, ¥100bn Buyback](https://japan-equity.com/wp-content/uploads/2026/07/p27_sq-1024x1024.jpg)
![[Obayashi] Reducing Cross-Shareholdings — ¥285.2bn Sold in Five Years](https://japan-equity.com/wp-content/uploads/2026/07/p29_sq-1024x1024.jpg)
![[Obayashi] ¥750bn Investment Plan — ¥300bn to Development, ¥190bn to Tech/DX](https://japan-equity.com/wp-content/uploads/2026/07/p30_sq-1024x1024.jpg)
![[Obayashi] MTP2022 KPIs — Operating Profit ~2x Target, ROE 14.4%](https://japan-equity.com/wp-content/uploads/2026/07/p25_sq-1024x1024.jpg)
![[Obayashi] Cash Allocation — ¥420bn Investment CF Over Five Years](https://japan-equity.com/wp-content/uploads/2026/07/p26_sq-1024x1024.jpg)
![[Obayashi] Green Energy — 44 Plants, 344MW, and the Green Hydrogen Challenge](https://japan-equity.com/wp-content/uploads/2026/07/p21_sq-1024x1024.jpg)
![[Obayashi] Tackling the Labor Shortage — Robotics Construction®](https://japan-equity.com/wp-content/uploads/2026/07/p14_sq-1024x1024.jpg)
