
This article is based on publicly available IR materials and is not a recommendation to buy or sell any specific securities.
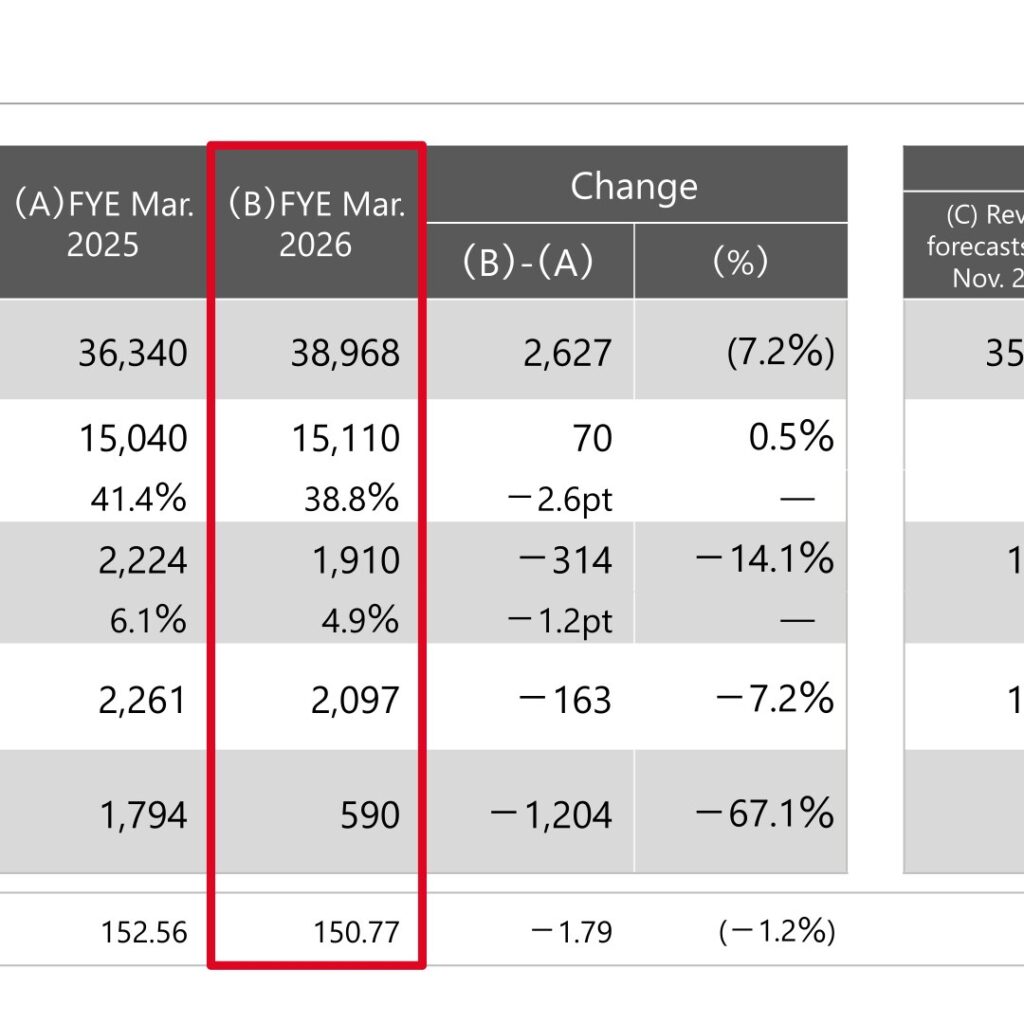
JANOME Corporation (Securities code: 6445) reported consolidated results for FYE March 2026 in its “Consolidated Results Highlights” presentation dated May 2026. Sales rose to 38,968 million yen, up 2,627 million yen (7.2%) year on year, while operating profit declined 14.1% to 1,910 million yen and profit attributable to owners of parent fell 67.1% to 590 million yen. Results nevertheless exceeded the revised forecasts announced in November 2025, with sales 3,968 million yen and operating profit 610 million yen above those figures. Note: the materials label the reporting period “FYE Mar. 2026”; this site classifies the company’s most recent completed fiscal year as FY2025 in the title.
Consolidated Results (Full-Year Actual)
Sales increased from 36,340 million yen to 38,968 million yen, while the gross profit margin declined from 41.4% to 38.8%. Operating profit fell 314 million yen year on year to 1,910 million yen. The company’s year-on-year operating profit bridge attributes +934 million yen to sales volume increase, −300 million yen to cost ratio change (with increased costs at the die-cast business from higher raw materials, freight, and labor costs), −300 million yen to operating expenses increase (increased overseas sales activity and rising labor costs from base pay increases), and −647 million yen to foreign exchange loss. The average exchange rate was 150.77 JPY/USD versus 152.56 in the prior year.
| Item [Million Yen] | FYE Mar. 2025 (A) | FYE Mar. 2026 (B) | Change (B)-(A) | Change (%) |
|---|---|---|---|---|
| Sales | 36,340 | 38,968 | 2,627 | 7.2% |
| Gross Profit | 15,040 | 15,110 | 70 | 0.5% |
| Gross Profit Margin | 41.4% | 38.8% | −2.6pt | ― |
| Operating Profit | 2,224 | 1,910 | −314 | −14.1% |
| Operating Profit Margin | 6.1% | 4.9% | −1.2pt | ― |
| Ordinary Profit | 2,261 | 2,097 | −163 | −7.2% |
| Profit Attributable to Owners of parent | 1,794 | 590 | −1,204 | −67.1% |
| Exchange Rate (JPY/USD) | 152.56 | 150.77 | −1.79 | −1.2% |
Against the revised forecasts announced in November 2025 (sales of 35,000 million yen, operating profit of 1,300 million yen, ordinary profit of 1,200 million yen, and profit attributable to owners of parent of 200 million yen), results came in higher by 3,968 million yen, 610 million yen, 897 million yen, and 390 million yen respectively. On a non-consolidated basis, sales were 23,920 million yen (−1.3%) and operating profit was 204 million yen (−80.0%).
Segment Results
Household Equipment sales grew to 29,787 million yen (76.4% of sales) but segment operating profit declined 304 million yen to 1,854 million yen. Industrial Equipment sales rose 1,314 million yen to 6,155 million yen, while its operating loss widened to −543 million yen. Within Industrial Equipment, Robot & Servo Press posted net sales of 3,762 million yen and operating profit of 88 million yen (an improvement of 174 million yen from −85 million yen), as desktop robots secured steady orders in China and other markets and presses benefited from rising automotive demand in India and Korea. Die-cast net sales rose to 2,392 million yen, but orders improvement notwithstanding, high cost ratios and logistics costs prevented a return to profitability, with an operating loss of −632 million yen. The IT segment increased both sales (2,896 million yen) and operating profit (537 million yen).
| Segment [Million Yen] | Metric | FYE Mar. 2025 | FYE Mar. 2026 | Change |
|---|---|---|---|---|
| Household Equip. | Sales (Composition) | 28,773 (79.2%) | 29,787 (76.4%) | 1,013 / −2.7pt |
| Household Equip. | Operating Profit | 2,159 | 1,854 | −304 |
| Industrial Equip. | Sales (Composition) | 4,841 (13.3%) | 6,155 (15.8%) | 1,314 / +2.5pt |
| Industrial Equip. | Operating Profit | −423 | −543 | −120 |
| IT | Sales (Composition) | 2,529 (7.0%) | 2,896 (7.4%) | 366 / +0.5pt |
| IT | Operating Profit | 401 | 537 | 136 |
| Others | Sales (Composition) | 195 (0.5%) | 128 (0.3%) | −67 / −0.2pt |
| Others | Operating Profit | 88 | 62 | −25 |
| Total | Sales | 36,340 | 38,968 | 2,627 |
| Total | Operating Profit | 2,224 | 1,910 | −314 |
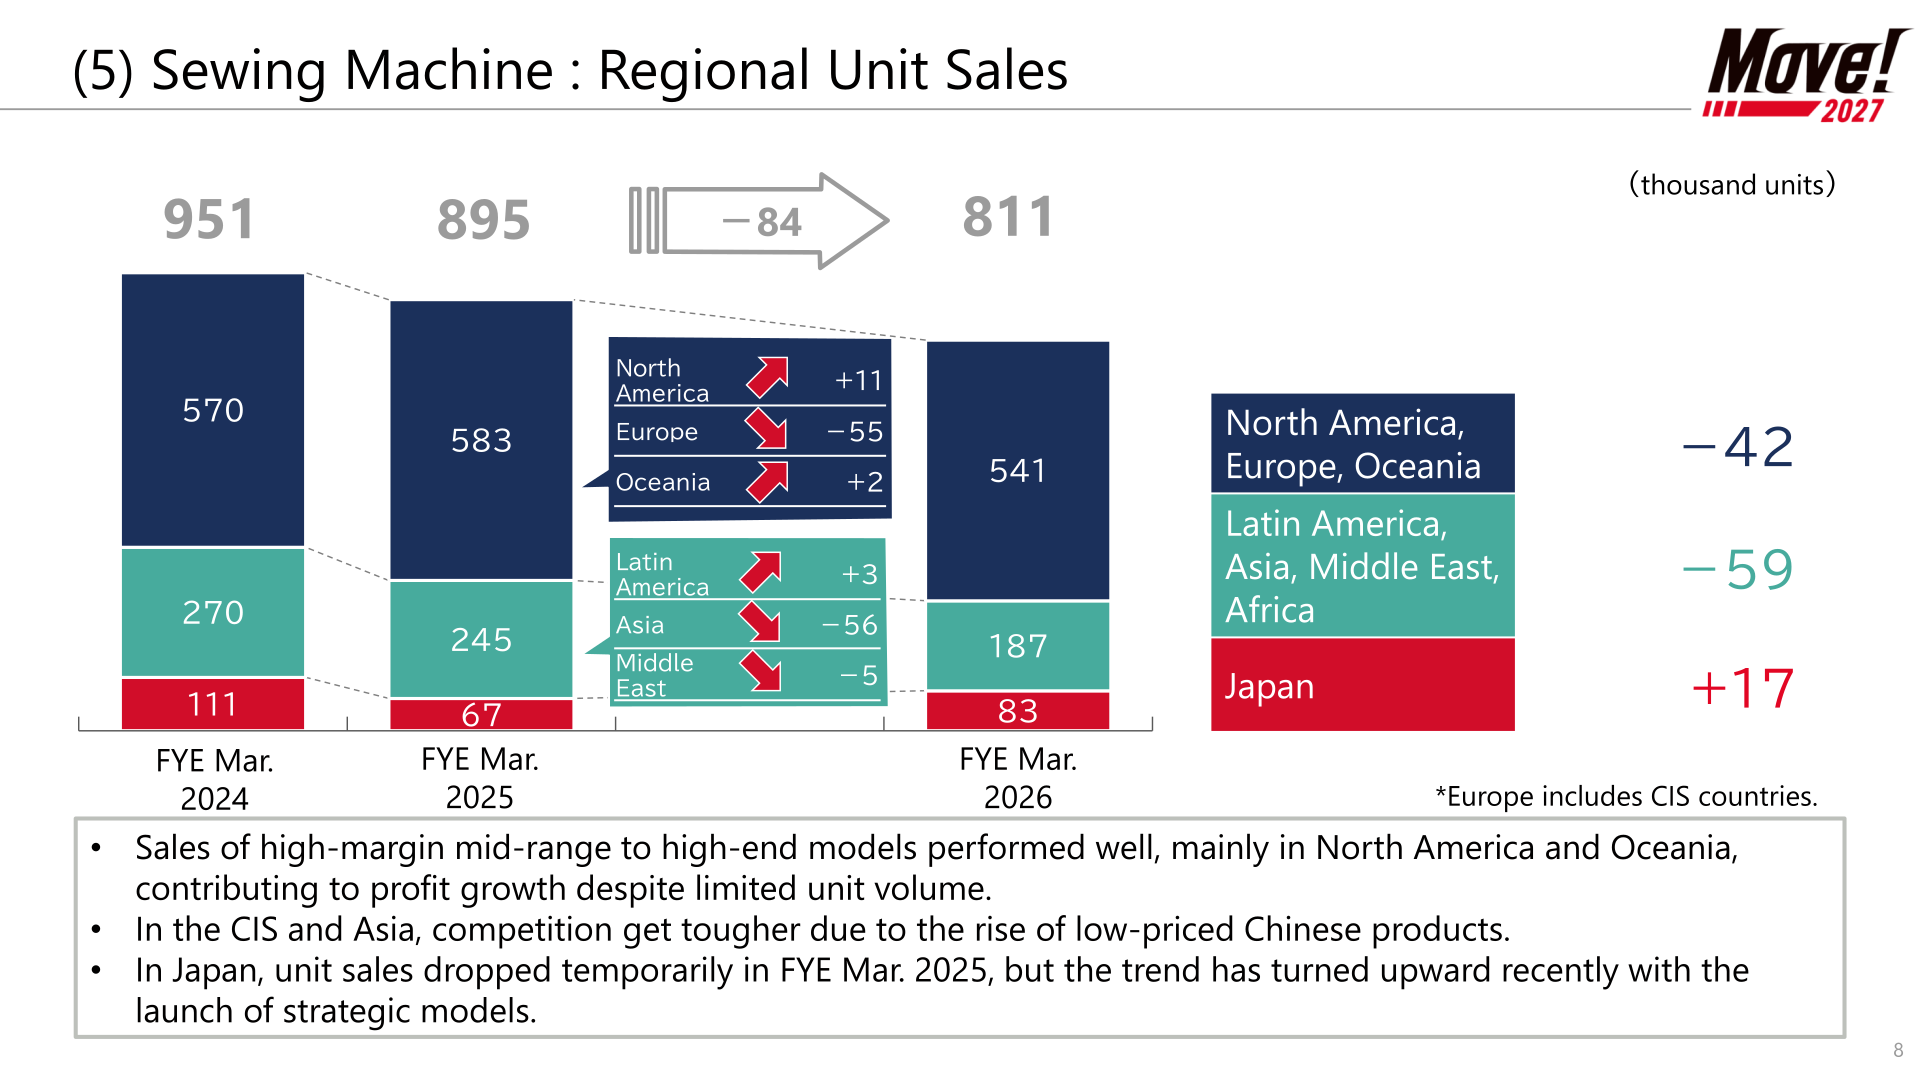
Sewing machine unit sales totaled 811 thousand units, down 84 thousand units from 895 thousand units in FYE Mar. 2025. By region, North America, Europe and Oceania sold 541 thousand units (−42), Latin America, Asia, Middle East and Africa 187 thousand units (−59), and Japan 83 thousand units (+17). The company notes that sales of high-margin mid-range to high-end models performed well, mainly in North America and Oceania, contributing to profit growth despite limited unit volume; that competition in the CIS and Asia has become tougher due to the rise of low-priced Chinese products; and that unit sales in Japan, which dropped temporarily in FYE Mar. 2025, have recently turned upward with the launch of strategic models.
FYE March 2027 Forecast
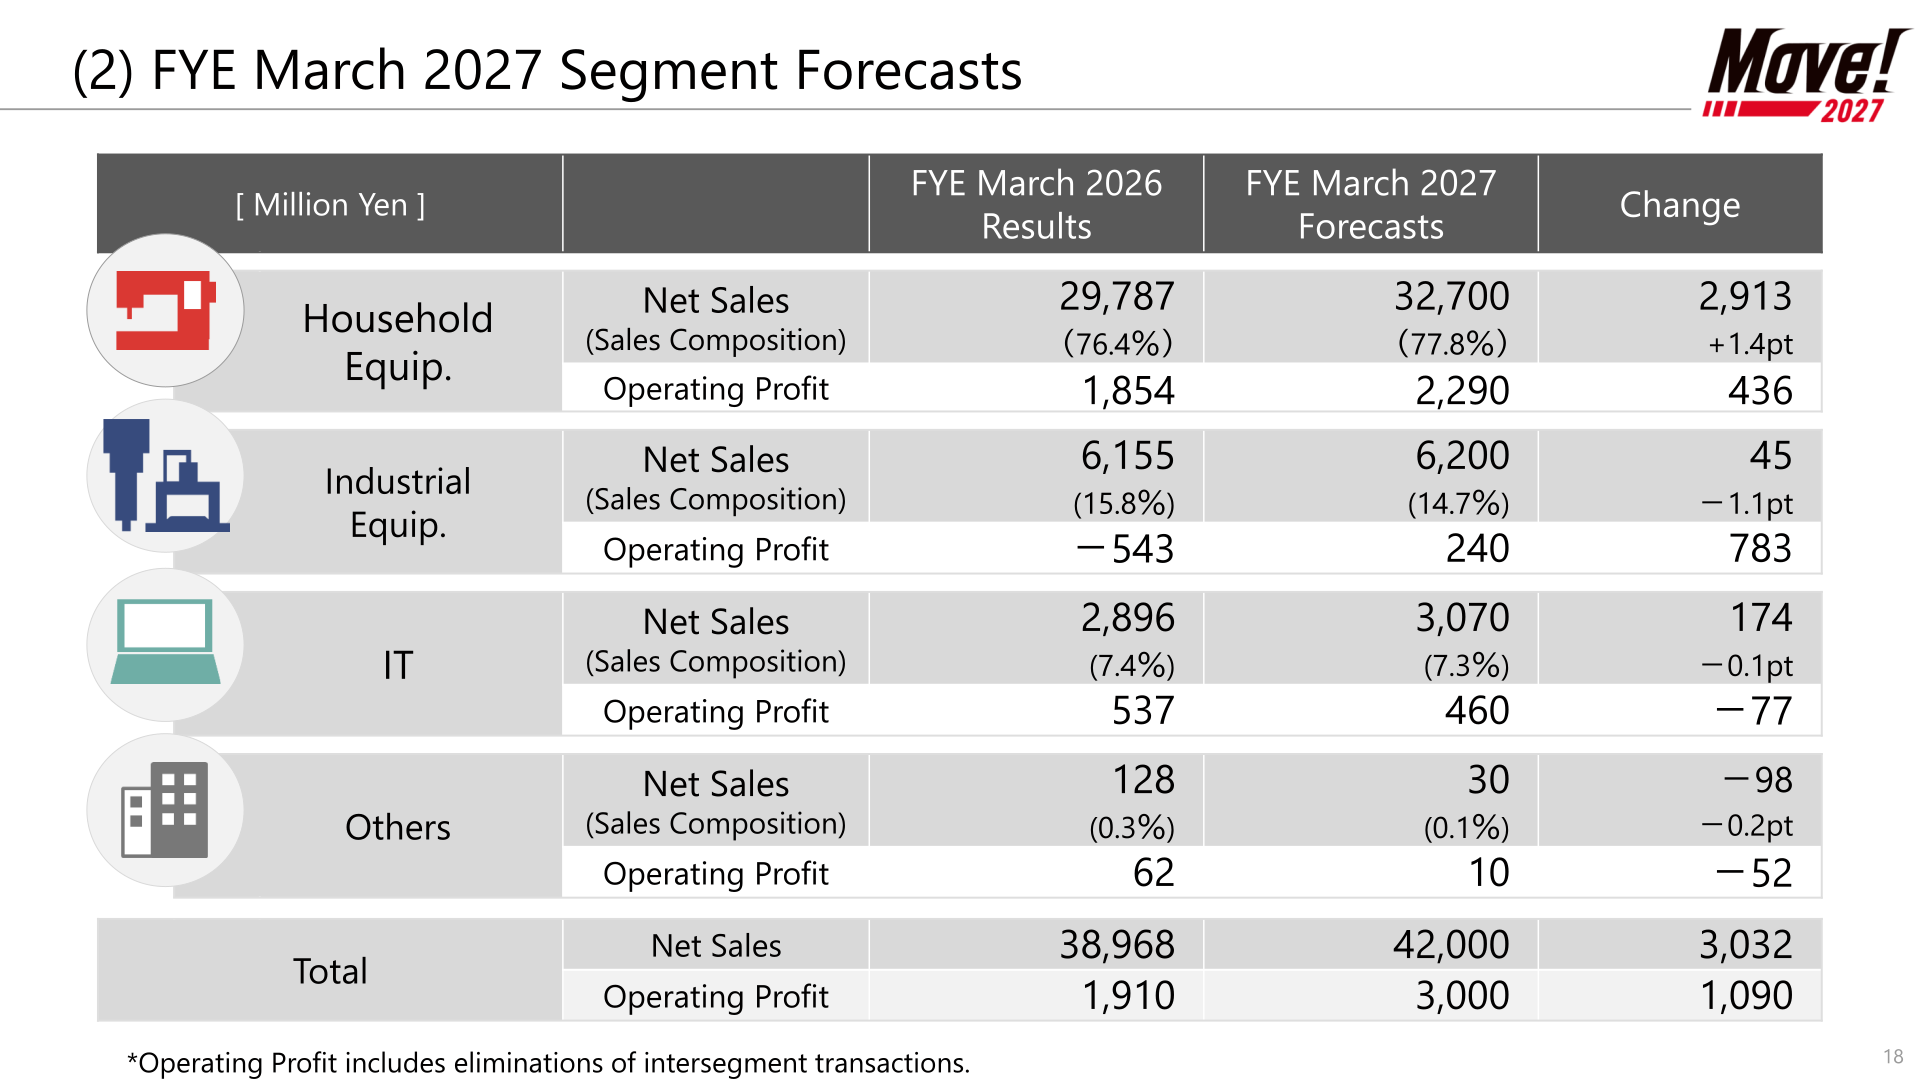
For FYE March 2027, the company forecasts net sales of 42,000 million yen (+3,032 million yen), operating profit of 3,000 million yen (+1,090 million yen), ordinary profit of 3,000 million yen (+903 million yen), and profit attributable to owners of parent of 2,000 million yen (+1,410 million yen). By segment, Household Equipment net sales are planned at 32,700 million yen with operating profit of 2,290 million yen, and Industrial Equipment is projected to return to segment profitability with operating profit of 240 million yen. In sewing machines, the company forecasts unit sales of 601 thousand units in North America, Europe and Oceania (+60) and 341 thousand units in Latin America, Asia, Middle East and Africa (+154), with Japan flat at 83 thousand units.
| Item [Million Yen] | FYE Mar. 2026 Results | FYE Mar. 2027 Forecasts | Change |
|---|---|---|---|
| Net Sales | 38,968 | 42,000 | 3,032 |
| Operating Profit | 1,910 | 3,000 | 1,090 |
| Ordinary Profit | 2,097 | 3,000 | 903 |
| Profit Attributable to Owners of parent | 590 | 2,000 | 1,410 |
Shareholder Returns
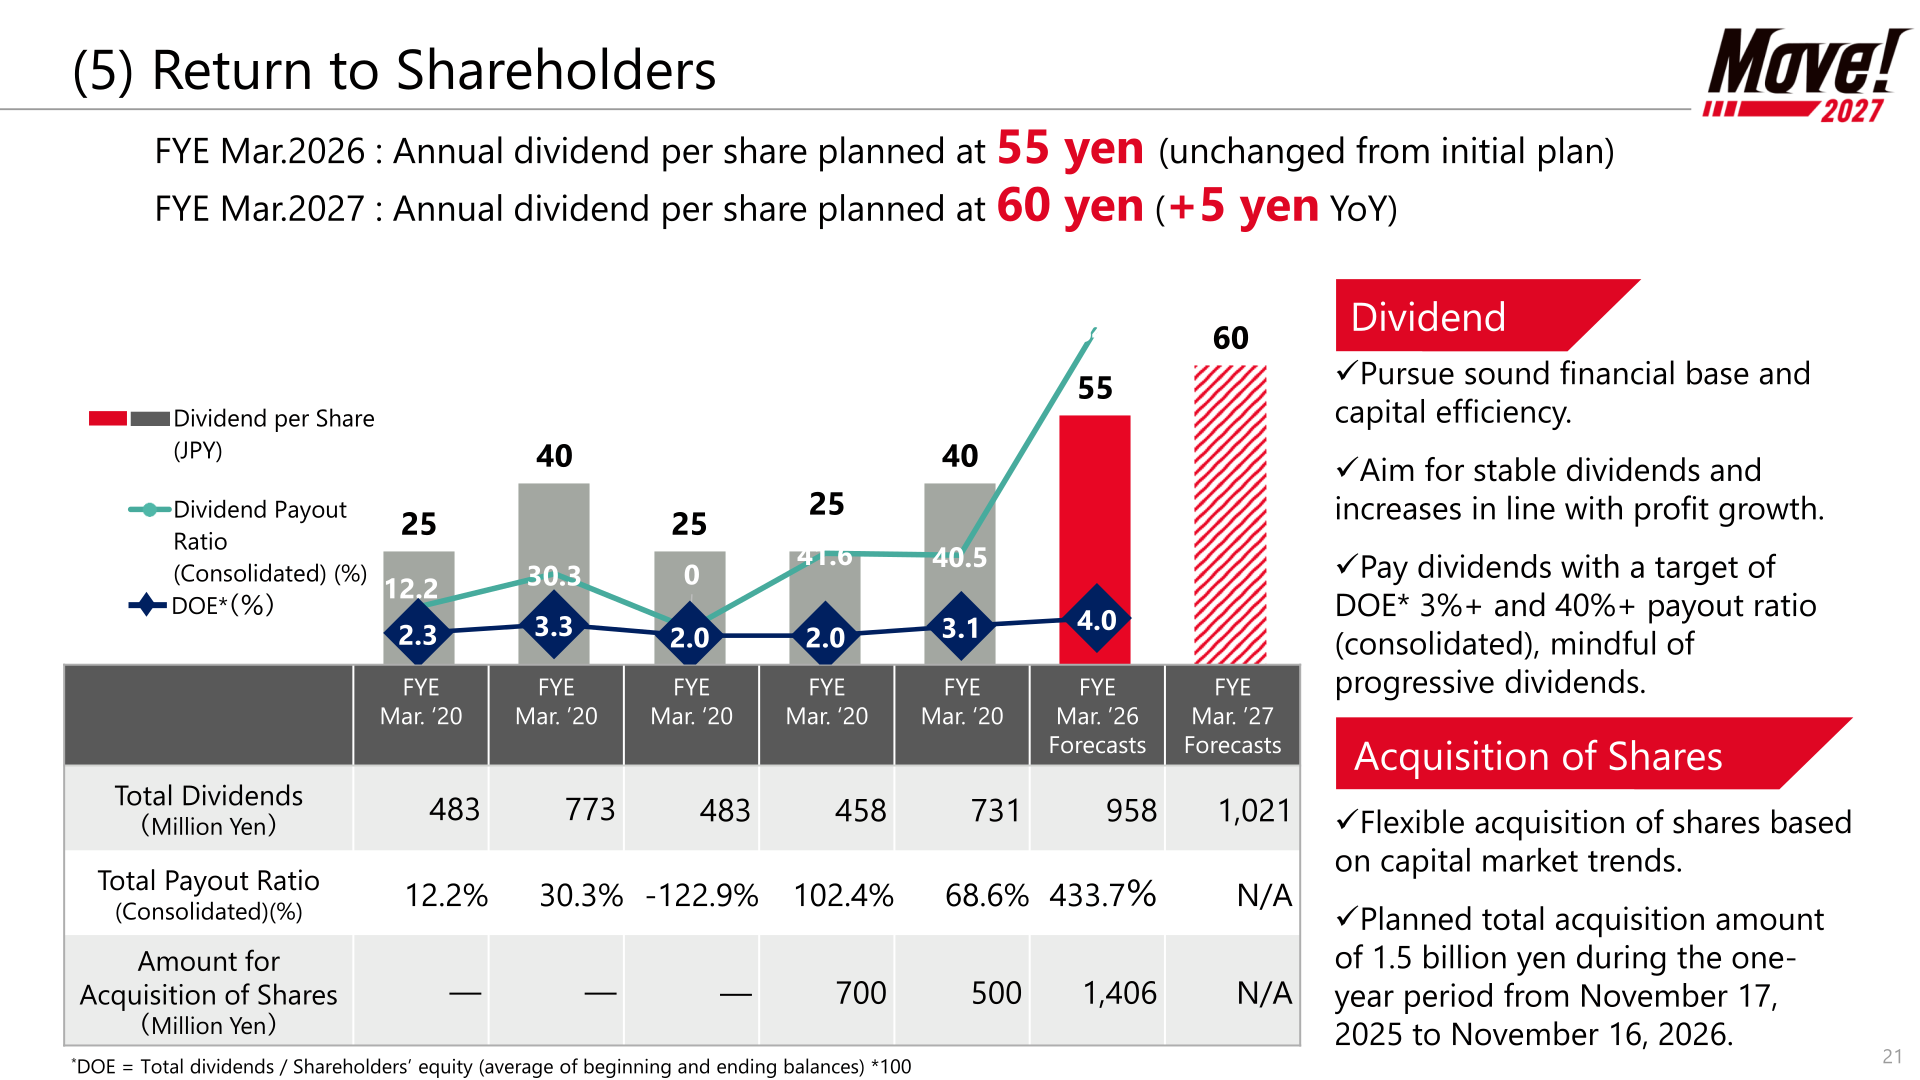
The annual dividend per share for FYE Mar. 2026 is planned at 55 yen, unchanged from the initial plan, and the annual dividend per share for FYE Mar. 2027 is planned at 60 yen, up 5 yen year on year. The company states it will pay dividends with a target of DOE of 3% or more and a consolidated payout ratio of 40% or more, mindful of progressive dividends, and will acquire shares flexibly based on capital market trends, with a planned total acquisition amount of 1.5 billion yen during the one-year period from November 17, 2025 to November 16, 2026.
| Item | FYE Mar. ’26 Forecasts | FYE Mar. ’27 Forecasts |
|---|---|---|
| Dividend per Share (JPY) | 55 | 60 |
| Total Dividends (Million Yen) | 958 | 1,021 |
| Total Payout Ratio (Consolidated) | 433.7% | N/A |
| Amount for Acquisition of Shares (Million Yen) | 1,406 | N/A |
Medium-Term Plan “Move! 2027”
The company is driving initiatives under the “Move! 2027” mid-term business plan to achieve targets of PBR of 1.0x or more and ROE of 8% or more. ROE was 3.4% in FYE Mar. 2024, 5.2% in FYE Mar. 2025, and 1.7% in FYE Mar. 2026, while PBR was 0.37, 0.54, and 0.61 respectively. Measures include improving profitability by strengthening brand power and sales of high value-added products, concentrating sales resources on key markets, optimally allocating cash to growth investments (including human capital investments) and shareholder returns, and improving the efficiency of non-business assets while reducing cross-shareholdings. During FYE Mar. 2026, the company improved capital efficiency through the sale of non-core assets and enhanced shareholder returns with share buybacks and higher dividends. For FYE March 2027, the Industrial Equipment division plans to expand product offerings into new fields (medical, aerospace, batteries, semiconductors) and, in the die-cast business, to drive price revisions and cost reductions to return to profitability this year.
This article is an analysis based on publicly available information and is not a recommendation to buy or sell any specific securities. Investment decisions are your own responsibility.
![[Obayashi] Investors’ Guide 2026 — The Complete 24-Article Breakdown](https://japan-equity.com/wp-content/uploads/2026/07/hub_cover-1024x1024.png)
![[Obayashi] IR & SR Policy — Feeding Dialogue Back into Management](https://japan-equity.com/wp-content/uploads/2026/07/p32_sq-1024x1024.jpg)
![[Obayashi] Real Estate Development — 18.7% Margin, ¥287.7bn Unrealized Gains](https://japan-equity.com/wp-content/uploads/2026/07/p20_sq-1024x1024.jpg)
![[Obayashi] Domestic Civil Engineering — Resilience Spending Supports 9.6% Margin](https://japan-equity.com/wp-content/uploads/2026/07/p11_sq-1024x1024.jpg)
![[Obayashi] Share Price & External Ratings — vs TOPIX, ESG Index Inclusion](https://japan-equity.com/wp-content/uploads/2026/07/p40_sq-1024x1024.jpg)
![[Construction] ¥75.5tn Investment, Shrinking Workforce — Big-5 Market Share](https://japan-equity.com/wp-content/uploads/2026/07/p12_sq-1024x1024.jpg)



![[Obayashi] Capital Policy & Shareholder Returns — ROE 10%+, DOE ~5%, ¥100bn Buyback](https://japan-equity.com/wp-content/uploads/2026/07/p27_sq-1024x1024.jpg)
![[Obayashi] Reducing Cross-Shareholdings — ¥285.2bn Sold in Five Years](https://japan-equity.com/wp-content/uploads/2026/07/p29_sq-1024x1024.jpg)
![[Obayashi] ¥750bn Investment Plan — ¥300bn to Development, ¥190bn to Tech/DX](https://japan-equity.com/wp-content/uploads/2026/07/p30_sq-1024x1024.jpg)
![[Obayashi] MTP2022 KPIs — Operating Profit ~2x Target, ROE 14.4%](https://japan-equity.com/wp-content/uploads/2026/07/p25_sq-1024x1024.jpg)
![[Obayashi] Cash Allocation — ¥420bn Investment CF Over Five Years](https://japan-equity.com/wp-content/uploads/2026/07/p26_sq-1024x1024.jpg)
![[Obayashi] Green Energy — 44 Plants, 344MW, and the Green Hydrogen Challenge](https://japan-equity.com/wp-content/uploads/2026/07/p21_sq-1024x1024.jpg)
![[Obayashi] Tackling the Labor Shortage — Robotics Construction®](https://japan-equity.com/wp-content/uploads/2026/07/p14_sq-1024x1024.jpg)
