
This article is based on publicly available IR materials and is not a recommendation to buy or sell any specific securities.
Note: CKD’s presentation labels the fiscal year ended March 31, 2026 as “FY2026/3”. This article follows our site convention of classifying the most recently completed fiscal year as FY2025 in the title and slug; all labels, units and figures in the text and tables below follow the source materials as reported.
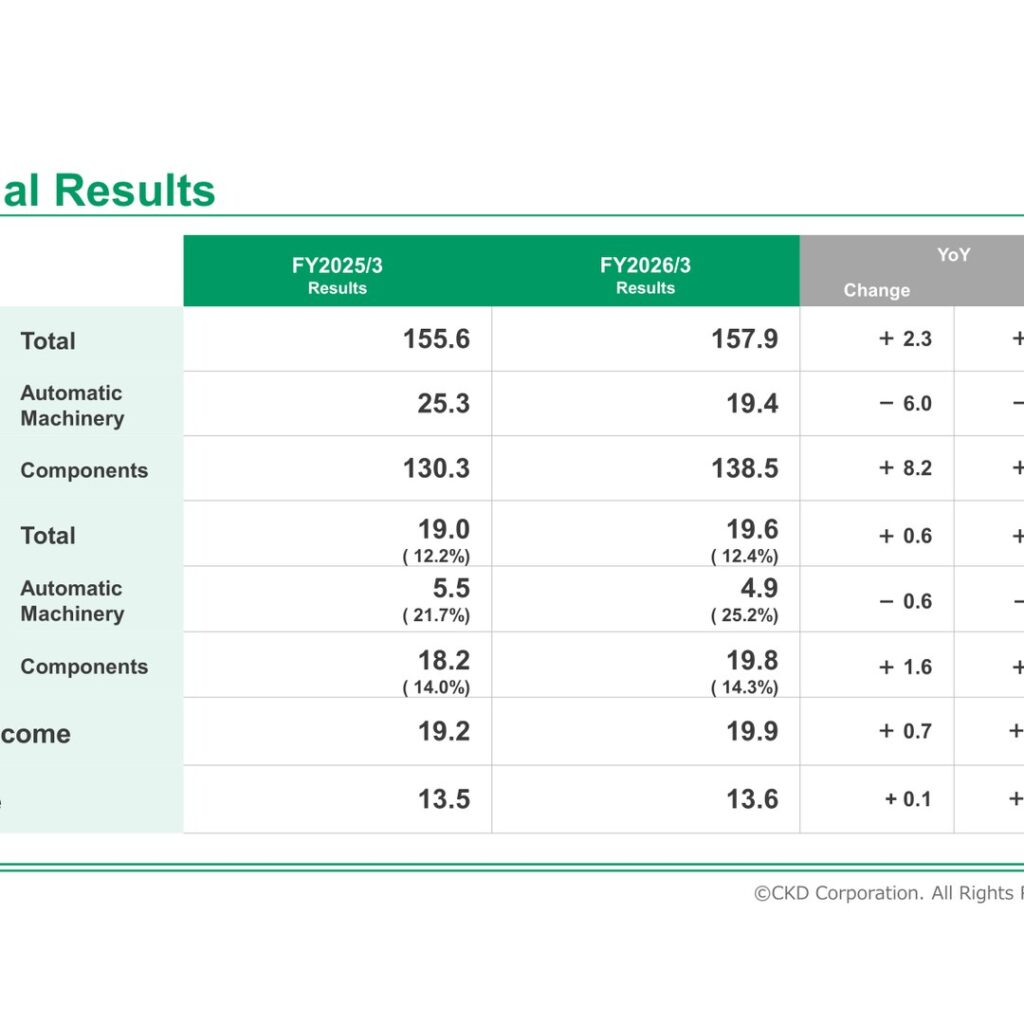
CKD Corporation reported net sales of 157.9 billion JPY for FY2026/3, up 1% year on year, and operating income of 19.6 billion JPY, up 3%. Ordinary income was 19.9 billion JPY and net income was 13.6 billion JPY. The Components segment saw a rapid pickup from late 3Q and an accelerating recovery, while the Automatic Machinery segment recorded lower net sales. For FY2027/3 the company forecasts net sales of 180.0 billion JPY (YoY +14%) and operating income of 24.5 billion JPY (YoY +25%), and it raised the FY2026/3 annual dividend to 81 JPY per share from a previous plan of 67 JPY.
Consolidated Results (Full-Year Actual)
The company describes FY2026/3 as a year in which revenue and profit increased. Automatic Machinery delivered solid performance in packaging services, and Components saw a rapid pickup from late 3Q with an accelerating recovery. Operating margin was 12.4%, up from 12.2% in FY2025/3.
| Item | FY2025/3 Results | FY2026/3 Results | YoY Change | YoY % |
|---|---|---|---|---|
| Net Sales — Total | 155.6 | 157.9 | + 2.3 | + 1 % |
| Net Sales — Automatic Machinery | 25.3 | 19.4 | − 6.0 | − 24 % |
| Net Sales — Components | 130.3 | 138.5 | + 8.2 | + 6 % |
| Operating Income — Total (%) | 19.0 ( 12.2%) | 19.6 ( 12.4%) | + 0.6 | + 3 % |
| Operating Income — Automatic Machinery (%) | 5.5 ( 21.7%) | 4.9 ( 25.2%) | − 0.6 | − 11 % |
| Operating Income — Components (%) | 18.2 ( 14.0%) | 19.8 ( 14.3%) | + 1.6 | + 9 % |
| Ordinary Income | 19.2 | 19.9 | + 0.7 | + 4 % |
| Net Income | 13.5 | 13.6 | + 0.1 | + 1 % |
Unit: bn JPY. The materials note that amounts are rounded to the nearest unit and percentages are rounded, so the total of a breakdown may not equal the total.
In the operating income bridge from FY25/3 full-year (19.0) to FY26/3 full-year (19.6), a YoY change of + 0.6, the company shows a Sales Impact of + 0.7, a Cost Ratio Impact of + 1.0, an SG&A Impact of − 0.9 and an FX Impact of − 0.1. By segment, Automatic Machinery contributed − 1.7 from sales, + 1.0 from cost ratio, + 0 from SG&A and − 0 from FX; Components contributed + 2.3 from sales, − 0.1 from cost ratio, − 0.6 from SG&A and − 0.1 from FX; Others contributed − 0.4 from SG&A. On cost ratio, the materials state that Automatic Machinery improved in both packaging and Lithium-ion battery winding machines, while Components saw low utilization at the new plant. The exchange rates shown are 153 JPY/USD and 21.1 JPY/RMB for FY25/3 full-year, and 151 JPY/USD and 21.2 JPY/RMB for FY26/3 full-year.
On the balance sheet, total assets rose to 226.7 bn JPY at end March 2026 from 210.9 bn JPY a year earlier (+ 15.9), total liabilities declined to 73.2 bn JPY from 74.3 bn JPY (− 1.2), and total net assets increased to 153.6 bn JPY from 136.5 bn JPY (+ 17.0).
Segment Results
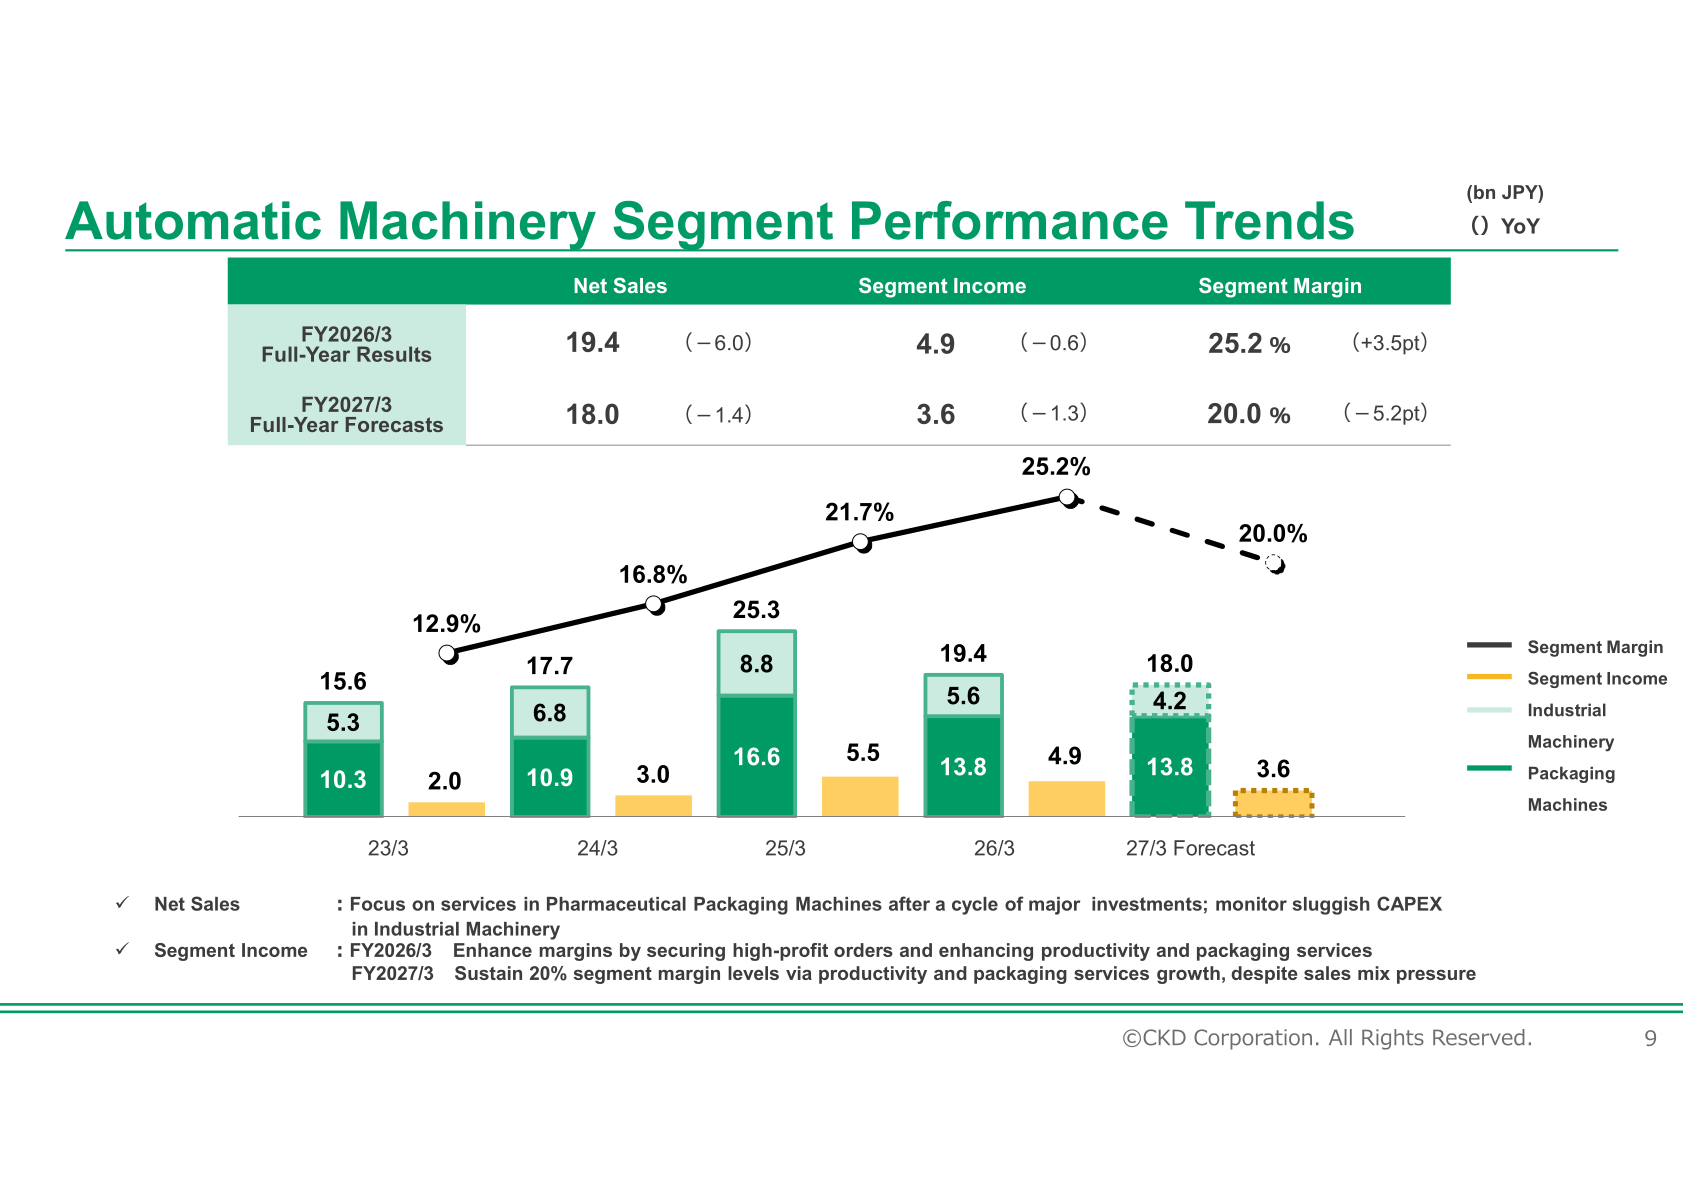
Automatic Machinery net sales were 19.4 bn JPY (− 6.0 YoY) with segment income of 4.9 bn JPY (− 0.6) and a segment margin of 25.2% (+3.5pt). Within the segment, Packaging Machines net sales were 13.8 bn JPY and Industrial Machinery 5.6 bn JPY, against 16.6 bn JPY and 8.8 bn JPY respectively in 25/3. Automatic Machinery orders were 19.1 bn JPY in FY2026/3 (− 2.9 YoY), comprising Packaging Machines 14.1 bn JPY and Industrial Machinery 5.0 bn JPY, and the year-end order backlog was 16.6 bn JPY. The company attributes this to Packaging Machines capturing packaging services demand while BEV-related investment in Industrial Machinery trended cautiously. For FY2027/3 it forecasts orders of 19.0 bn JPY (− 0.1), with Packaging Machines at 15.1 bn JPY and Industrial Machinery at 3.9 bn JPY.
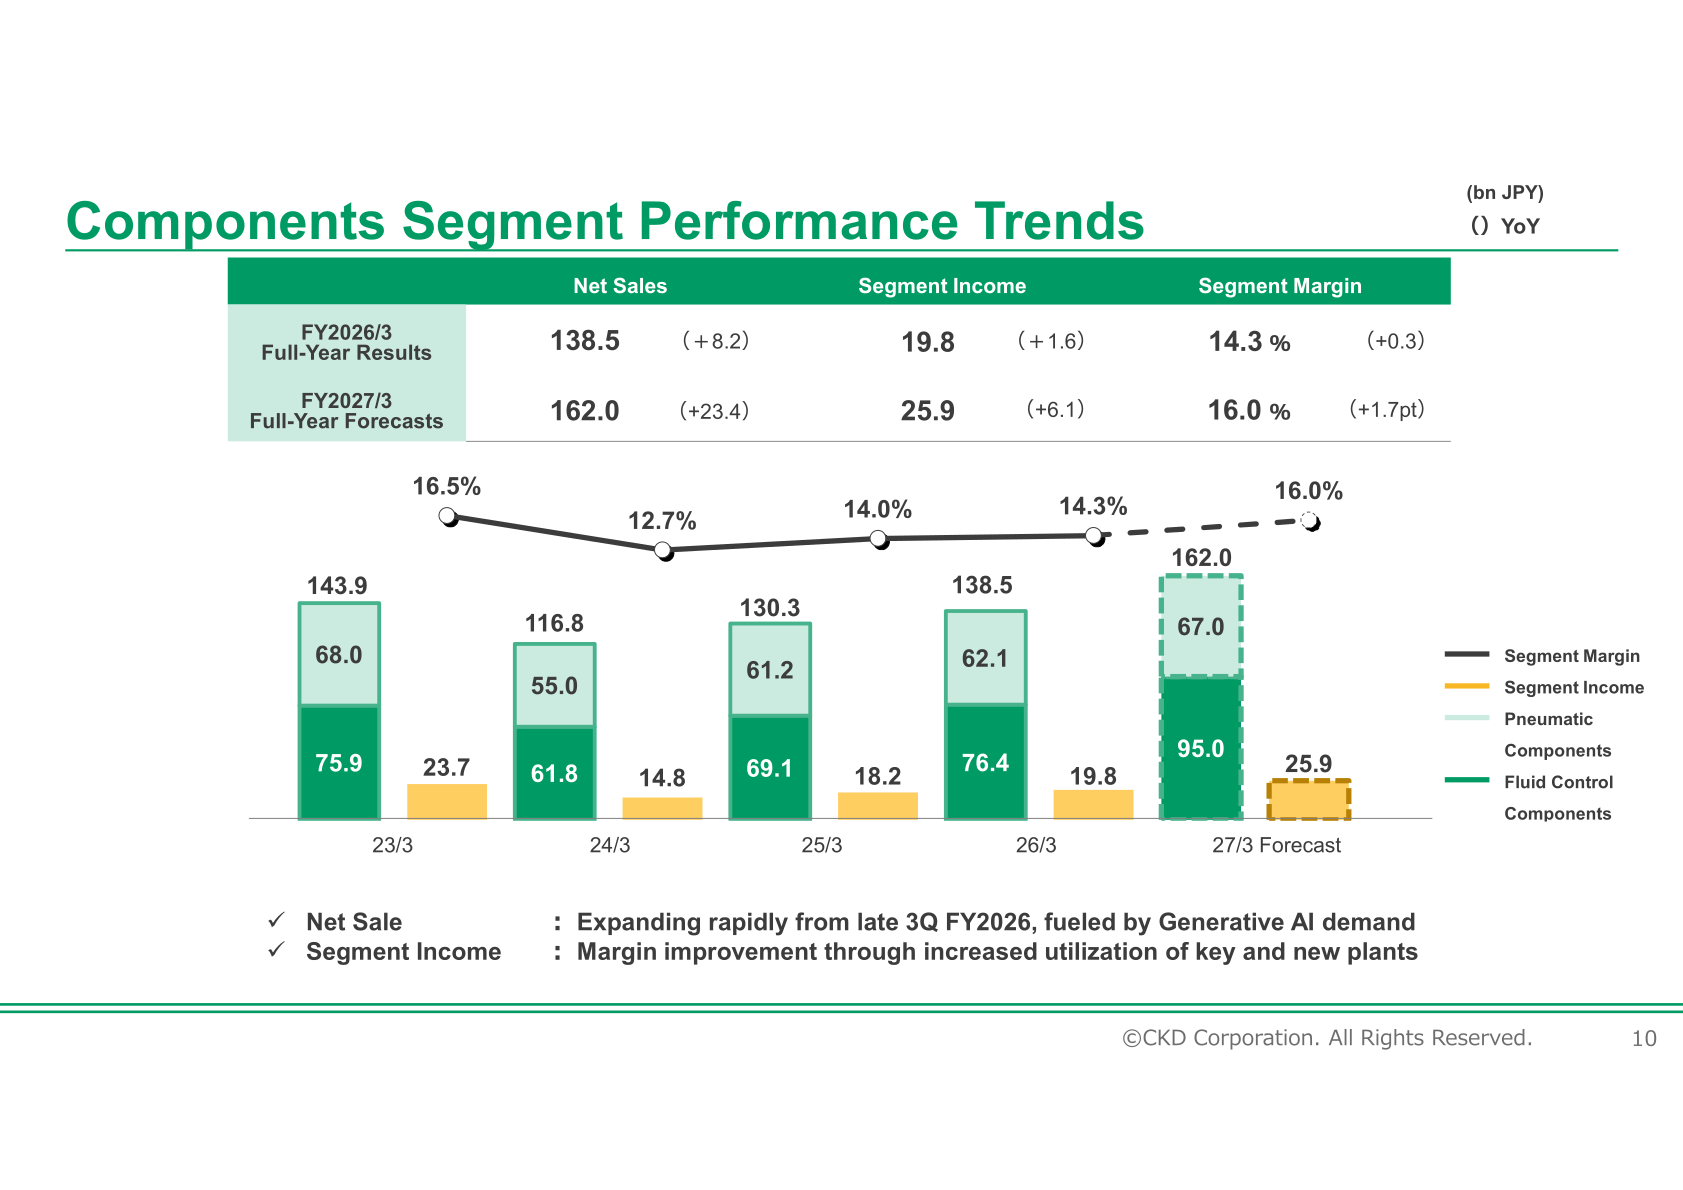
Components net sales were 138.5 bn JPY (+ 8.2 YoY) with segment income of 19.8 bn JPY (+ 1.6) and a segment margin of 14.3% (+0.3). Within the segment, Fluid Control Components net sales were 76.4 bn JPY and Pneumatic Components 62.1 bn JPY, against 69.1 bn JPY and 61.2 bn JPY respectively in 25/3. The materials attribute the expansion to rapid growth from late 3Q FY2026 fueled by Generative AI demand, and the margin improvement to increased utilization of key and new plants.
| Segment | Metric | FY2026/3 Results | FY2025/3 Results | YoY |
|---|---|---|---|---|
| Automatic Machinery | Net Sales | 19.4 | 25.3 | − 6.0 |
| Automatic Machinery | Segment Income | 4.9 | 5.5 | − 0.6 |
| Automatic Machinery | Segment Margin | 25.2 % | 21.7 % | +3.5pt |
| Components | Net Sales | 138.5 | 130.3 | + 8.2 |
| Components | Segment Income | 19.8 | 18.2 | + 1.6 |
| Components | Segment Margin | 14.3 % | 14.0 % | +0.3 |
Components Segment by Market
The company discloses Components segment results by industry and area on an index basis, with FY2025/3 results set at 100 for FY2026/3. Semiconductor demand in Japan showed a rapid recovery since late 3Q, while automotive CAPEX remained stagnant and BEV investment in rechargeable batteries stayed postponed. Overseas, the materials cite growth in the semiconductor and rechargeable battery sectors in China, growth in advanced semiconductors in Korea and Taiwan, growth in semiconductor-related demand in Singapore, and growth in semiconductor-related demand in the USA. FY2027/3 directions are shown as arrows rather than index figures in the materials.
| Area | Industry | FY26/3 1H | FY26/3 2H | FY26/3 Full-year |
|---|---|---|---|---|
| Japan | Semiconductor | 96 | 120 | 108 |
| Japan | Automotive | 84 | 87 | 86 |
| Japan | Machine Tool | 104 | 110 | 107 |
| Japan | Pharmaceutical | 106 | 98 | 102 |
| Japan | Rechargeable Battery | 65 | 88 | 76 |
| Japan | Others | 101 | 96 | 98 |
| Japan | Domestic Total | 97 | 110 | 103 |
| Overseas | East Asia | 98 | 115 | 106 |
| Overseas | Other Asia | 110 | 130 | 120 |
| Overseas | Europe, USA and Others | 104 | 133 | 119 |
| Overseas | Overseas Total | 101 | 120 | 110 |
Unit: %. FY2026/3 Index is calculated with FY2025/3 results as 100.
FY2027/3 Full-Year Forecasts
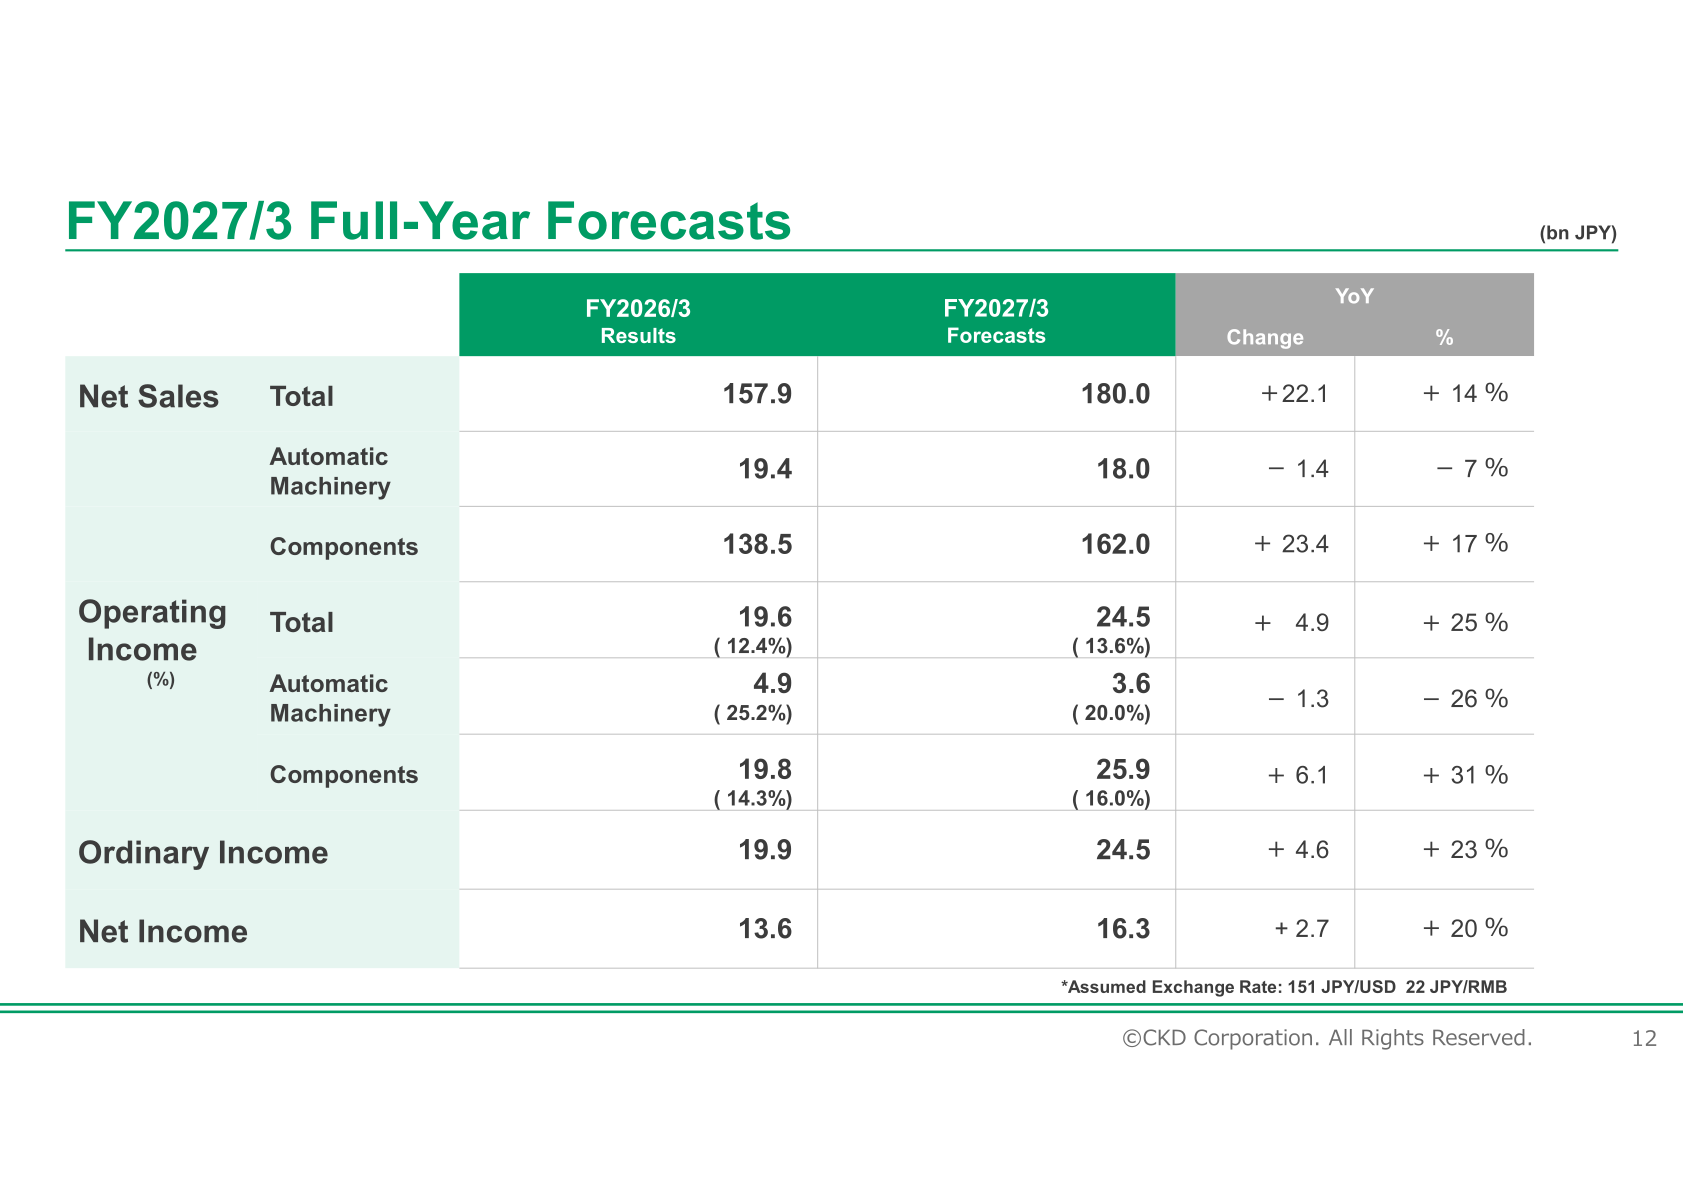
CKD expects revenue and profit to increase in FY2027/3, citing steady investment demand in pharmaceutical packaging machines with a focus on packaging services in Automatic Machinery, and ongoing expansion of global semiconductor-related demand in Components. The forecast assumes exchange rates of 151 JPY/USD and 22 JPY/RMB. Operating margin is forecast at 13.6%.
| Item | FY2026/3 Results | FY2027/3 Forecasts | YoY Change | YoY % |
|---|---|---|---|---|
| Net Sales — Total | 157.9 | 180.0 | +22.1 | + 14 % |
| Net Sales — Automatic Machinery | 19.4 | 18.0 | − 1.4 | − 7 % |
| Net Sales — Components | 138.5 | 162.0 | + 23.4 | + 17 % |
| Operating Income — Total (%) | 19.6 ( 12.4%) | 24.5 ( 13.6%) | + 4.9 | + 25 % |
| Operating Income — Automatic Machinery (%) | 4.9 ( 25.2%) | 3.6 ( 20.0%) | − 1.3 | − 26 % |
| Operating Income — Components (%) | 19.8 ( 14.3%) | 25.9 ( 16.0%) | + 6.1 | + 31 % |
| Ordinary Income | 19.9 | 24.5 | + 4.6 | + 23 % |
| Net Income | 13.6 | 16.3 | + 2.7 | + 20 % |
Shareholder Returns
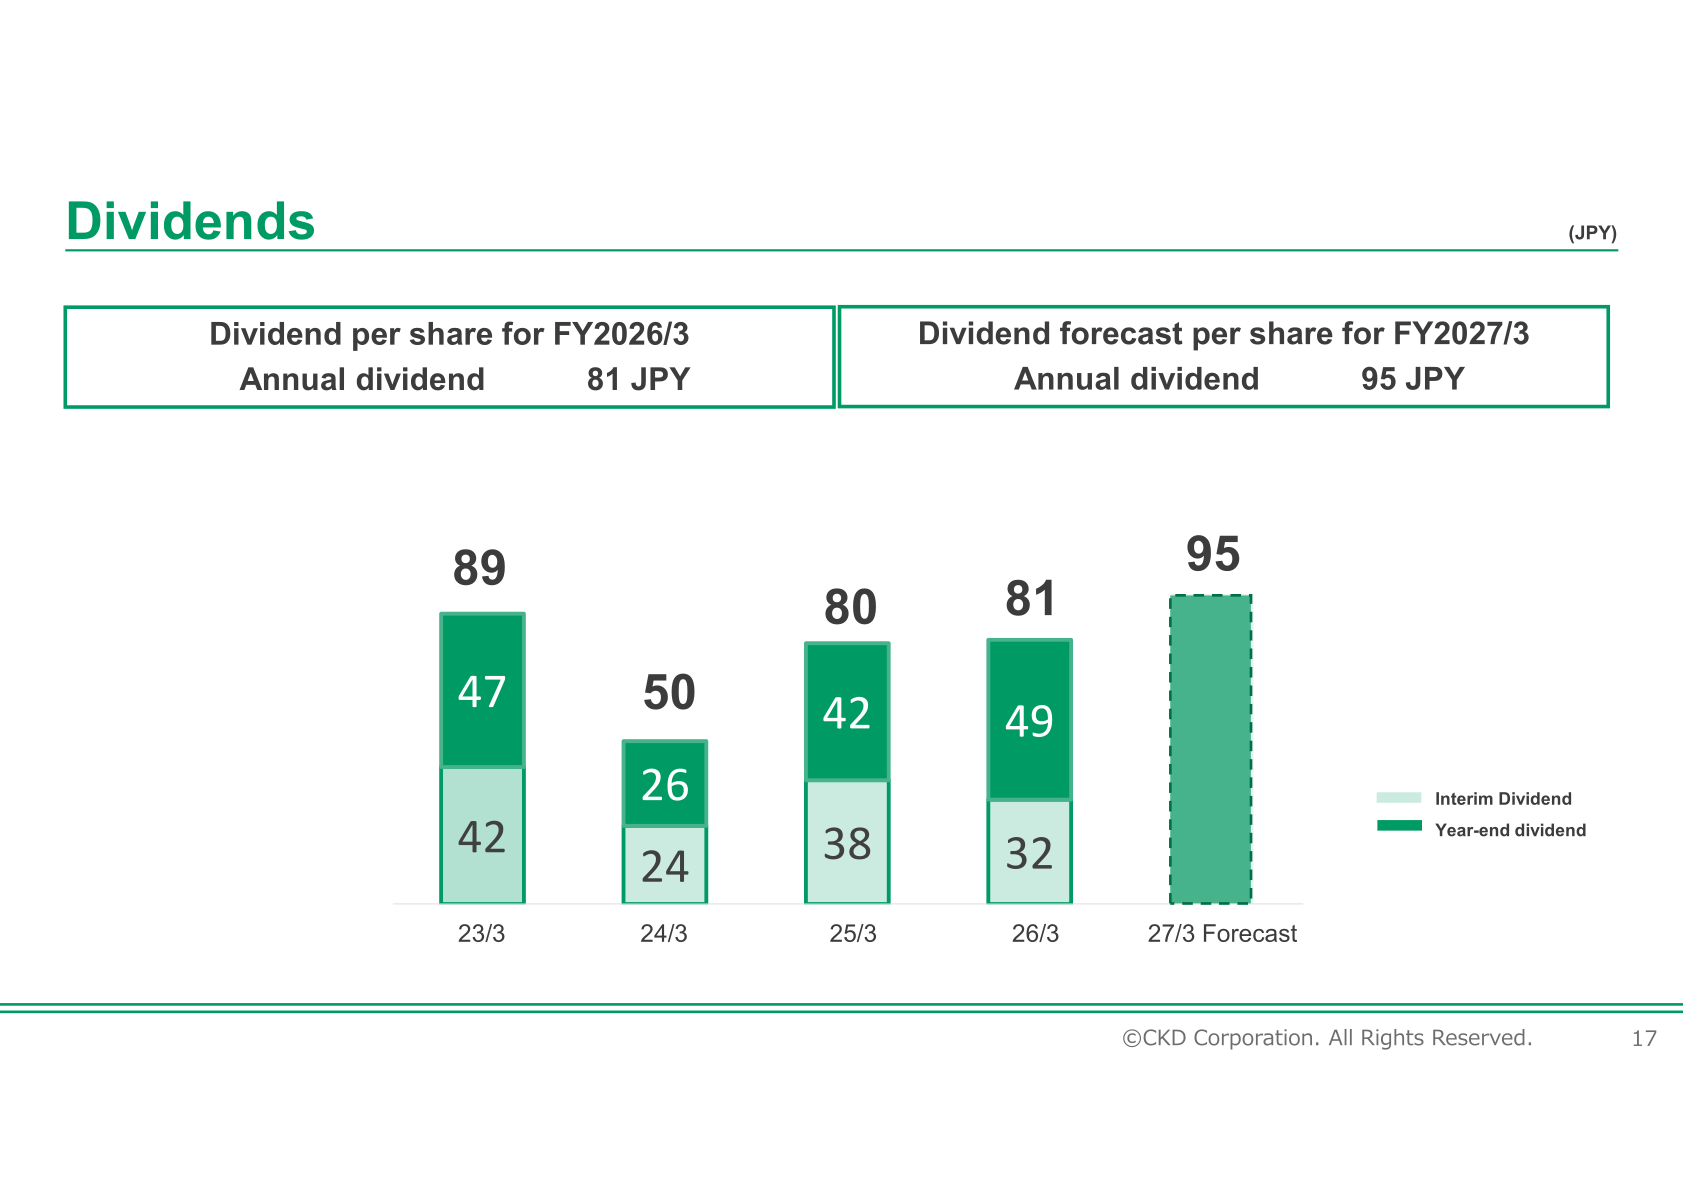
The dividend per share for FY2026/3 is an annual dividend of 81 JPY, comprising an interim dividend of 32 JPY and a year-end dividend of 49 JPY. The materials show the year-end dividend raised from 35 JPY to 49 JPY and the annual dividend raised from 67 JPY to 81 JPY. For FY2027/3 the company forecasts an annual dividend of 95 JPY per share. Annual dividends in prior years were 89 JPY (23/3), 50 JPY (24/3) and 80 JPY (25/3).
Investment Overview
Capital expenditures were 2.8 bn JPY in 26/3 against depreciation of 7.0 bn JPY, and the 27/3 forecast is CAPEX of 8.0 bn JPY with depreciation of 7.0 bn JPY. The company states that in FY2026/3 it selectively invested in productivity and equipment upgrades, and that in FY2027/3 it will accelerate growth investments aligned with demand expansion. R&D investment was 3.4 bn JPY in 26/3 with a 27/3 forecast of 4.0 bn JPY; the company focused on R&D for next-generation products in FY2026/3 and plans to expand investment to enhance R&D in FY2027/3.
This article is an analysis based on publicly available information and is not a recommendation to buy or sell any specific securities. Investment decisions are your own responsibility.
![[Obayashi] Investors’ Guide 2026 — The Complete 24-Article Breakdown](https://japan-equity.com/wp-content/uploads/2026/07/hub_cover-1024x1024.png)
![[Obayashi] IR & SR Policy — Feeding Dialogue Back into Management](https://japan-equity.com/wp-content/uploads/2026/07/p32_sq-1024x1024.jpg)
![[Obayashi] Real Estate Development — 18.7% Margin, ¥287.7bn Unrealized Gains](https://japan-equity.com/wp-content/uploads/2026/07/p20_sq-1024x1024.jpg)
![[Obayashi] Domestic Civil Engineering — Resilience Spending Supports 9.6% Margin](https://japan-equity.com/wp-content/uploads/2026/07/p11_sq-1024x1024.jpg)
![[Obayashi] Share Price & External Ratings — vs TOPIX, ESG Index Inclusion](https://japan-equity.com/wp-content/uploads/2026/07/p40_sq-1024x1024.jpg)
![[Construction] ¥75.5tn Investment, Shrinking Workforce — Big-5 Market Share](https://japan-equity.com/wp-content/uploads/2026/07/p12_sq-1024x1024.jpg)



![[Obayashi] Capital Policy & Shareholder Returns — ROE 10%+, DOE ~5%, ¥100bn Buyback](https://japan-equity.com/wp-content/uploads/2026/07/p27_sq-1024x1024.jpg)
![[Obayashi] Reducing Cross-Shareholdings — ¥285.2bn Sold in Five Years](https://japan-equity.com/wp-content/uploads/2026/07/p29_sq-1024x1024.jpg)
![[Obayashi] ¥750bn Investment Plan — ¥300bn to Development, ¥190bn to Tech/DX](https://japan-equity.com/wp-content/uploads/2026/07/p30_sq-1024x1024.jpg)
![[Obayashi] MTP2022 KPIs — Operating Profit ~2x Target, ROE 14.4%](https://japan-equity.com/wp-content/uploads/2026/07/p25_sq-1024x1024.jpg)
![[Obayashi] Cash Allocation — ¥420bn Investment CF Over Five Years](https://japan-equity.com/wp-content/uploads/2026/07/p26_sq-1024x1024.jpg)
![[Obayashi] Green Energy — 44 Plants, 344MW, and the Green Hydrogen Challenge](https://japan-equity.com/wp-content/uploads/2026/07/p21_sq-1024x1024.jpg)
![[Obayashi] Tackling the Labor Shortage — Robotics Construction®](https://japan-equity.com/wp-content/uploads/2026/07/p14_sq-1024x1024.jpg)
