
This article is based on publicly available IR materials and is not a recommendation to buy or sell any specific securities.
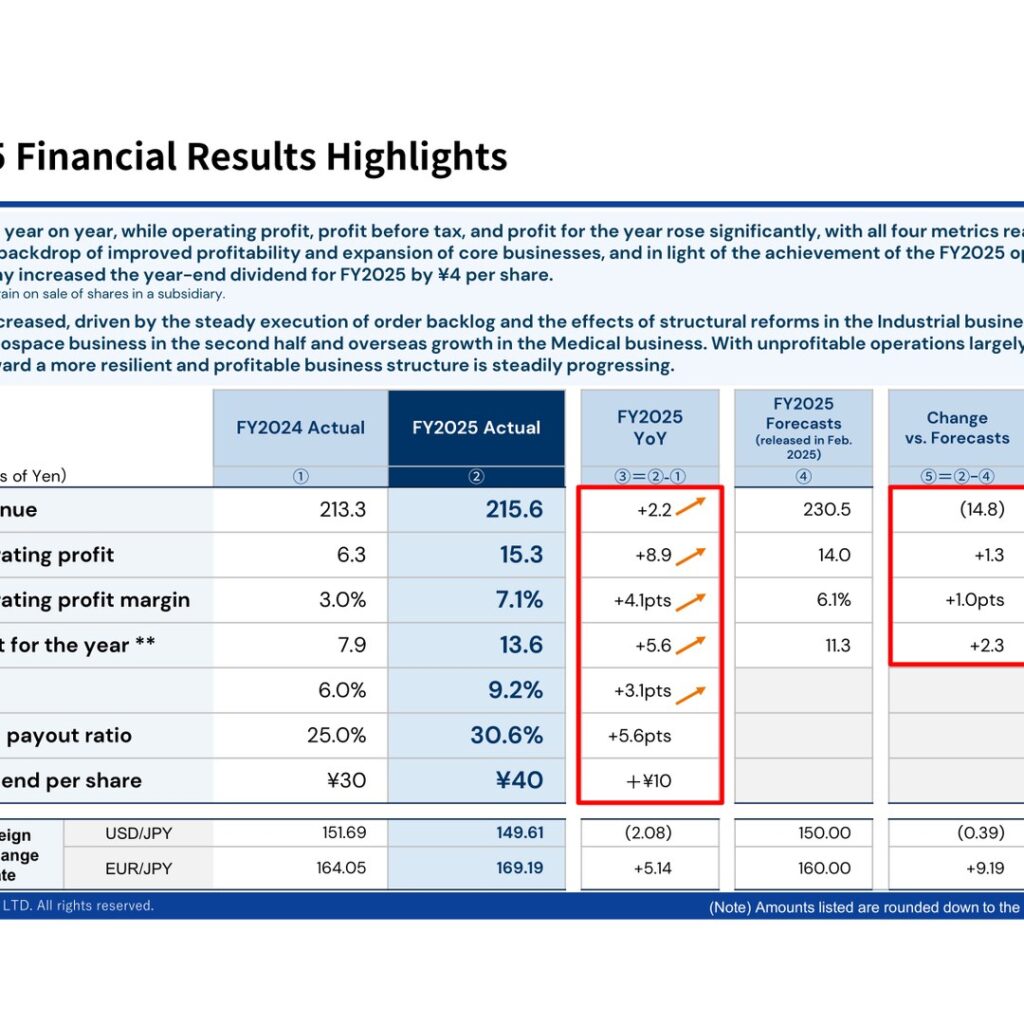
NIKKISO CO., LTD. (6376) closed FY2025 (January-December 2025) with revenue of ¥215.6 billion, up ¥2.2 billion or +1.1% year on year, and operating profit of ¥15.3 billion, up ¥8.9 billion or +139.6%. Profit before tax rose +72.4% to ¥17.2 billion and profit for the year attributable to owners of the company rose +71.6% to ¥13.6 billion. The materials state that revenue, operating profit, profit before tax and profit for the year all reached record-high levels, with a footnote reading “*Excluding FY2022, when gain on sale of shares in a subsidiary.” Operating profit growth was driven by steady execution of order backlog and structural reforms in the Industrial business, a second-half recovery in the Aerospace business and overseas growth in the Medical business.
Consolidated Results (Full-Year Actual)
Orders received grew +4.2% to ¥231.4 billion and the operating profit margin improved 4.1pts to 7.1%. ROE rose 3.1pts to 9.2%. Excluding one-time gains and losses and the results of the CRRT Business, whose transfer was completed in February 2025, operating profit was ¥16.1 billion in FY2025 against ¥10.0 billion in FY2024, a gain of ¥6.1 billion, with the corresponding margin rising from 4.9% to 7.5%. The average USD/JPY rate was 149.61 versus 151.69 a year earlier, while EUR/JPY was 169.19 versus 164.05.
| Item | FY2025 Annual Actual | FY2024 Annual Actual | Change | Change Rate |
|---|---|---|---|---|
| Orders Received (Billions of Yen) | 231.4 | 222.0 | +9.3 | +4.2% |
| Revenue (Billions of Yen) | 215.6 | 213.3 | +2.2 | +1.1% |
| Operating Profit (Billions of Yen) | 15.3 | 6.3 | +8.9 | +139.6% |
| Operating profit margin | 7.1% | 3.0% | +4.1pts | – |
| Profit before tax (Billions of Yen) | 17.2 | 10.0 | +7.2 | +72.4% |
| Profit for the year attributable to owners of the company (Billions of Yen) | 13.6 | 7.9 | +5.6 | +71.6% |
| ROE | 9.2% | 6.0% | +3.1pts | – |
| Average exchange rate USD/JPY | 149.61 | 151.69 | (2.08) | – |
| Average exchange rate EUR/JPY | 169.19 | 164.05 | +5.14 | – |
Against the FY2025 forecasts released in February 2025, revenue of ¥230.5 billion came in ¥14.8 billion light at ¥215.6 billion, but operating profit exceeded the ¥14.0 billion plan by ¥1.3 billion and profit for the year exceeded the ¥11.3 billion plan by ¥2.3 billion. The operating profit margin was 1.0pts above the 6.1% planned.
Total assets stood at ¥358.1 billion at the end of December 2025, an increase of ¥32.5 billion from a year earlier. Liabilities increased by ¥14.3 billion to ¥197.9 billion, mainly due to an increase in deferred tax liabilities, while equity increased by ¥18.2 billion to ¥160.2 billion, primarily reflecting an increase in retained earnings. The ratio of equity attributable to owners of the parent company rose 1.2pts to 44.2% and the D/E ratio was 0.7 against 0.77. Cash and cash equivalents increased from ¥34.6 billion to ¥44.5 billion, with free cash flow of ¥17.7 billion and financing cash flow of -¥9.7 billion.
Segment Results
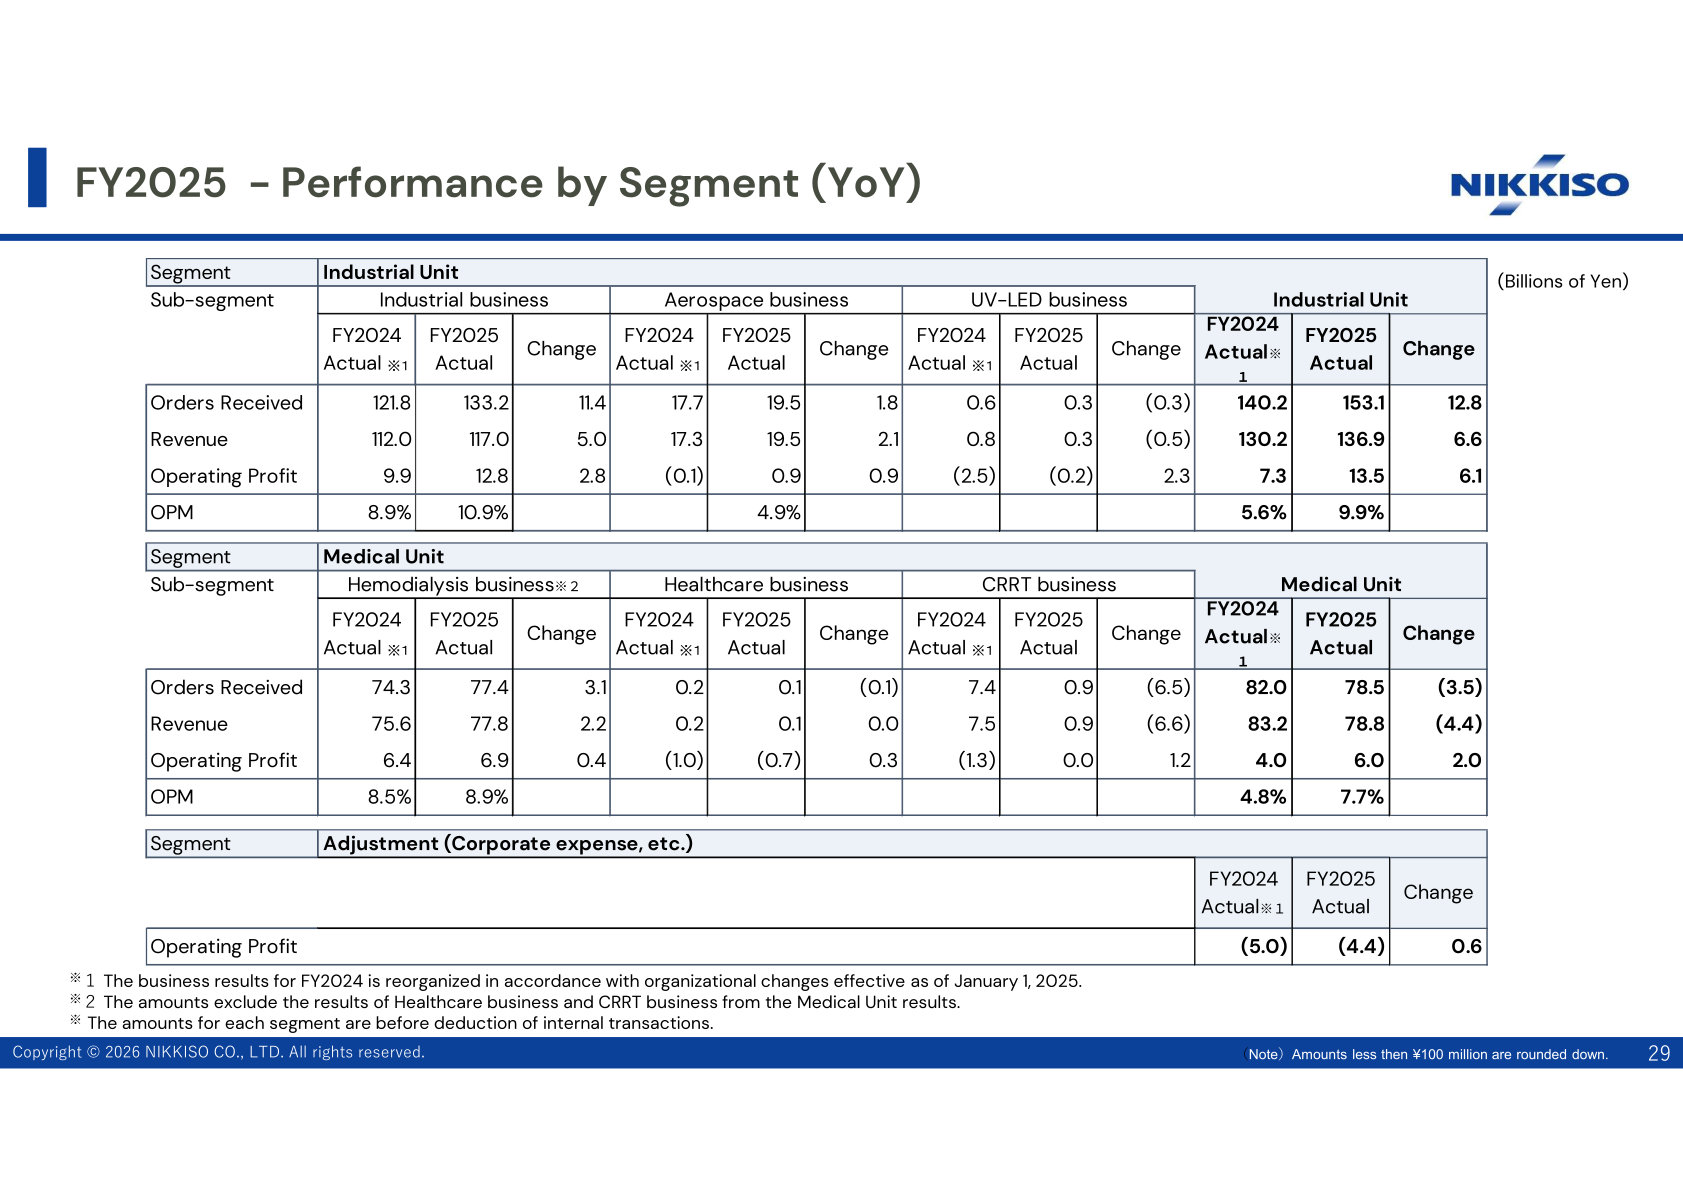
In the Industrial Unit, the Industrial business lifted revenue to ¥117.0 billion and operating profit to ¥12.8 billion on steady execution of booked orders at the Clean Energy & Industrial Gases group and on restructuring of the industrial pumps business. The Aerospace business returned to a ¥0.9 billion operating profit on higher shipments of core products including Cascade. The UV-LED business narrowed its operating loss to ¥0.2 billion from ¥2.5 billion. In the Medical Unit, the Hemodialysis business grew revenue to ¥77.8 billion and operating profit to ¥6.9 billion as overseas sales rose on demand recovery in China and expanded sales in Europe, offsetting weaker domestic dialysis machine sales; Medical Unit revenue nevertheless declined to ¥78.8 billion because the CRRT business contributed only ¥0.9 billion after its transfer. Note that FY2024 segment results are restated for the organizational change effective January 1, 2025, under which the Biotechnology business was reclassified from the Industrial business to the Medical business.
| Sub-segment | Metric | FY2025 Actual | FY2024 Actual | Change |
|---|---|---|---|---|
| Industrial business | Revenue | 117.0 | 112.0 | 5.0 |
| Industrial business | Operating Profit | 12.8 | 9.9 | 2.8 |
| Aerospace business | Revenue | 19.5 | 17.3 | 2.1 |
| Aerospace business | Operating Profit | 0.9 | (0.1) | 0.9 |
| UV-LED business | Revenue | 0.3 | 0.8 | (0.5) |
| UV-LED business | Operating Profit | (0.2) | (2.5) | 2.3 |
| Industrial Unit | Revenue | 136.9 | 130.2 | 6.6 |
| Industrial Unit | Operating Profit | 13.5 | 7.3 | 6.1 |
| Hemodialysis business | Revenue | 77.8 | 75.6 | 2.2 |
| Hemodialysis business | Operating Profit | 6.9 | 6.4 | 0.4 |
| Healthcare business | Revenue | 0.1 | 0.2 | 0.0 |
| Healthcare business | Operating Profit | (0.7) | (1.0) | 0.3 |
| CRRT business | Revenue | 0.9 | 7.5 | (6.6) |
| CRRT business | Operating Profit | 0.0 | (1.3) | 1.2 |
| Medical Unit | Revenue | 78.8 | 83.2 | (4.4) |
| Medical Unit | Operating Profit | 6.0 | 4.0 | 2.0 |
| Adjustment (Corporate expense, etc.) | Operating Profit | (4.4) | (5.0) | 0.6 |
Revenue Composition by Region
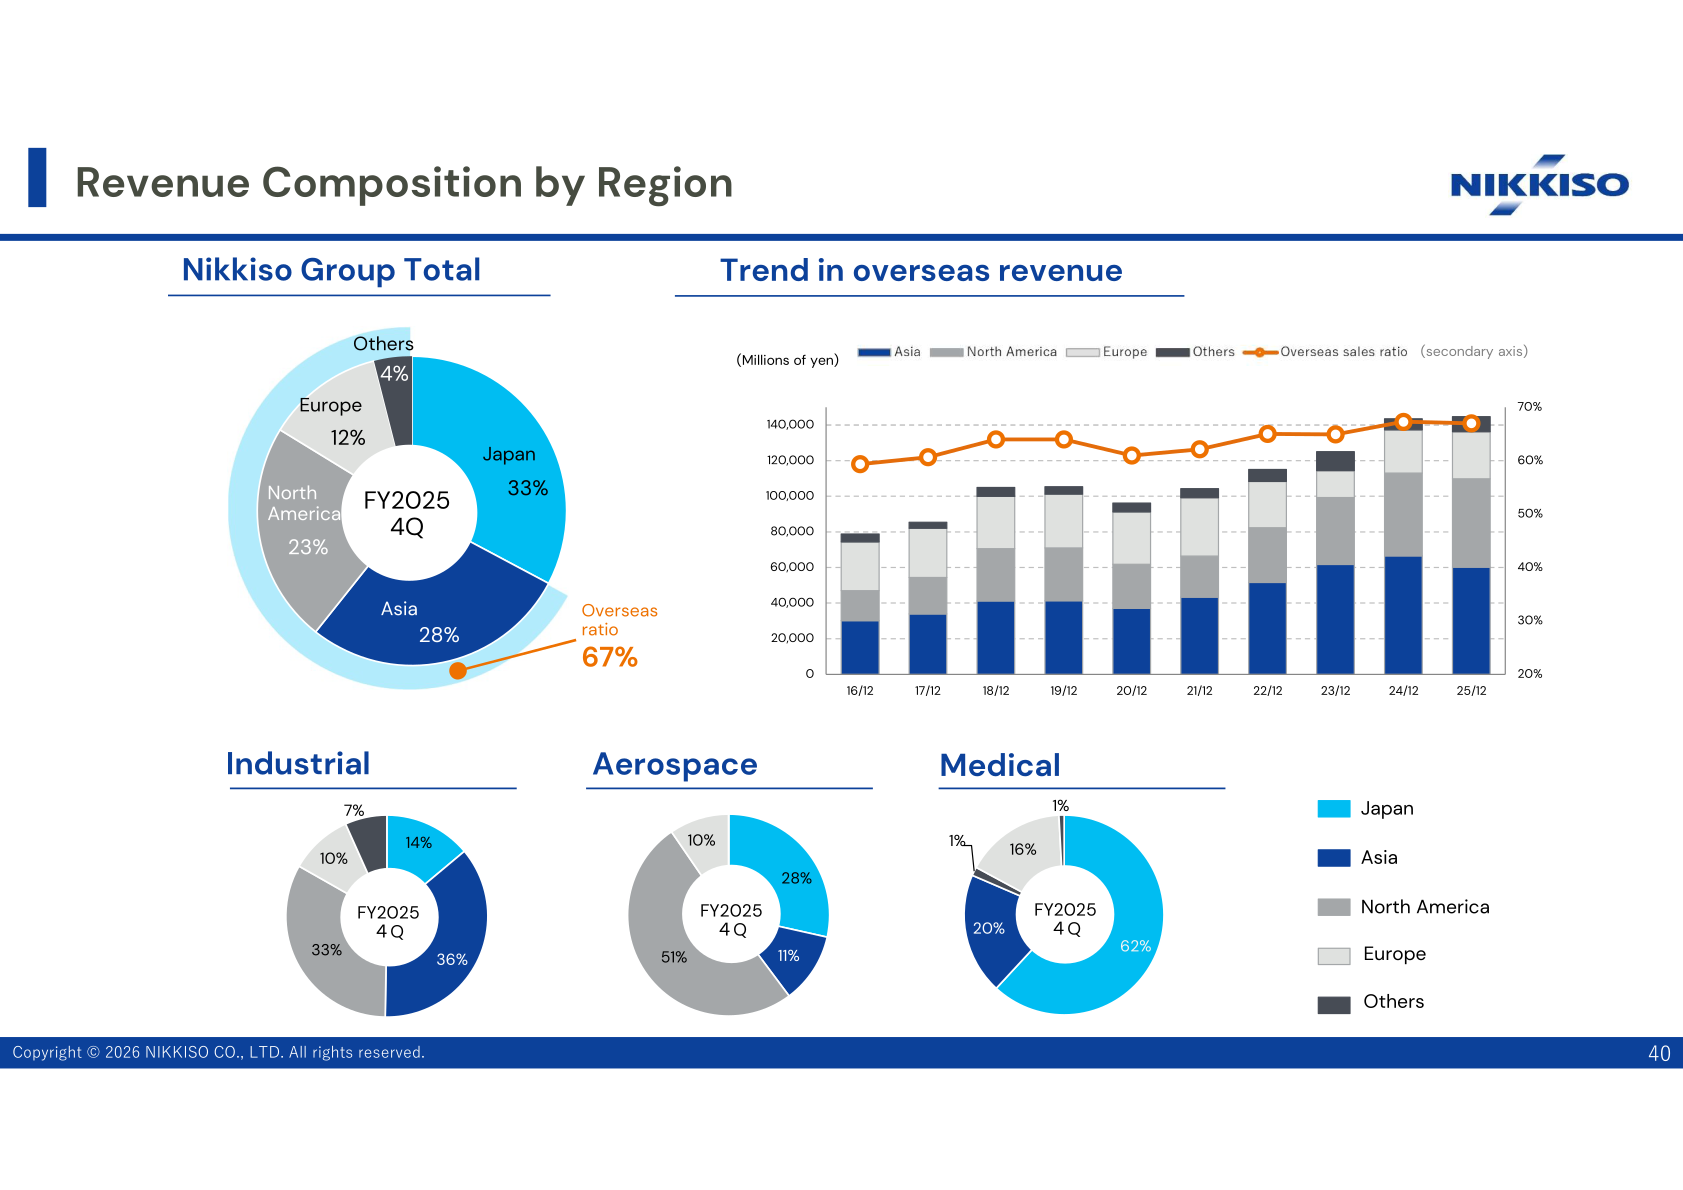
For FY2025 4Q, the Nikkiso Group’s overseas sales ratio was 67%, with Japan at 33%, Asia 28%, North America 23%, Europe 12% and Others 4%. The regional mix differs sharply by business: the Industrial business is weighted to Asia and North America, the Aerospace business to North America, and the Medical business to Japan.
| Region | Nikkiso Group Total | Industrial | Aerospace | Medical |
|---|---|---|---|---|
| Japan | 33% | 14% | 28% | 62% |
| Asia | 28% | 36% | 11% | 20% |
| North America | 23% | 33% | 51% | 1% |
| Europe | 12% | 10% | 10% | 16% |
| Others | 4% | 7% | 0% | 1% |
FY2026 Forecast
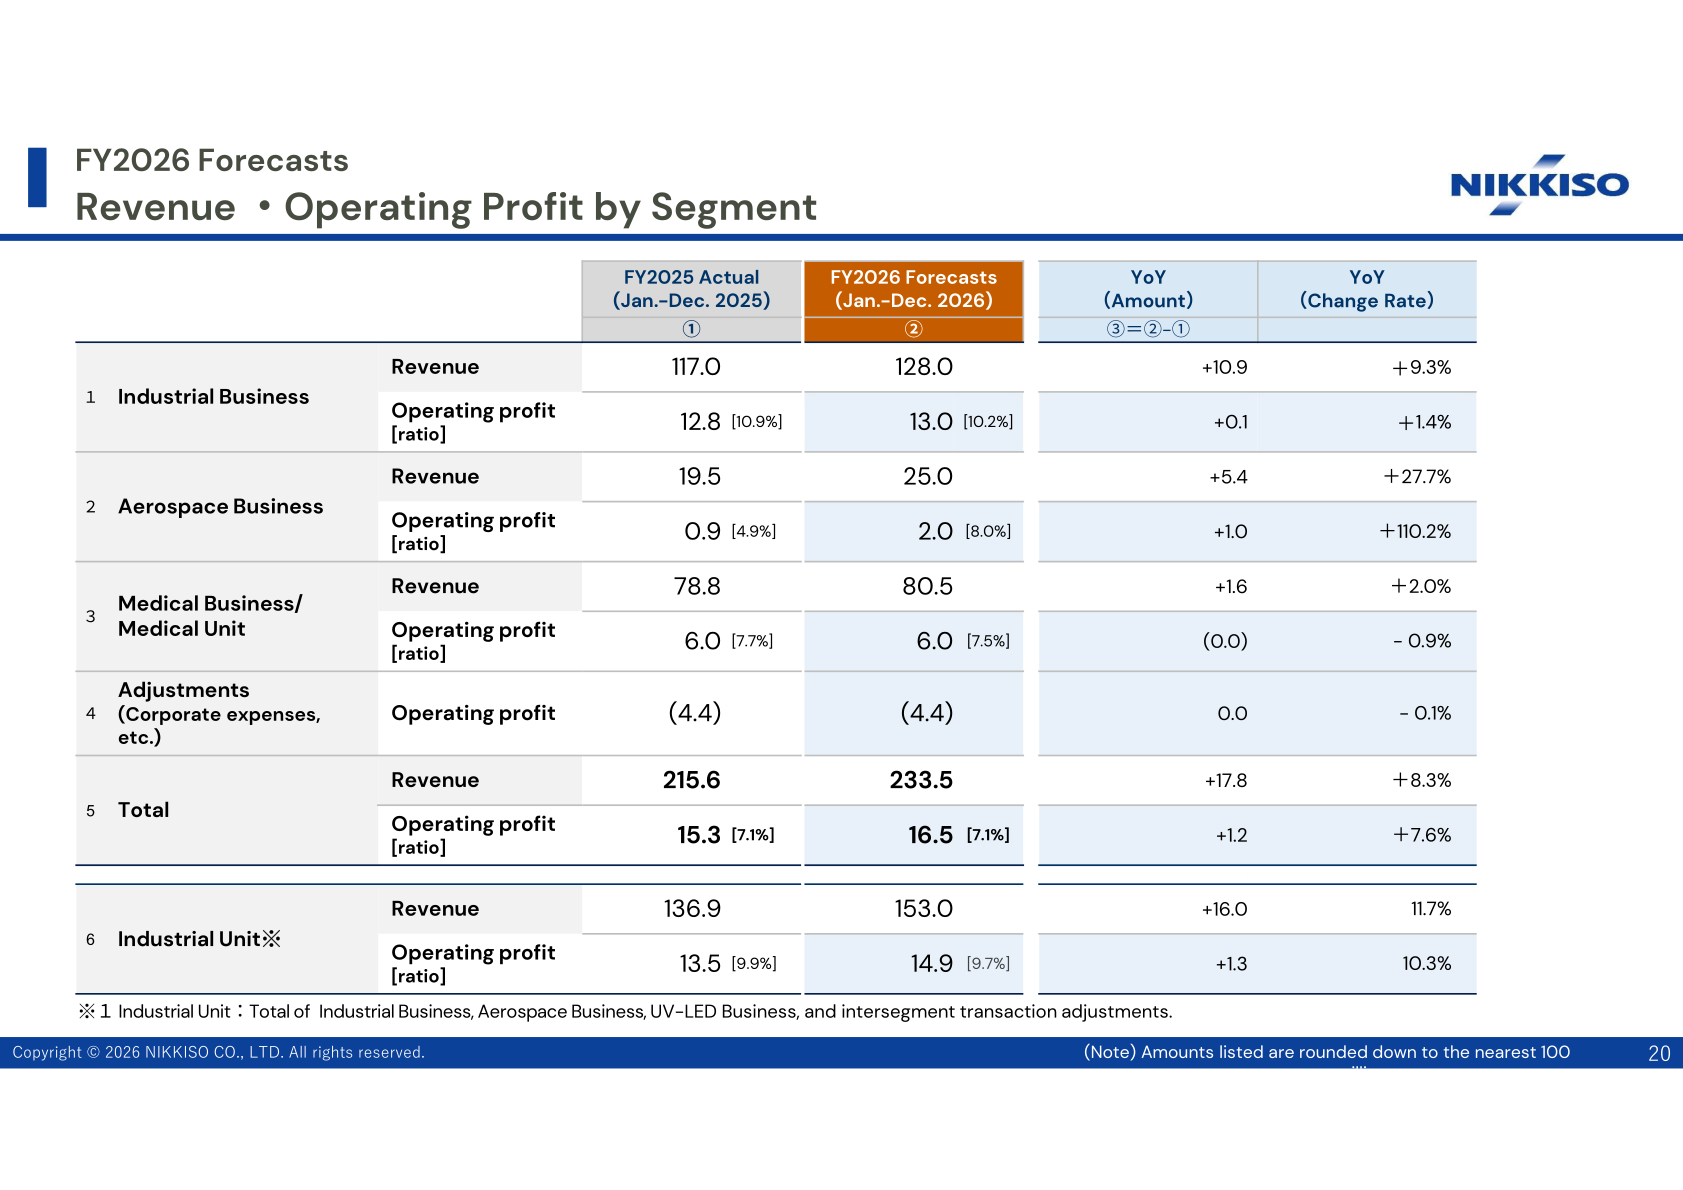
For FY2026, the first fiscal year of the new medium-term business plan “NIKKISO 2028”, the Company forecasts orders received of ¥245.5 billion (+6.1%), revenue of ¥233.5 billion (+8.3%) and operating profit of ¥16.5 billion (+7.6%), with profit for the year of ¥13.0 billion. The materials note that the Industrial and Aerospace businesses are expected to achieve revenue and profit growth driven by market expansion, while the Medical business is in an investment phase for future growth, so that operating profit for FY2026 is projected to remain at the FY2025 level. Assumed average rates are USD/JPY 145.00 and EUR/JPY 170.00, and exchange rate gains and losses are not factored into the projections.
| Item | FY2026 Forecast (Full Year) | FY2025 Actual (Full Year) | YoY (Amount) | YoY (Change Rate) |
|---|---|---|---|---|
| Orders received (Billions of Yen) | 245.5 | 231.4 | +14.0 | +6.1% |
| Revenue (Billions of Yen) | 233.5 | 215.6 | +17.8 | +8.3% |
| Operating Profit (Billions of Yen) | 16.5 | 15.3 | +1.1 | +7.6% |
| Operating profit margin | 7.1% | 7.1% | – | – |
| Profit for the year (Billions of Yen) | 13.0 | 13.6 | (0.6) | – |
| Industrial Business – Revenue | 128.0 | 117.0 | +10.9 | +9.3% |
| Industrial Business – Operating profit [ratio] | 13.0 [10.2%] | 12.8 [10.9%] | +0.1 | +1.4% |
| Aerospace Business – Revenue | 25.0 | 19.5 | +5.4 | +27.7% |
| Aerospace Business – Operating profit [ratio] | 2.0 [8.0%] | 0.9 [4.9%] | +1.0 | +110.2% |
| Medical Business/Medical Unit – Revenue | 80.5 | 78.8 | +1.6 | +2.0% |
| Medical Business/Medical Unit – Operating profit [ratio] | 6.0 [7.5%] | 6.0 [7.7%] | (0.0) | -0.9% |
| Adjustments (Corporate expenses, etc.) – Operating profit | (4.4) | (4.4) | 0.0 | -0.1% |
| Industrial Unit – Revenue | 153.0 | 136.9 | +16.0 | 11.7% |
| Industrial Unit – Operating profit [ratio] | 14.9 [9.7%] | 13.5 [9.9%] | +1.3 | 10.3% |
Shareholder Returns
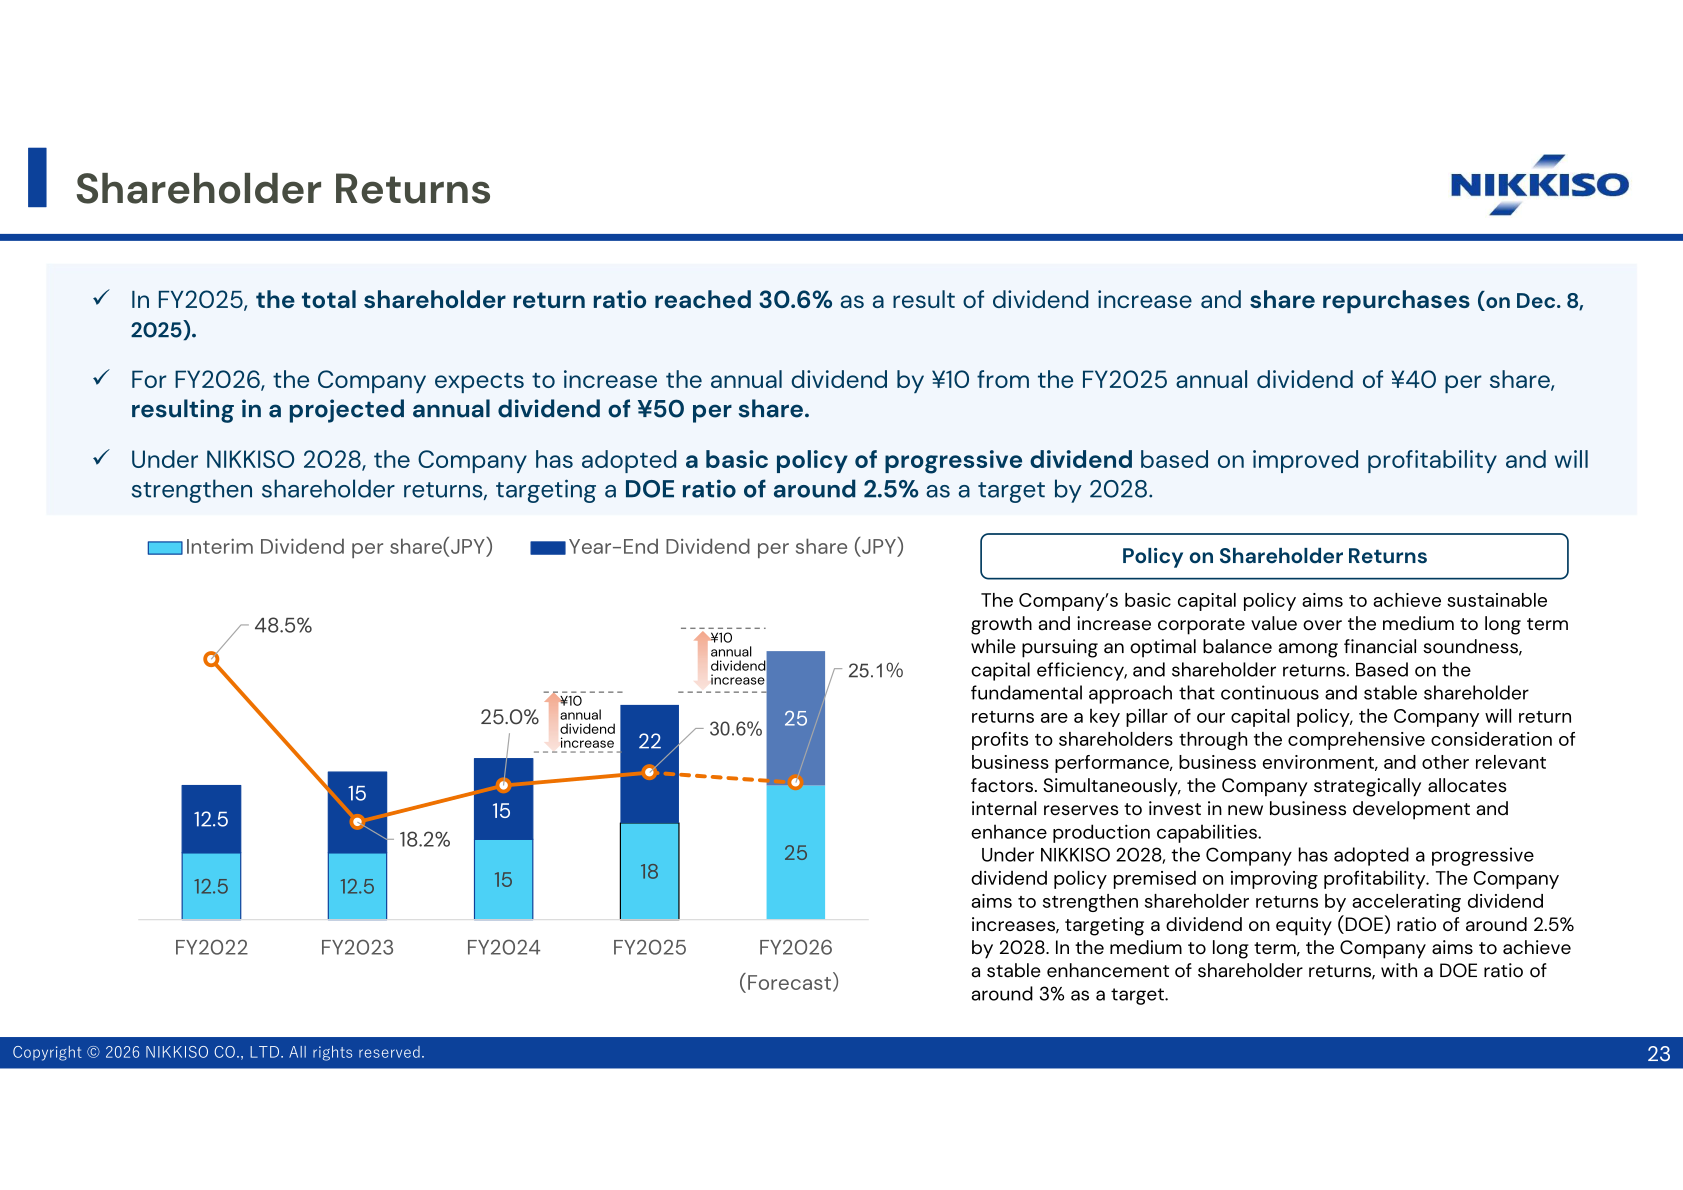
The FY2025 annual dividend was ¥40 per share, ¥10 higher than the ¥30 paid in FY2024, after the Company raised the year-end dividend by ¥4 per share in light of the achievement of the FY2025 operating profit target. Together with share repurchases carried out on December 8, 2025, the total shareholder return ratio reached 30.6%. For FY2026 the Company expects to increase the annual dividend by a further ¥10, to ¥50 per share.
| Item | FY2024 | FY2025 | FY2026 (Forecast) |
|---|---|---|---|
| Interim Dividend per share (JPY) | 15 | 18 | 25 |
| Year-End Dividend per share (JPY) | 15 | 22 | 25 |
| Annual dividend per share (JPY) | 30 | 40 | 50 |
| Total payout ratio | 25.0% | 30.6% | 25.1% |
Medium-Term Plan / Topics
Under NIKKISO 2028, the Company has adopted a basic policy of progressive dividend premised on improved profitability and intends to strengthen shareholder returns by accelerating dividend increases, targeting a dividend on equity (DOE) ratio of around 2.5% by 2028 and, over the medium to long term, around 3%. On the business side, the Company reports that sales approval for hemodialysis machines in the U.S. market was obtained in May 2025, that initial orders have been secured and promotional activities are underway ahead of the sales launch in January 2026, and that it is preparing to apply for regulatory approval of a higher-end, multifunctional hemodialysis machine as the next step.
This article is an analysis based on publicly available information and is not a recommendation to buy or sell any specific securities. Investment decisions are your own responsibility.
![[Obayashi] Investors’ Guide 2026 — The Complete 24-Article Breakdown](https://japan-equity.com/wp-content/uploads/2026/07/hub_cover-1024x1024.png)
![[Obayashi] IR & SR Policy — Feeding Dialogue Back into Management](https://japan-equity.com/wp-content/uploads/2026/07/p32_sq-1024x1024.jpg)
![[Obayashi] Real Estate Development — 18.7% Margin, ¥287.7bn Unrealized Gains](https://japan-equity.com/wp-content/uploads/2026/07/p20_sq-1024x1024.jpg)
![[Obayashi] Domestic Civil Engineering — Resilience Spending Supports 9.6% Margin](https://japan-equity.com/wp-content/uploads/2026/07/p11_sq-1024x1024.jpg)
![[Obayashi] Share Price & External Ratings — vs TOPIX, ESG Index Inclusion](https://japan-equity.com/wp-content/uploads/2026/07/p40_sq-1024x1024.jpg)
![[Construction] ¥75.5tn Investment, Shrinking Workforce — Big-5 Market Share](https://japan-equity.com/wp-content/uploads/2026/07/p12_sq-1024x1024.jpg)



![[Obayashi] Capital Policy & Shareholder Returns — ROE 10%+, DOE ~5%, ¥100bn Buyback](https://japan-equity.com/wp-content/uploads/2026/07/p27_sq-1024x1024.jpg)
![[Obayashi] Reducing Cross-Shareholdings — ¥285.2bn Sold in Five Years](https://japan-equity.com/wp-content/uploads/2026/07/p29_sq-1024x1024.jpg)
![[Obayashi] ¥750bn Investment Plan — ¥300bn to Development, ¥190bn to Tech/DX](https://japan-equity.com/wp-content/uploads/2026/07/p30_sq-1024x1024.jpg)
![[Obayashi] MTP2022 KPIs — Operating Profit ~2x Target, ROE 14.4%](https://japan-equity.com/wp-content/uploads/2026/07/p25_sq-1024x1024.jpg)
![[Obayashi] Cash Allocation — ¥420bn Investment CF Over Five Years](https://japan-equity.com/wp-content/uploads/2026/07/p26_sq-1024x1024.jpg)
![[Obayashi] Green Energy — 44 Plants, 344MW, and the Green Hydrogen Challenge](https://japan-equity.com/wp-content/uploads/2026/07/p21_sq-1024x1024.jpg)
![[Obayashi] Tackling the Labor Shortage — Robotics Construction®](https://japan-equity.com/wp-content/uploads/2026/07/p14_sq-1024x1024.jpg)
