
This article is based on publicly available IR materials and is not a recommendation to buy or sell any specific securities.
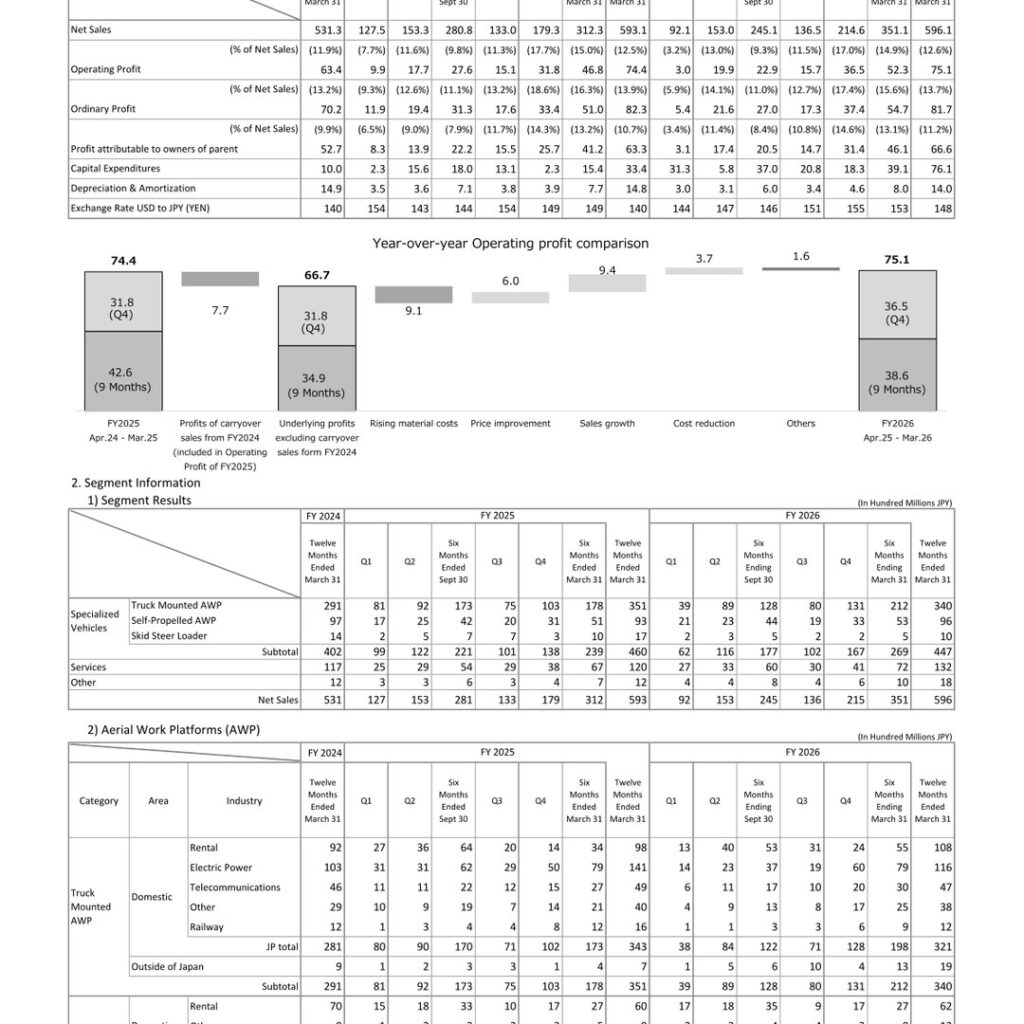
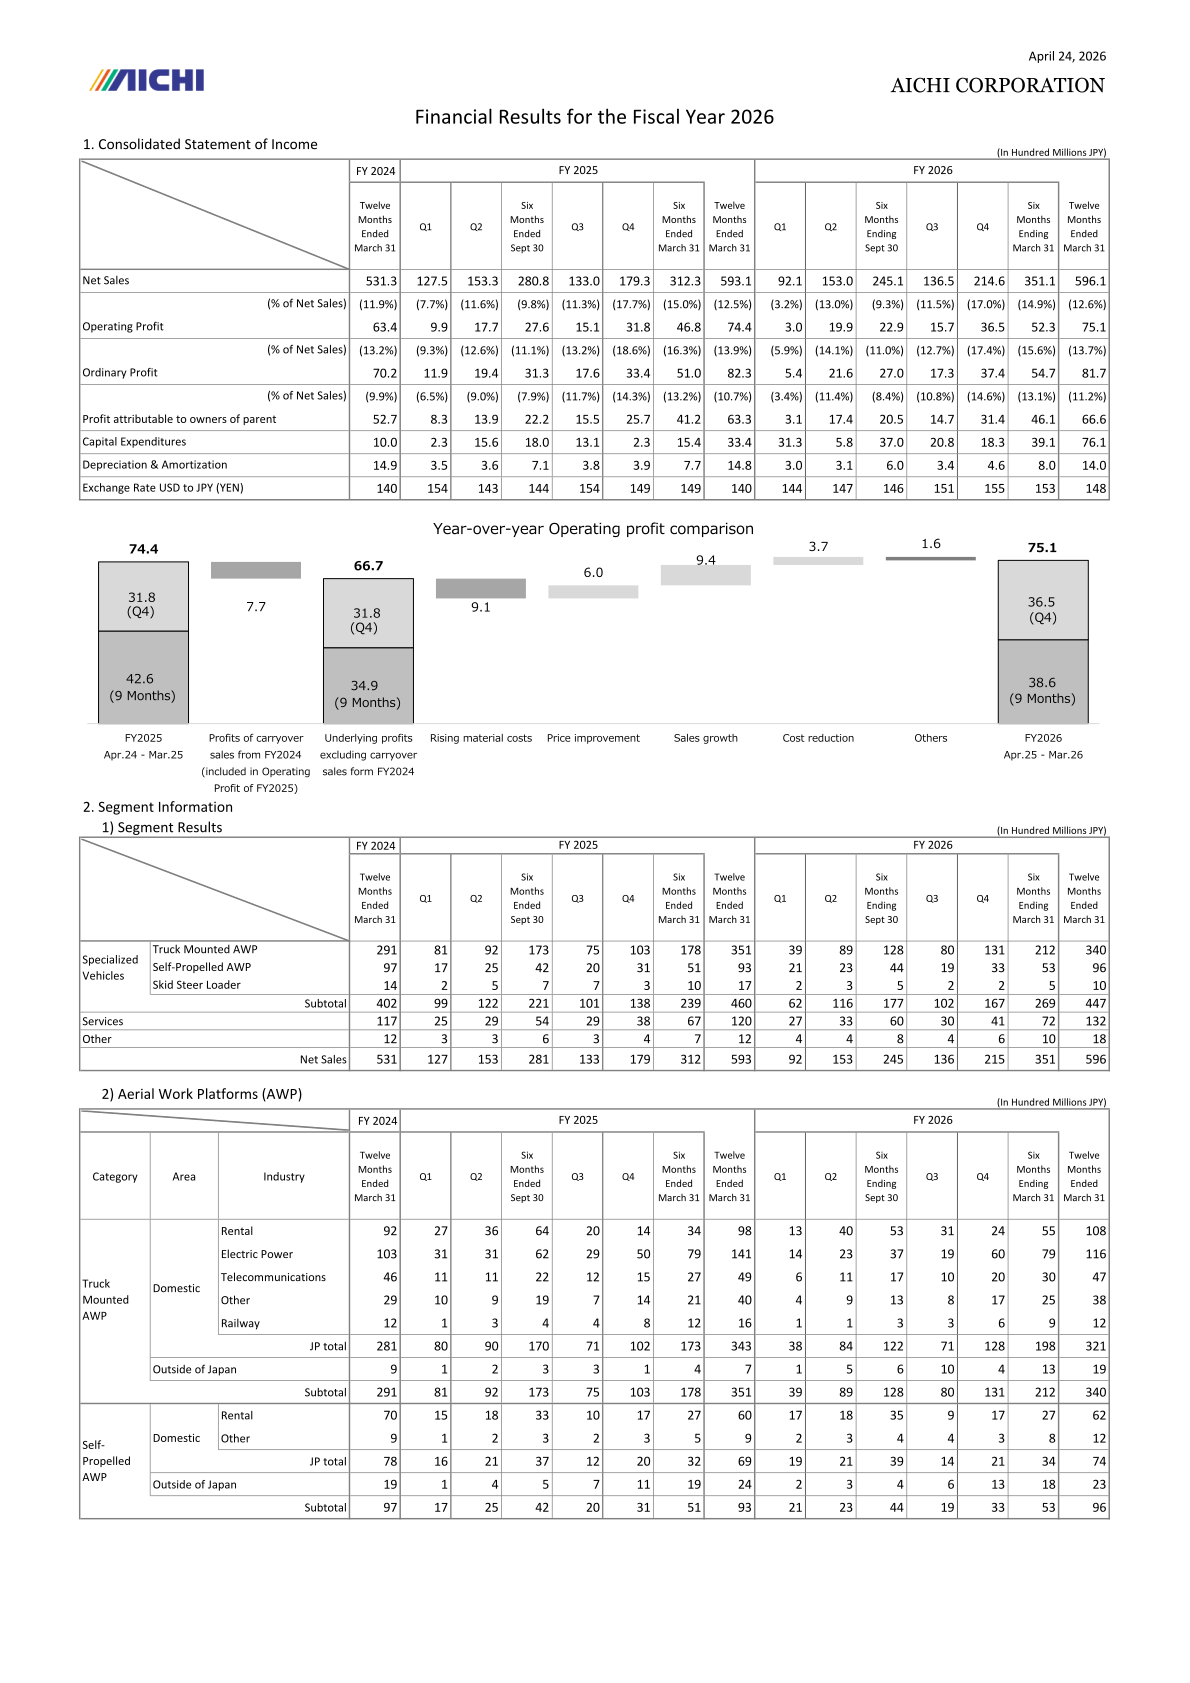
Note on year labels: Aichi Corporation labels the fiscal year ended March 31, 2026 as “FY 2026” in its materials, whereas this site classifies the most recently completed fiscal year as FY2025; the labels used in the text and tables below follow the company’s materials. For the fiscal year ended March 31, 2026, net sales were 59,613 million yen, up 0.5% year on year, and operating profit was 7,511 million yen, up 1.0%. Ordinary profit was 8,172 million yen, down 0.6%, while profit attributable to owners of parent rose 5.1% to 6,658 million yen. In the company’s year-over-year operating profit comparison, price improvement, sales growth and cost reduction more than offset rising material costs.
Consolidated Results (Full-Year Actual)
The consolidated results summary below is stated in millions of yen as reported in the company’s Consolidated Financial Results for the Fiscal Year Ended March 31, 2026 (Under Japanese GAAP). Percentages in the change column indicate year-on-year changes as disclosed, with figures in parentheses indicating a decrease. The operating profit to net sales ratio was 12.6%, against 12.5% a year earlier, and the rate of return on equity was 8.4%, against 7.6%.
| Item (Millions of yen) | FY ended March 31, 2026 | FY ended March 31, 2025 | Change (%) |
|---|---|---|---|
| Net sales | 59,613 | 59,306 | 0.5 |
| Operating profit | 7,511 | 7,440 | 1.0 |
| Ordinary profit | 8,172 | 8,225 | (0.6) |
| Profit attributable to owners of parent | 6,658 | 6,334 | 5.1 |
| Comprehensive income | 8,752 | 5,291 | 65.4 |
| Basic earnings per share (Yen) | 100.73 | 84.96 | – |
| Rate of return on equity (%) | 8.4 | 7.6 | – |
| Operating profit to net sales ratio (%) | 12.6 | 12.5 | – |
Year-over-Year Operating Profit Comparison
The company presents a year-over-year operating profit comparison that starts from FY2025 operating profit of 74.4 and removes 7.7 of profits of carryover sales from FY2024 that were included in FY2025 operating profit, giving underlying profits excluding carryover sales from FY2024 of 66.7. From there the chart shows rising material costs, price improvement, sales growth, cost reduction and others, arriving at FY2026 operating profit of 75.1. Amounts are in hundred millions of yen as labelled in the materials. The chart also splits each of the two year-end columns into a nine-month portion and a fourth-quarter portion: 42.6 (9 Months) and 31.8 (Q4) for FY2025, 34.9 (9 Months) and 31.8 (Q4) for underlying profits, and 38.6 (9 Months) and 36.5 (Q4) for FY2026.
| Step (In Hundred Millions JPY) | Amount | Effect |
|---|---|---|
| FY2025 (Apr.24 – Mar.25) operating profit | 74.4 | Starting point |
| Profits of carryover sales from FY2024 (included in operating profit of FY2025) | 7.7 | Deducted |
| Underlying profits excluding carryover sales from FY2024 | 66.7 | Subtotal |
| Rising material costs | 9.1 | Decrease |
| Price improvement | 6.0 | Increase |
| Sales growth | 9.4 | Increase |
| Cost reduction | 3.7 | Increase |
| Others | 1.6 | Decrease |
| FY2026 (Apr.25 – Mar.26) operating profit | 75.1 | Result |
Segment Results
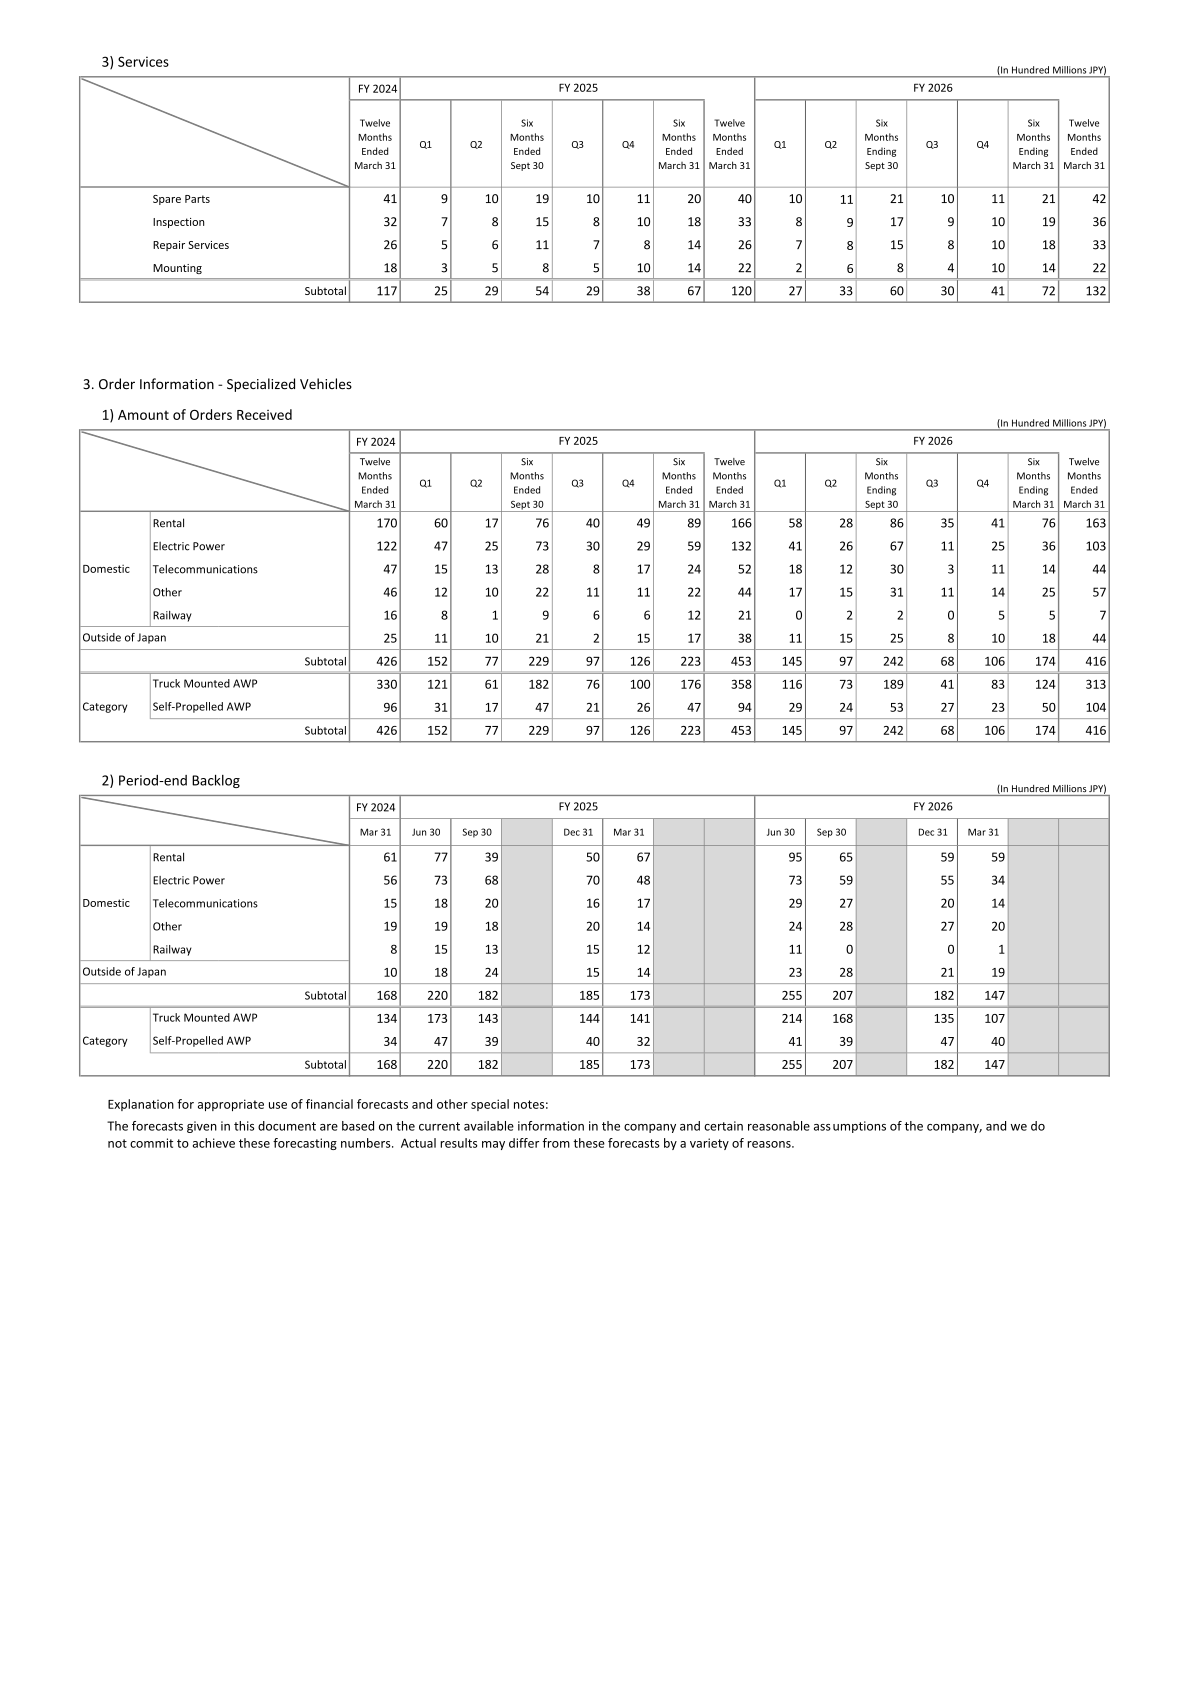
Segment sales are disclosed in hundred millions of yen. Within Specialized Vehicles, Truck Mounted AWP declined to 340 from 351 and Skid Steer Loader declined to 10 from 17, while Self-Propelled AWP rose to 96 from 93; the Specialized Vehicles subtotal was 447 against 460. Services grew to 132 from 120 and Other grew to 18 from 12. Within Truck Mounted AWP, domestic sales to the Electric Power industry fell to 116 from 141 and domestic Rental rose to 108 from 98, while sales outside of Japan rose to 19 from 7. Within Services, Repair Services rose to 33 from 26, Inspection to 36 from 33, Spare Parts to 42 from 40, and Mounting was 22, unchanged from 22.
| Segment (In Hundred Millions JPY) | FY2026 (Twelve Months Ended March 31) | FY2025 (Twelve Months Ended March 31) |
|---|---|---|
| Specialized Vehicles – Truck Mounted AWP | 340 | 351 |
| Specialized Vehicles – Self-Propelled AWP | 96 | 93 |
| Specialized Vehicles – Skid Steer Loader | 10 | 17 |
| Specialized Vehicles – Subtotal | 447 | 460 |
| Services | 132 | 120 |
| Other | 18 | 12 |
| Net Sales | 596 | 593 |
| Aerial Work Platforms breakdown (In Hundred Millions JPY) | FY2026 (Twelve Months Ended March 31) | FY2025 (Twelve Months Ended March 31) |
|---|---|---|
| Truck Mounted AWP – Domestic – Rental | 108 | 98 |
| Truck Mounted AWP – Domestic – Electric Power | 116 | 141 |
| Truck Mounted AWP – Domestic – Telecommunications | 47 | 49 |
| Truck Mounted AWP – Domestic – Other | 38 | 40 |
| Truck Mounted AWP – Domestic – Railway | 12 | 16 |
| Truck Mounted AWP – JP total | 321 | 343 |
| Truck Mounted AWP – Outside of Japan | 19 | 7 |
| Truck Mounted AWP – Subtotal | 340 | 351 |
| Self-Propelled AWP – Domestic – Rental | 62 | 60 |
| Self-Propelled AWP – Domestic – Other | 12 | 9 |
| Self-Propelled AWP – JP total | 74 | 69 |
| Self-Propelled AWP – Outside of Japan | 23 | 24 |
| Self-Propelled AWP – Subtotal | 96 | 93 |
Orders and Backlog (Specialized Vehicles)
The amount of orders received for Specialized Vehicles was 416 for the twelve months ended March 31, 2026, against 453 in the prior year. By category, orders for Truck Mounted AWP were 313 against 358, while orders for Self-Propelled AWP were 104 against 94. Period-end backlog as of March 31, 2026 was 147, against 173 as of March 31, 2025, with Truck Mounted AWP at 107 against 141 and Self-Propelled AWP at 40 against 32. Amounts are in hundred millions of yen.
| Orders and backlog (In Hundred Millions JPY) | FY2026 | FY2025 |
|---|---|---|
| Orders received – Domestic – Rental | 163 | 166 |
| Orders received – Domestic – Electric Power | 103 | 132 |
| Orders received – Domestic – Telecommunications | 44 | 52 |
| Orders received – Domestic – Other | 57 | 44 |
| Orders received – Domestic – Railway | 7 | 21 |
| Orders received – Outside of Japan | 44 | 38 |
| Orders received – Subtotal | 416 | 453 |
| Period-end backlog – Truck Mounted AWP | 107 | 141 |
| Period-end backlog – Self-Propelled AWP | 40 | 32 |
| Period-end backlog – Subtotal | 147 | 173 |
Forecast for the Fiscal Year Ending March 31, 2027
For the fiscal year ending March 31, 2027, the company forecasts net sales of 63,000 million yen, up 5.7%, operating profit of 7,900 million yen, up 5.2%, ordinary profit of 8,500 million yen, up 4.0%, and profit attributable to owners of parent of 6,700 million yen, up 0.6%, with basic earnings per share of 103.78 yen. A segment-level forecast cannot be confirmed from the materials.
| Item (Millions of yen) | FY ending March 31, 2027 (Forecast) | FY ended March 31, 2026 (Actual) | Change (%) |
|---|---|---|---|
| Net sales | 63,000 | 59,613 | 5.7 |
| Operating profit | 7,900 | 7,511 | 5.2 |
| Ordinary profit | 8,500 | 8,172 | 4.0 |
| Profit attributable to owners of parent | 6,700 | 6,658 | 0.6 |
| Basic earnings per share (Yen) | 103.78 | 100.73 | – |
Shareholder Returns
Annual dividends per share for the fiscal year ended March 31, 2026 totalled 60.00 yen, comprising a second quarter-end dividend of 30.00 yen and a fiscal year-end dividend of 30.00 yen, against 55.00 yen a year earlier (20.00 yen and 35.00 yen). Total cash dividends were 3,873 million yen, the consolidated payout ratio was 59.6% and the ratio of dividends to net assets was 5.2%. For the fiscal year ending March 31, 2027 the company forecasts an annual dividend of 65.00 yen (33.00 yen at the second quarter-end and 32.00 yen at the fiscal year-end), for a forecast payout ratio of 62.6%. During the fiscal year ended March 31, 2026 the company purchased treasury shares of 12,831,010 thousand yen and cancelled treasury shares of 12,826,500 thousand yen; the total number of issued shares including treasury shares fell to 64,570,000 shares as of March 31, 2026 from 74,570,000 shares as of March 31, 2025.
| Annual dividends per share (Yen) | Second quarter-end | Fiscal year-end | Total | Payout ratio (Consolidated, %) |
|---|---|---|---|---|
| FY ended March 31, 2025 | 20.00 | 35.00 | 55.00 | 64.7 |
| FY ended March 31, 2026 | 30.00 | 30.00 | 60.00 | 59.6 |
| FY ending March 31, 2027 (Forecast) | 33.00 | 32.00 | 65.00 | 62.6 |
Financial Position, Cash Flows and Capital Expenditure
Total assets stood at 92,812 million yen as of March 31, 2026, against 100,358 million yen a year earlier, and net assets were 75,398 million yen against 84,023 million yen, giving an equity-to-asset ratio of 81.2% against 83.7%. Net assets per share were 1,167.89 yen. Cash flows from operating activities were 803 million yen, cash flows from investing activities were negative 3,675 million yen and cash flows from financing activities were negative 17,436 million yen, leaving cash and cash equivalents at end of period of 26,708 million yen. In the results reference materials, capital expenditures for the twelve months ended March 31, 2026 were 76.1 and depreciation and amortization was 14.0 in hundred millions of yen, against 33.4 and 14.8 respectively in the prior year, and the assumed exchange rate was 148 yen to the US dollar against 140 yen.
This article is an analysis based on publicly available information and is not a recommendation to buy or sell any specific securities. Investment decisions are your own responsibility.
![[Obayashi] Investors’ Guide 2026 — The Complete 24-Article Breakdown](https://japan-equity.com/wp-content/uploads/2026/07/hub_cover-1024x1024.png)
![[Obayashi] IR & SR Policy — Feeding Dialogue Back into Management](https://japan-equity.com/wp-content/uploads/2026/07/p32_sq-1024x1024.jpg)
![[Obayashi] Real Estate Development — 18.7% Margin, ¥287.7bn Unrealized Gains](https://japan-equity.com/wp-content/uploads/2026/07/p20_sq-1024x1024.jpg)
![[Obayashi] Domestic Civil Engineering — Resilience Spending Supports 9.6% Margin](https://japan-equity.com/wp-content/uploads/2026/07/p11_sq-1024x1024.jpg)
![[Obayashi] Share Price & External Ratings — vs TOPIX, ESG Index Inclusion](https://japan-equity.com/wp-content/uploads/2026/07/p40_sq-1024x1024.jpg)
![[Construction] ¥75.5tn Investment, Shrinking Workforce — Big-5 Market Share](https://japan-equity.com/wp-content/uploads/2026/07/p12_sq-1024x1024.jpg)



![[Obayashi] Capital Policy & Shareholder Returns — ROE 10%+, DOE ~5%, ¥100bn Buyback](https://japan-equity.com/wp-content/uploads/2026/07/p27_sq-1024x1024.jpg)
![[Obayashi] Reducing Cross-Shareholdings — ¥285.2bn Sold in Five Years](https://japan-equity.com/wp-content/uploads/2026/07/p29_sq-1024x1024.jpg)
![[Obayashi] ¥750bn Investment Plan — ¥300bn to Development, ¥190bn to Tech/DX](https://japan-equity.com/wp-content/uploads/2026/07/p30_sq-1024x1024.jpg)
![[Obayashi] MTP2022 KPIs — Operating Profit ~2x Target, ROE 14.4%](https://japan-equity.com/wp-content/uploads/2026/07/p25_sq-1024x1024.jpg)
![[Obayashi] Cash Allocation — ¥420bn Investment CF Over Five Years](https://japan-equity.com/wp-content/uploads/2026/07/p26_sq-1024x1024.jpg)
![[Obayashi] Green Energy — 44 Plants, 344MW, and the Green Hydrogen Challenge](https://japan-equity.com/wp-content/uploads/2026/07/p21_sq-1024x1024.jpg)
![[Obayashi] Tackling the Labor Shortage — Robotics Construction®](https://japan-equity.com/wp-content/uploads/2026/07/p14_sq-1024x1024.jpg)
