
This article is based on publicly available IR materials and is not a recommendation to buy or sell any specific securities.
Note: RORZE’s fiscal year ends in February. The company refers to the fiscal year ended February 28, 2026 (March 1, 2025 to February 28, 2026) as “FY2025” or “FY’25,” and to the fiscal year ending February 2027 as “FY2026.” This site classifies the year ended February 2026 as FY2025; the labels used in the company’s materials are retained in the body, tables, and segment data below.
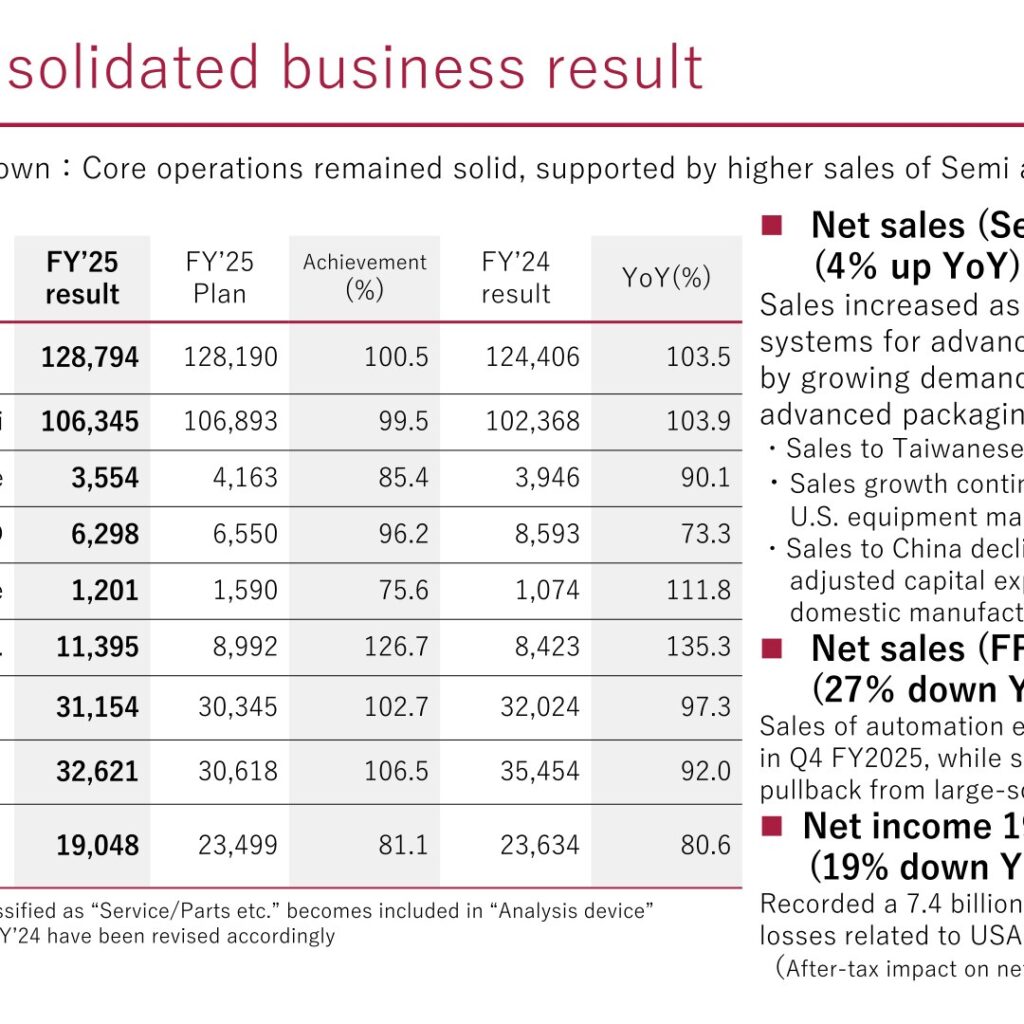
RORZE CORPORATION (6323) released its “FY2025 (Ended February 28, 2026) Financial Briefing” dated April 9, 2026. For FY2025, net sales rose 3.5% year on year to 128,794 million JPY, led by Semi and Service/Parts, and gross profit rose 6%. Operating profit declined 2.7% to 31,154 million JPY as the operating margin fell 2 percentage points year on year to 24% on higher SG&A expenses, including Nanoverse-related costs. Ordinary profit declined 8.0% to 32,621 million JPY, reflecting lower foreign exchange gains, and profit attributable to owners of parent declined 19.4% to 19,048 million JPY following the recognition of a 7.4 billion JPY litigation loss provision after a USA jury verdict. The company describes the year as “revenue up, profit down,” with core operations remaining solid.
Consolidated Results (FY2025 Actual)
Net sales of 128,794 million JPY came in at 100.5% of the FY’25 plan of 128,190 million JPY. Operating profit of 31,154 million JPY was 102.7% of the 30,345 million JPY plan, and ordinary profit of 32,621 million JPY was 106.5% of the 30,618 million JPY plan, while profit attributable to owners of parent of 19,048 million JPY was 81.1% of the 23,499 million JPY plan. The exchange rate for FY’25 was 150 JPY/USD, unchanged from the initial forecast of 150. Semiconductor related equipment accounted for 83% of sales. Regarding the litigation, a jury verdict was rendered in favor of the plaintiff in a lawsuit involving the company and its USA subsidiary, as announced on March 16, 2026; an extraordinary loss (provision for litigation losses) of 7,429 million JPY was recorded, corresponding to the provisional damages amount indicated in the jury verdict, with an after-tax impact on net income of 5.1 billion JPY. The company notes that this amount was calculated based on information available at this time and may change depending on the progress of future procedures.
| Item (Million JPY) | FY’25 Result | FY’25 Plan | Achievement (%) | FY’24 Result | YoY (%) |
|---|---|---|---|---|---|
| Net sales | 128,794 | 128,190 | 100.5 | 124,406 | 103.5 |
| Operating Profit | 31,154 | 30,345 | 102.7 | 32,024 | 97.3 |
| Ordinary Profit | 32,621 | 30,618 | 106.5 | 35,454 | 92.0 |
| Profit attributable to owners of parent | 19,048 | 23,499 | 81.1 | 23,634 | 80.6 |
In the operating profit bridge, the sales fluctuation contributed +3,046 million JPY against FY2024 operating profit of 32,024 million JPY, while the exchange rate impact was △12 million JPY, labor costs △1,577 million JPY, R&D expense △685 million JPY, goodwill amortization △1,427 million JPY, and other SG&A expenses △213 million JPY, resulting in FY2025 operating profit of 31,154 million JPY. The impact of Nanoverse on consolidated operating profit was labor costs 1,887 million JPY, R&D expense 210 million JPY, goodwill amortization 2,831 million JPY, and other SG&A expense 1,317 million JPY. For the full year, the company estimates the impact of Nanoverse Technologies, Ltd on operating income at △6.2 billion JPY (goodwill amortization 2.8; NV’s operating loss 3.4), versus △3.0 billion JPY in FY2024, and the impact on profit attributable to owners of parent at △4.0 billion JPY versus △2.0 billion JPY.
Sales by Product Category and Region
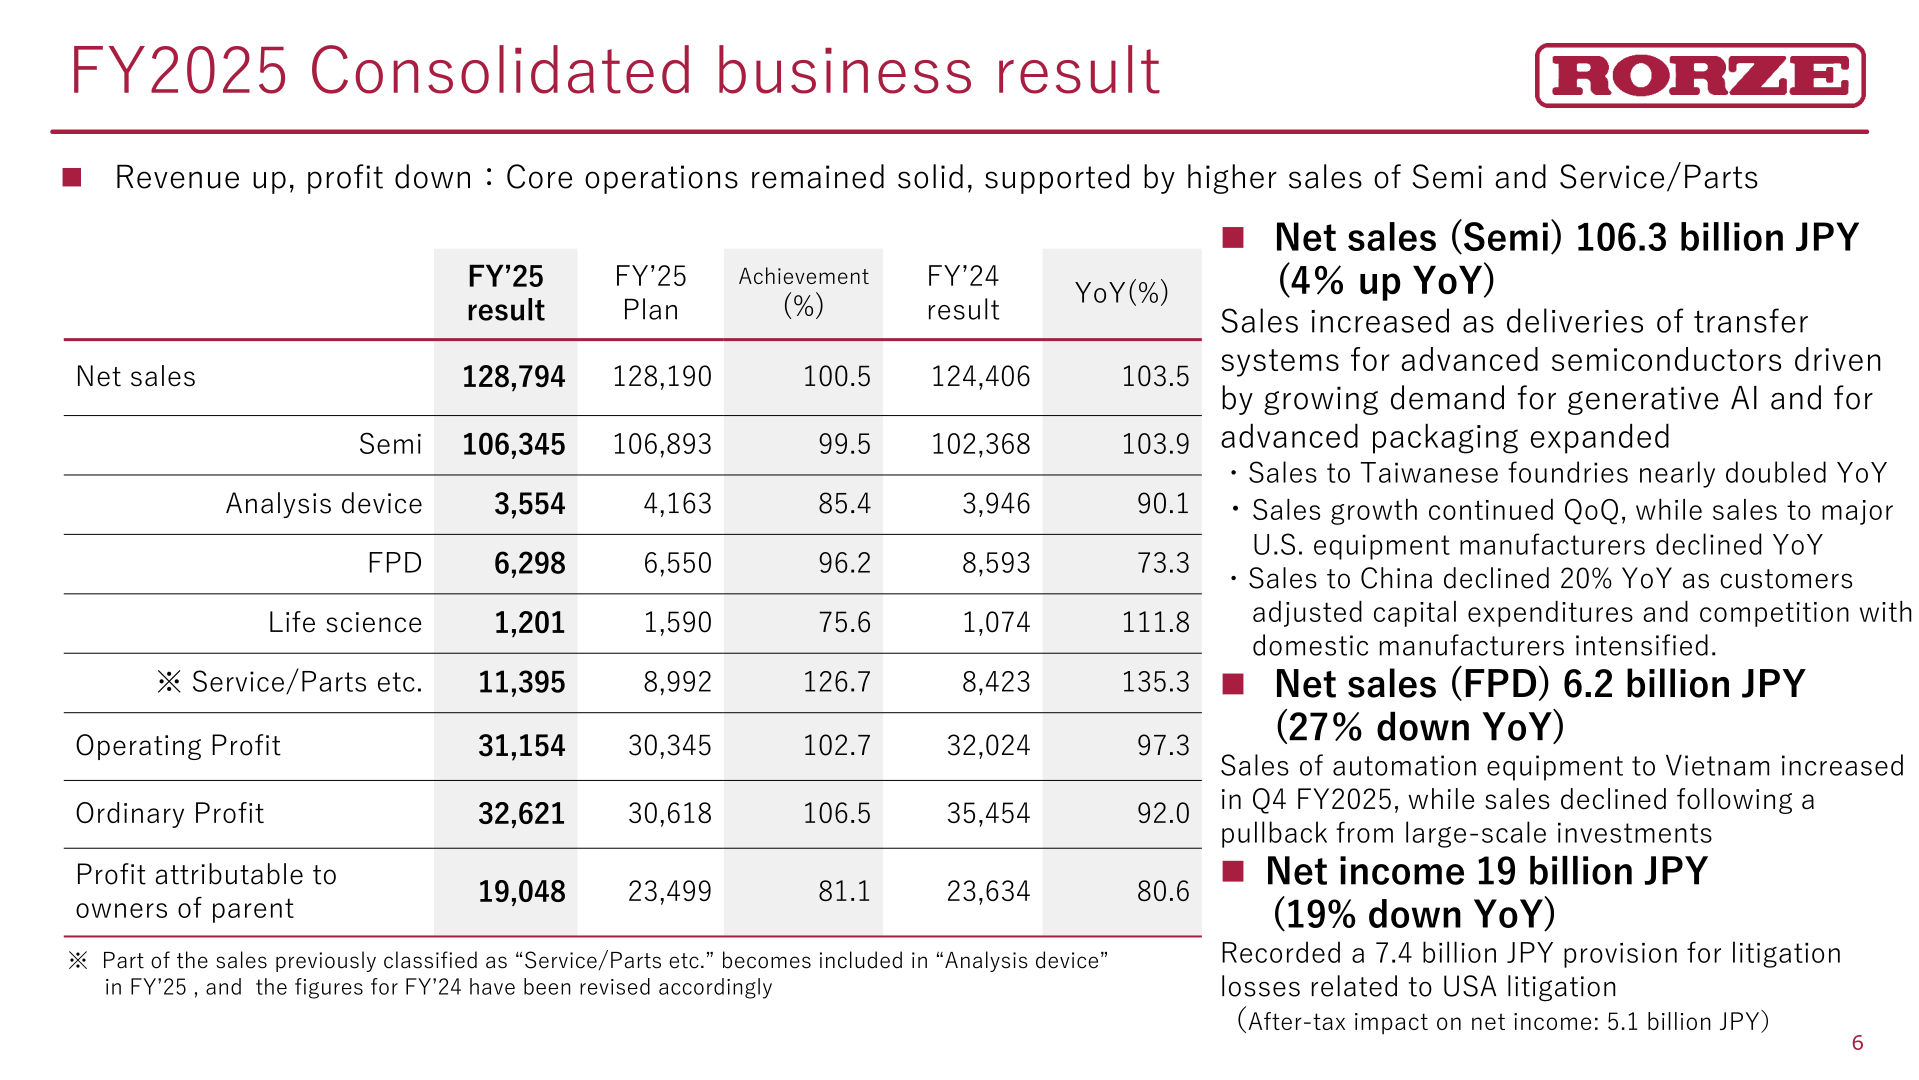
Semi sales were 106,345 million JPY (103.9% of FY’24; 4% up year on year), as deliveries of transfer systems for advanced semiconductors, driven by growing demand for generative AI and for advanced packaging, expanded. Sales to Taiwanese foundries nearly doubled year on year, sales to major U.S. equipment manufacturers declined year on year, and sales to China declined 20% year on year as customers adjusted capital expenditures and competition with domestic manufacturers intensified. FPD sales were 6,298 million JPY (73.3% of FY’24; 27% down year on year), as sales declined following a pullback from large-scale investments, although sales of automation equipment to Vietnam increased in Q4 FY2025. Analysis device sales were 3,554 million JPY (90.1%), Life science 1,201 million JPY (111.8%), and Service/Parts etc. 11,395 million JPY (135.3%). Part of the sales previously classified as “Service/Parts etc.” is included in “Analysis device” from FY’25, and the FY’24 figures have been revised accordingly.
| Product category (Million JPY) | FY’25 Result | FY’25 Plan | Achievement (%) | FY’24 Result | YoY (%) |
|---|---|---|---|---|---|
| Semi | 106,345 | 106,893 | 99.5 | 102,368 | 103.9 |
| Analysis device | 3,554 | 4,163 | 85.4 | 3,946 | 90.1 |
| FPD | 6,298 | 6,550 | 96.2 | 8,593 | 73.3 |
| Life science | 1,201 | 1,590 | 75.6 | 1,074 | 111.8 |
| Service/Parts etc. | 11,395 | 8,992 | 126.7 | 8,423 | 135.3 |
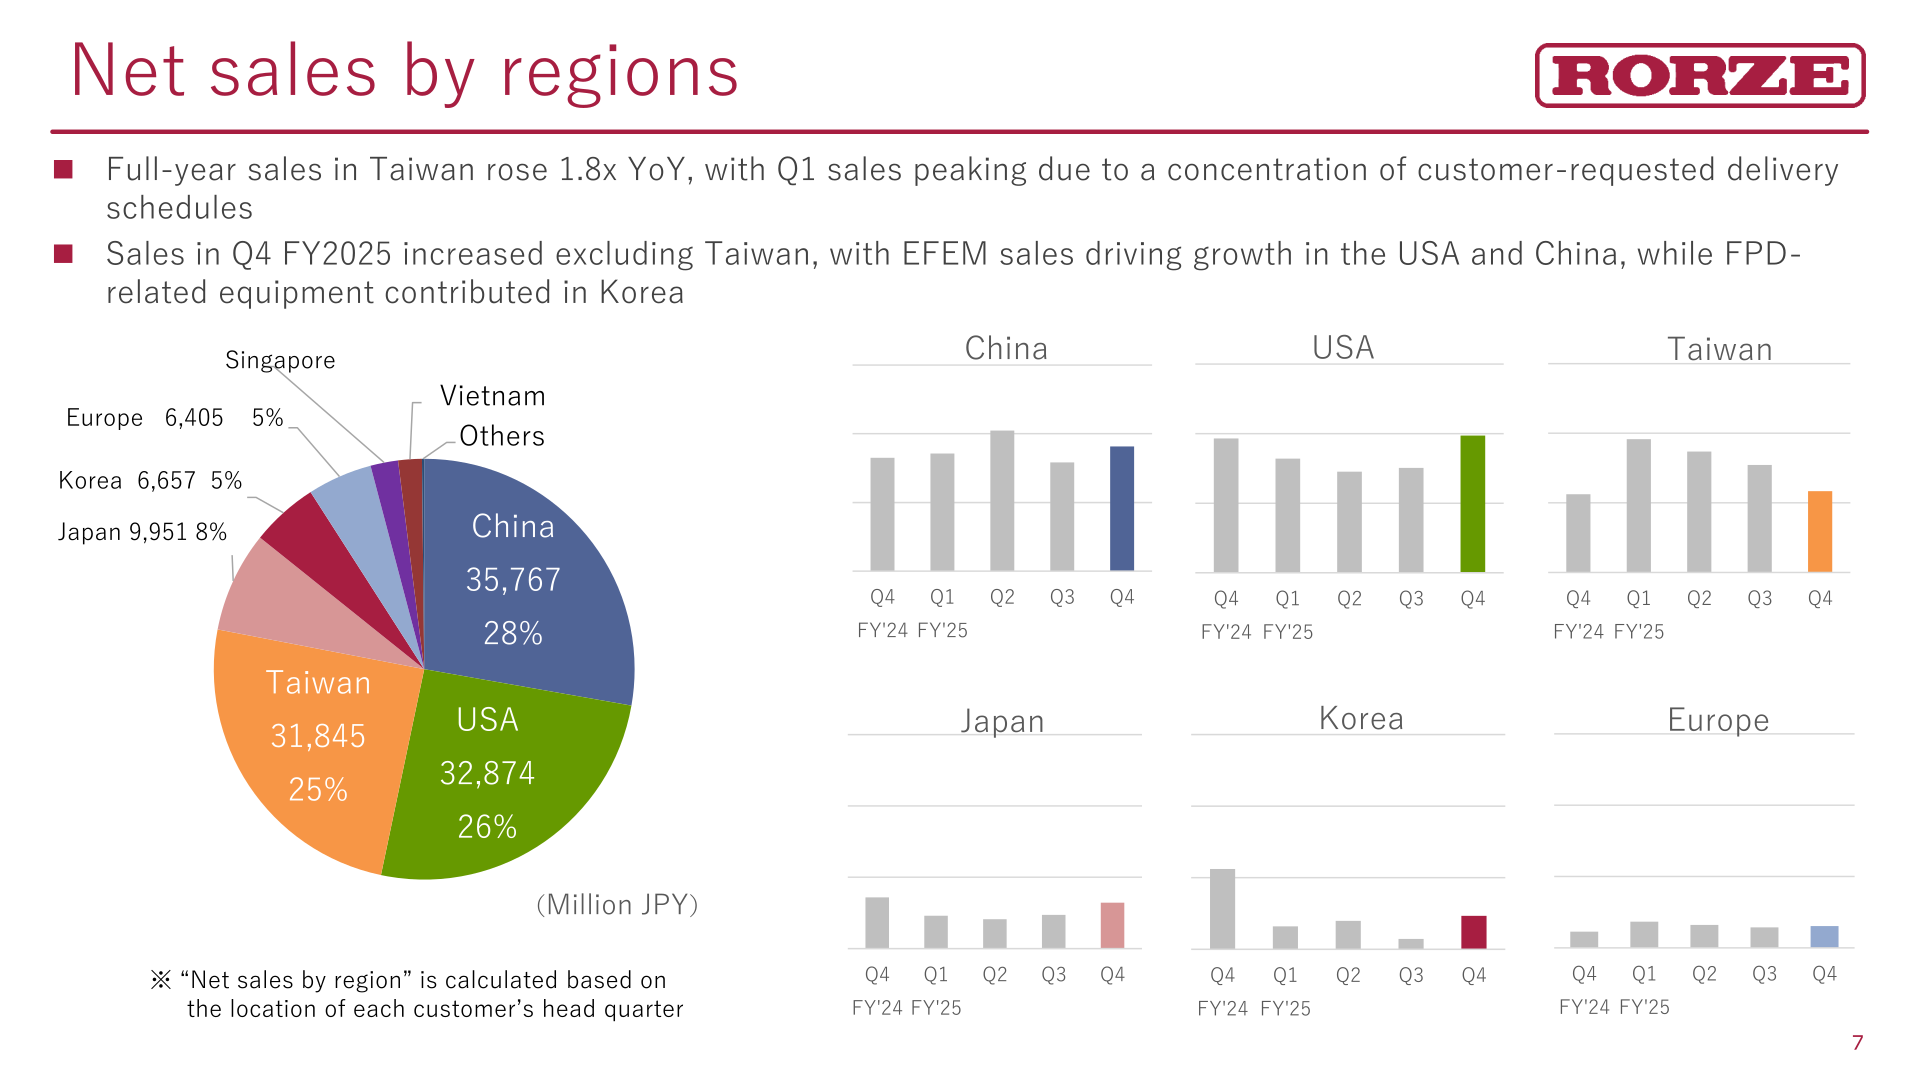
By region (calculated based on the location of each customer’s headquarters), China accounted for 35,767 million JPY (28%), the USA 32,874 million JPY (26%), Taiwan 31,845 million JPY (25%), Japan 9,951 million JPY (8%), Korea 6,657 million JPY (5%), and Europe 6,405 million JPY (5%). Full-year sales in Taiwan rose 1.8x year on year, with Q1 sales peaking due to a concentration of customer-requested delivery schedules. Sales in Q4 FY2025 increased excluding Taiwan, with EFEM sales driving growth in the USA and China, while FPD-related equipment contributed in Korea. In Semi, order intake for Q4 reached a record high of 34 billion JPY, up 11 billion JPY (+48%) quarter on quarter, as end-user orders from Taiwan and Singapore surged and EFEM orders in China increased; Semi orders were 34,004 million JPY in Q4 FY’25 and the Semi order backlog stood at 50,461 million JPY.
Balance Sheet and Cash Flows
The company maintained cash and deposits for business investments, reduced interest-bearing debt by 7.8 billion JPY, and executed a share buyback of 5 billion JPY (completed by the end of July). A litigation loss provision of 7.4 billion JPY for provisional damages was recorded under other non-current liabilities following the USA jury verdict. In FY2025 consolidated cash flows, cash at the end of FY2024 was 61,330 million JPY; cash flows from operating activities were 31,191 million JPY, cash flows from investing activities △3,300 million JPY, cash flows from financing activities △15,520 million JPY, and the effect of exchange on cash and cash equivalents 639 million JPY, leaving cash at the end of FY2025 at 74,341 million JPY.
FY2026 Forecast
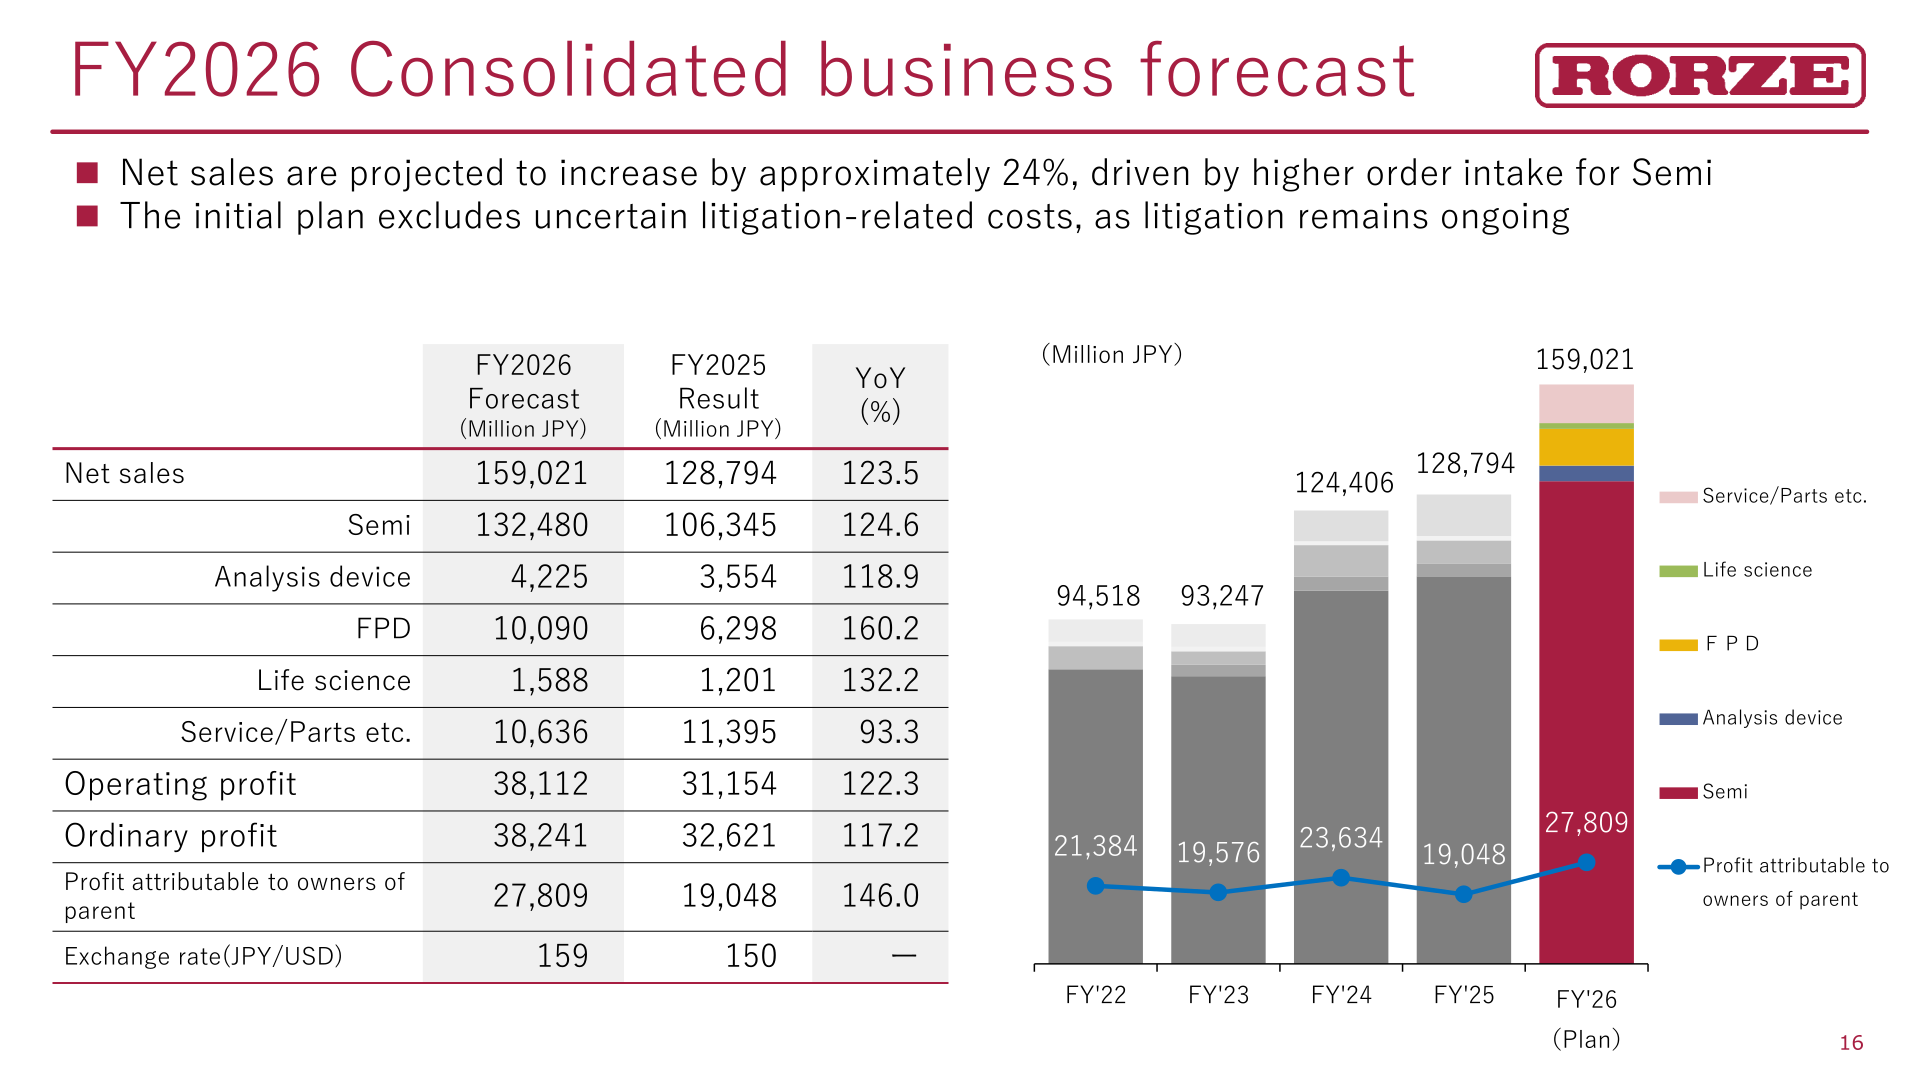
For FY2026 (the fiscal year ending February 2027), the company forecasts net sales of 159,021 million JPY (123.5% of FY2025), operating profit of 38,112 million JPY (122.3%), ordinary profit of 38,241 million JPY (117.2%), and profit attributable to owners of parent of 27,809 million JPY (146.0%), assuming an exchange rate of 159 JPY/USD versus 150 in FY2025. Net sales are projected to increase by approximately 24%, driven by higher order intake for Semi. The initial plan excludes uncertain litigation-related costs, as litigation remains ongoing. The company expects the impact of Nanoverse Technologies on operating income to be △6.2 billion JPY in FY2026 (goodwill amortization 3.0; NV’s operating loss 3.2) and the impact on profit attributable to owners of parent to be △4.1 billion JPY; sales of the equipment under development and evaluation are expected to be recognized in FY2027.
| Item (Million JPY) | FY2026 Forecast | FY2025 Result | YoY (%) |
|---|---|---|---|
| Net sales | 159,021 | 128,794 | 123.5 |
| Semi | 132,480 | 106,345 | 124.6 |
| Analysis device | 4,225 | 3,554 | 118.9 |
| FPD | 10,090 | 6,298 | 160.2 |
| Life science | 1,588 | 1,201 | 132.2 |
| Service/Parts etc. | 10,636 | 11,395 | 93.3 |
| Operating profit | 38,112 | 31,154 | 122.3 |
| Ordinary profit | 38,241 | 32,621 | 117.2 |
| Profit attributable to owners of parent | 27,809 | 19,048 | 146.0 |
| Exchange rate (JPY/USD) | 159 | 150 | ー |
On the market environment, the company states that the widespread adoption and expanding use of generative AI accelerate semiconductor demand at a pace exceeding historical levels, that the semiconductor manufacturing equipment market continues to grow over the coming years, and that semiconductor capital investment concentrates on leading-edge logic, HBM, and advanced packaging, driving growth in both front-end and back-end processes. Meanwhile, procurement risks remain, as rising memory prices and geopolitical risks, including tensions in the Middle East, constrain the supply of petroleum-related products. In Semi, the company plans to expand production capacity, including the expansion of the Vietnam plant, and to mitigate procurement risks through inventory buildup and other measures; in China, yield challenges in advanced process development drive a shift back toward high-quality overseas products. Capital investment in FY2026 is planned at 11,982 million JPY, including land acquisition for a new plant by the Vietnam subsidiary (7.4 billion JPY), and depreciation is expected to be 3.6 billion JPY; R&D expense is planned at 2,474 million JPY, focused on new products in vacuum wafer handling systems, equipment for advanced packaging, and foundational technologies for next-generation products.
Shareholder Returns
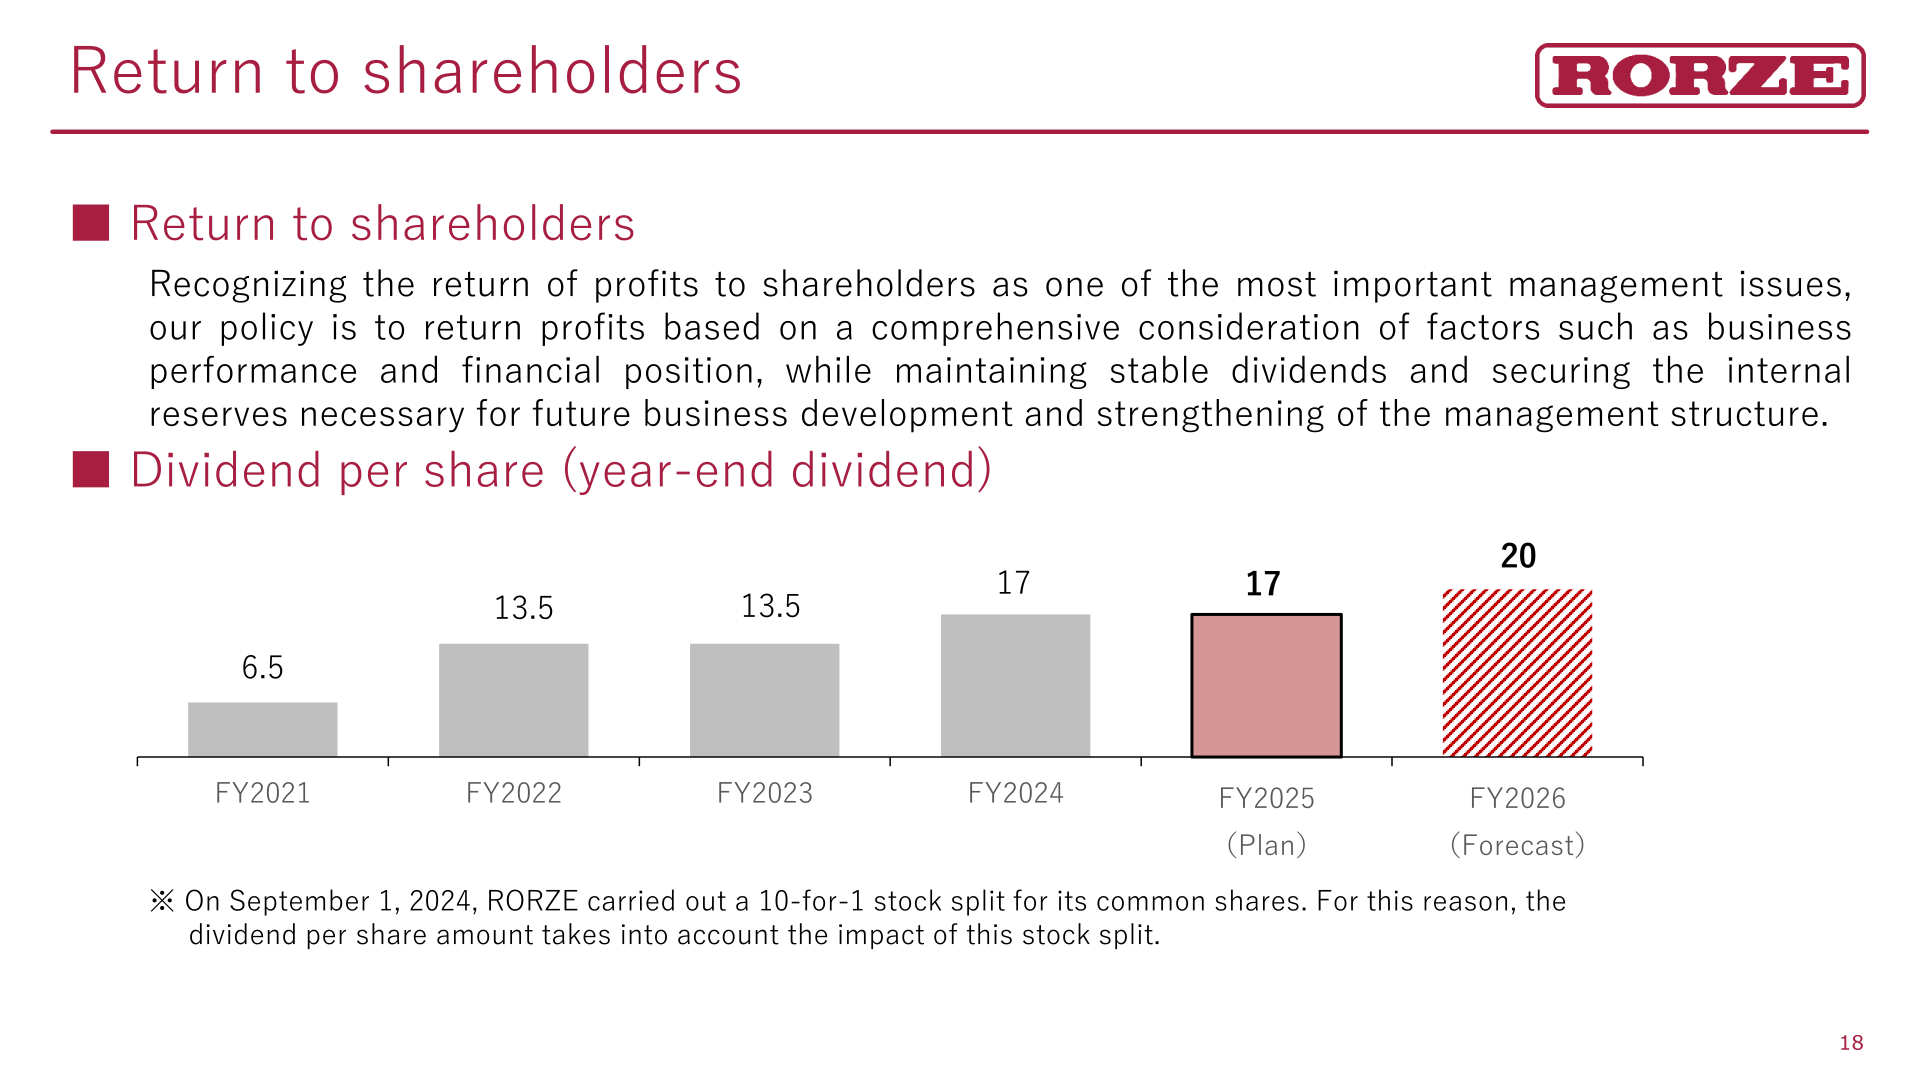
RORZE states that it recognizes the return of profits to shareholders as one of the most important management issues, and that its policy is to return profits based on a comprehensive consideration of factors such as business performance and financial position, while maintaining stable dividends and securing the internal reserves necessary for future business development and strengthening of the management structure. The year-end dividend per share is planned at 17 JPY for FY2025, unchanged from 17 JPY in FY2024, and forecast at 20 JPY for FY2026. On September 1, 2024, RORZE carried out a 10-for-1 stock split for its common shares, and the dividend per share amounts take into account the impact of this stock split. In FY2025 the company also executed a share buyback of 5 billion JPY.
| Fiscal year | FY2021 | FY2022 | FY2023 | FY2024 | FY2025 (Plan) | FY2026 (Forecast) |
|---|---|---|---|---|---|---|
| Dividend per share (year-end dividend, JPY) | 6.5 | 13.5 | 13.5 | 17 | 17 | 20 |
Topics
RORZE ROBOTECH in Vietnam plans a new plant in Hai Phong City (Japan Hai Phong Industrial Park, the same industrial park as the current factory), with a land area of approx. 238,300 square meters (about 5x the current site) and total plant floor area of approx. 180,000 square meters (about 2x the existing plant). The planned implementation period is mid-2025 to 2032, to be expanded in phases based on market trends, with total investment of approx. 330 million USD. Phase 1 construction is scheduled for completion in 2027 Q4, with operations starting in 2028 Q1. Separately, on March 28, 2026, RORZE was awarded three supplier awards by AMEC (Advanced Micro-Fabrication Equipment Inc., China): 20-Year Strategic Partner, Excellent Mass Production Support, and Excellent Quality Performance.
This article is an analysis based on publicly available information and is not a recommendation to buy or sell any specific securities. Investment decisions are your own responsibility.
![[Obayashi] Investors’ Guide 2026 — The Complete 24-Article Breakdown](https://japan-equity.com/wp-content/uploads/2026/07/hub_cover-1024x1024.png)
![[Obayashi] IR & SR Policy — Feeding Dialogue Back into Management](https://japan-equity.com/wp-content/uploads/2026/07/p32_sq-1024x1024.jpg)
![[Obayashi] Domestic Civil Engineering — Resilience Spending Supports 9.6% Margin](https://japan-equity.com/wp-content/uploads/2026/07/p11_sq-1024x1024.jpg)
![[Obayashi] Overseas Construction — Orders Reach ¥1.2tn](https://japan-equity.com/wp-content/uploads/2026/07/p15_sq-1024x1024.jpg)
![[Obayashi] Share Price & External Ratings — vs TOPIX, ESG Index Inclusion](https://japan-equity.com/wp-content/uploads/2026/07/p40_sq-1024x1024.jpg)
![[Construction] ¥75.5tn Investment, Shrinking Workforce — Big-5 Market Share](https://japan-equity.com/wp-content/uploads/2026/07/p12_sq-1024x1024.jpg)



![[Obayashi] Capital Policy & Shareholder Returns — ROE 10%+, DOE ~5%, ¥100bn Buyback](https://japan-equity.com/wp-content/uploads/2026/07/p27_sq-1024x1024.jpg)
![[Obayashi] Reducing Cross-Shareholdings — ¥285.2bn Sold in Five Years](https://japan-equity.com/wp-content/uploads/2026/07/p29_sq-1024x1024.jpg)
![[Obayashi] ¥750bn Investment Plan — ¥300bn to Development, ¥190bn to Tech/DX](https://japan-equity.com/wp-content/uploads/2026/07/p30_sq-1024x1024.jpg)
![[Obayashi] MTP2022 KPIs — Operating Profit ~2x Target, ROE 14.4%](https://japan-equity.com/wp-content/uploads/2026/07/p25_sq-1024x1024.jpg)
![[Obayashi] Cash Allocation — ¥420bn Investment CF Over Five Years](https://japan-equity.com/wp-content/uploads/2026/07/p26_sq-1024x1024.jpg)
![[Obayashi] Green Energy — 44 Plants, 344MW, and the Green Hydrogen Challenge](https://japan-equity.com/wp-content/uploads/2026/07/p21_sq-1024x1024.jpg)
![[Obayashi] Tackling the Labor Shortage — Robotics Construction®](https://japan-equity.com/wp-content/uploads/2026/07/p14_sq-1024x1024.jpg)
