
This article is based on publicly available IR materials and is not a recommendation to buy or sell any specific securities.
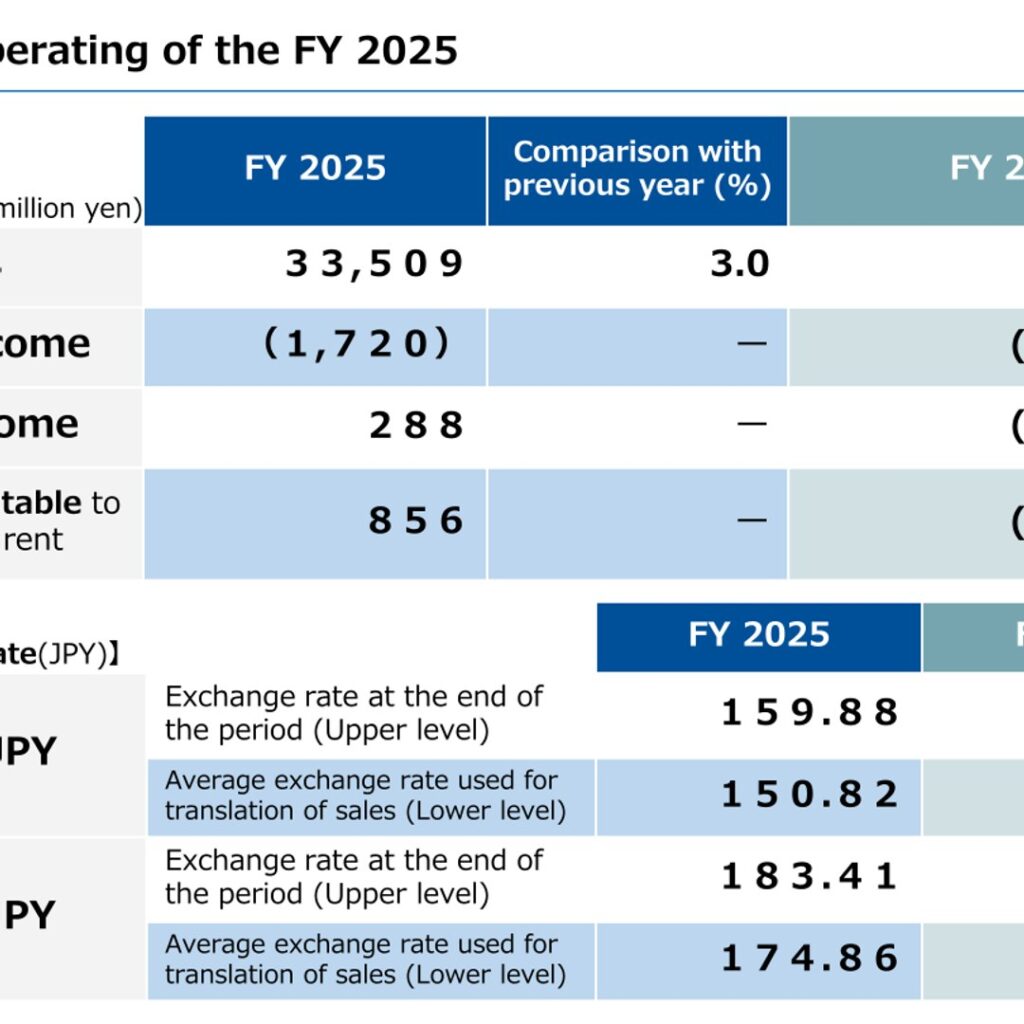
Shima Seiki Mfg., Ltd. presented its consolidated results for FY2025 in a May 2026 briefing deck titled “Consolidated Results for FY 2025.” The company labels this period FY2025, defined in the materials as the fiscal year ended March 31, 2026. Net sales came to 33,509 million yen, up 3.0% from the previous year. The company recorded an operating loss of 1,720 million yen, against an operating loss of 11,914 million yen a year earlier, and returned to positive ordinary income of 288 million yen and net income attributable to owners of the parent of 856 million yen.
Consolidated Results (Full-Year Actual)
All figures below are as presented in the deck, in millions of yen, with negative amounts shown in parentheses as in the source. Operating income improved from an operating loss of 11,914 million yen in FY2024, and both ordinary income and net income attributable to owners of the parent turned positive from losses of 11,481 million yen and 14,275 million yen respectively.
| Item (million yen) | FY2025 | Comparison with previous year (%) | FY2024 |
|---|---|---|---|
| Net Sales | 33,509 | 3.0 | 32,520 |
| Operating Income | (1,720) | — | (11,914) |
| Ordinary Income | 288 | — | (11,481) |
| Net income attributable to owners of the parent | 856 | — | (14,275) |
The deck also discloses the exchange rates used. For FY2025 the USD/JPY rate at the end of the period was 159.88 (149.52 in FY2024) and the average rate used for translation of sales was 150.82 (152.65). For EUR/JPY the end-of-period rate was 183.41 (162.08) and the average translation rate 174.86 (163.85).
Segment Results
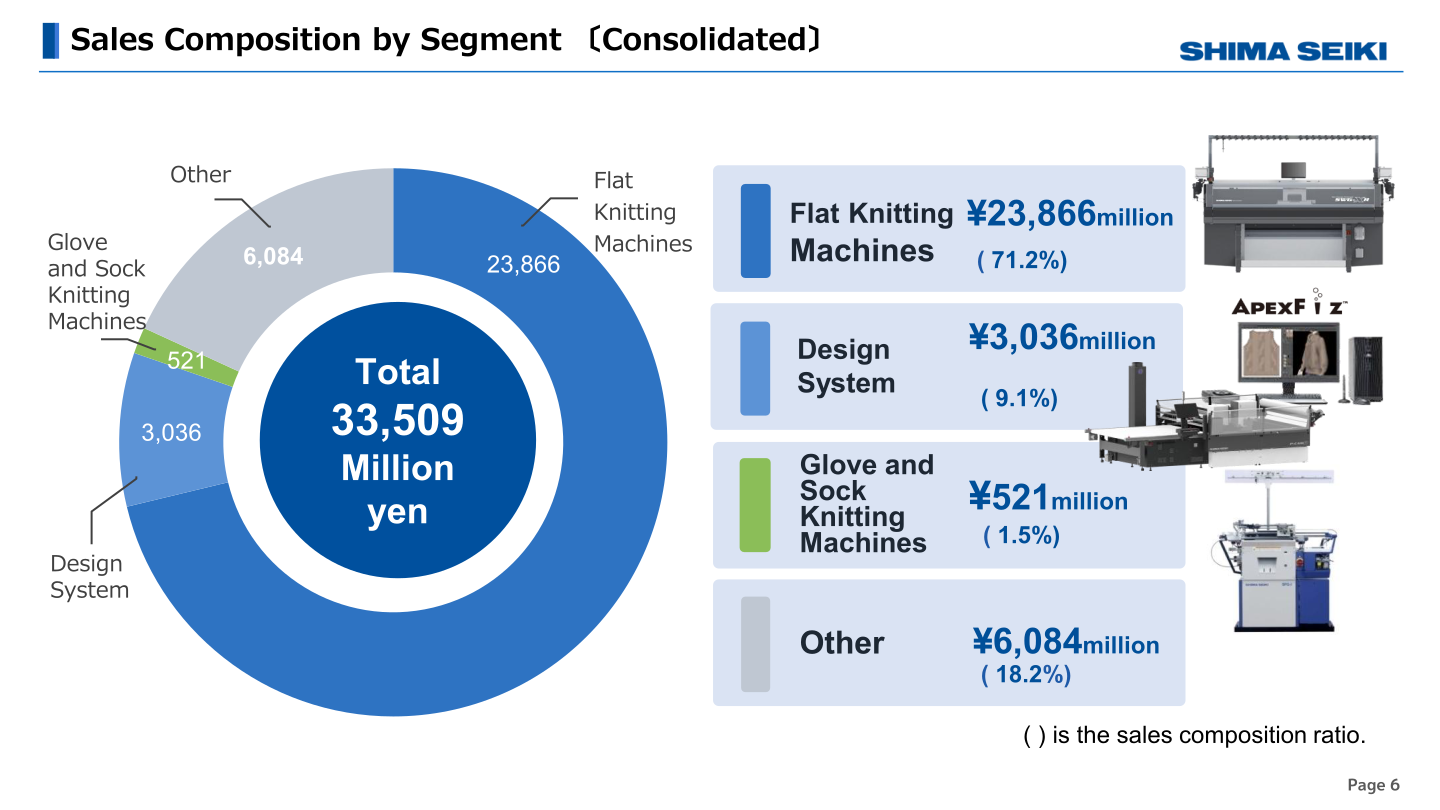
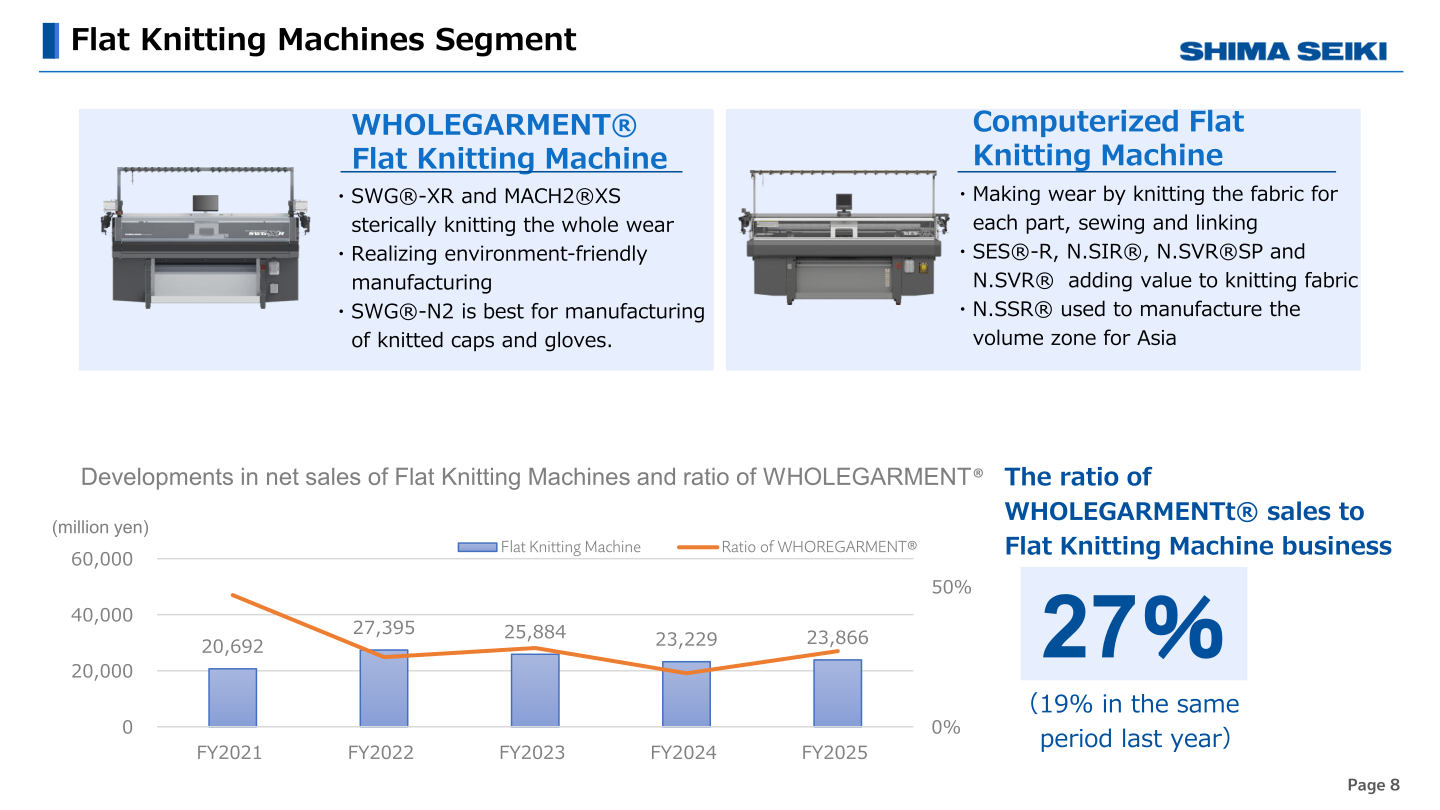
Flat Knitting Machines accounted for 23,866 million yen of net sales, or 71.2% of the total, followed by Other at 6,084 million yen (18.2%), Design System at 3,036 million yen (9.1%) and Glove and Sock Knitting Machines at 521 million yen (1.5%). The ratio of WHOLEGARMENT sales within the Flat Knitting Machine business was 27%, against 19% in the same period last year. Within the Design System business, the ratio of P-CAM sales was 51%, the same as in the previous year.
| Segment (million yen) | Net Sales | Comparison with previous year (%) | Operating income | Comparison with previous year (%) |
|---|---|---|---|---|
| Flat Knitting Machine | 23,866 | 2.7 | 2,559 | — |
| Design System | 3,036 | 7.8 | 671 | 489.9 |
| Glove and Sock Knitting Machines | 521 | (31.0) | 76 | 206.5 |
| Other | 6,084 | 6.4 | 1,048 | — |
| Corporate elimination | (6,076) | |||
| Total | 33,509 | 3.0 | (1,720) | — |
By market, the deck notes that in Bangladesh orders received were on a recovery trend as the disruption caused by the July 2024 anti-government demonstrations normalized, with the high-efficiency N.SVR and N.SSR models increasing sales volume from the previous period. In the Chinese market, computerized flat knitting machines recorded weak sales volume, mainly from Hong Kong-based major customers, and fell below the sales plan because of the delayed launch of cost-effective shaping machines originally scheduled for the second half. In Italy there were signs of recovery centered on luxury brands and their suppliers, while in the Middle East, with inflation persisting particularly in Turkey, sales of computerized flat knitting machines decreased in volume. Domestically, sales volume for WHOLEGARMENT flat knitting machines generally increased. In Design Systems, the number of licensing contracts for APEXFiz, the subscription service of SDS-ONE APEX software, increased mainly with fashion-related educational institutions in Japan and overseas, and sales of the P-CAM automatic cutting machine were on a recovery trend mainly in Japan. The Glove and Sock Knitting Machine segment remained weak because major Japanese and overseas users had completed their capital investments.
Sales by Region
Asia remained the largest market at 16,034 million yen, and the deck shows Asia at roughly 48% of the total, Europe 25%, Japan 18%, Other areas 6% and the Middle East 3%. The Middle East was the only region to decline, at -49.1%.
| Region (million yen) | FY2025 | Comparison with previous year (%) | FY2024 |
|---|---|---|---|
| Japan | 6,160 | +12.0 | 5,500 |
| Europe | 8,207 | +16.2 | 7,065 |
| Asia | 16,034 | +1.9 | 15,732 |
| Middle East | 1,159 | -49.1 | 2,275 |
| Other Areas (Overseas) | 1,947 | +0.1 | 1,946 |
| Total | 33,509 | +3.0 | 32,520 |
Orders received and order backlogs are disclosed quarterly in yen terms. In FY2025 quarterly orders received were 6,207 million yen in Q1, 5,498 million yen in Q2, 5,861 million yen in Q3 and 6,810 million yen in Q4, while the order backlog stood at 4,340 million yen at the end of Q4, against 7,385 million yen at the end of Q4 FY2024.
Financial Position and Cash Flows
Total assets stood at 109,531 million yen, up 10,125 million yen, with total net assets of 82,382 million yen, up 4,641 million yen. Cash and deposits were 21,295 million yen at the end of the current period, against 14,129 million yen at the end of the previous period, an increase of 7,166 million yen. The capital adequacy ratio was 75.2%, compared with 78.2% at the end of the previous year, and net assets per share were 2,427 yen. Cash flows from operating activities were 408 million yen (against negative 4,461 million yen), cash flows from investing activities were negative 1,468 million yen and cash flows from financing activities were 5,470 million yen, mainly due to proceeds from long-term loans payable; cash and cash equivalents at the end of the year were 15,617 million yen.
FY2026 Forecast
For FY2026 the company forecasts net sales of 41,000 million yen, up 22.4%, with operating income of 300 million yen against the operating loss of 1,720 million yen in FY2025, ordinary income of 1,000 million yen and net income attributable to owners of the parent of 900 million yen. The forecast assumes exchange rates for March 2027 of 157 yen to the US dollar and 183 yen to the euro. The deck also gives foreign exchange sensitivity for FY2026 of 90 million yen of operating income per one-yen move in USD/JPY and 30 million yen per one-yen move in EUR/JPY.
| Item (million yen) | FY2026 (Forecast) | Comparison with the previous year (%) | FY2025 |
|---|---|---|---|
| Net Sales | 41,000 | 22.4 | 33,509 |
| Operating income | 300 | — | (1,720) |
| Ordinary Income | 1,000 | 246.3 | 288 |
| Net income attributable to owners of the parent | 900 | 5.1 | 856 |
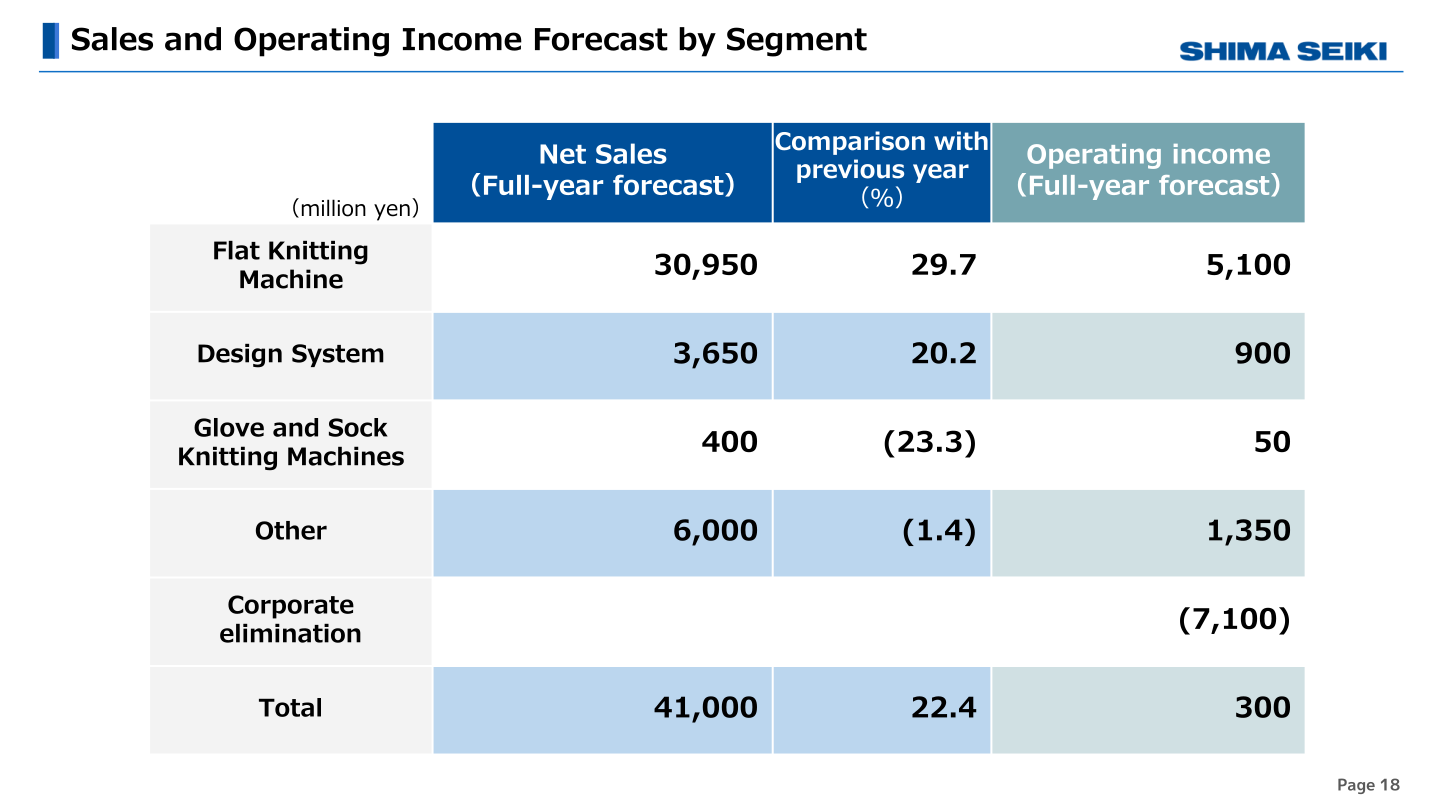
By segment, the full-year forecast calls for Flat Knitting Machine net sales of 30,950 million yen (up 29.7%) with operating income of 5,100 million yen, Design System net sales of 3,650 million yen (up 20.2%) with operating income of 900 million yen, Glove and Sock Knitting Machines net sales of 400 million yen (a change of (23.3)%) with operating income of 50 million yen, and Other net sales of 6,000 million yen (a change of (1.4)%) with operating income of 1,350 million yen, before corporate elimination of (7,100) million yen. By region, the forecast composition is Asia 20.8 billion yen (51%), Europe 10.8 billion yen (26%), Japan 6.5 billion yen (16%), Middle East 1.1 billion yen (3%) and Other areas 1.8 billion yen (4%), for a total of 41.0 billion yen.
Shareholder Returns
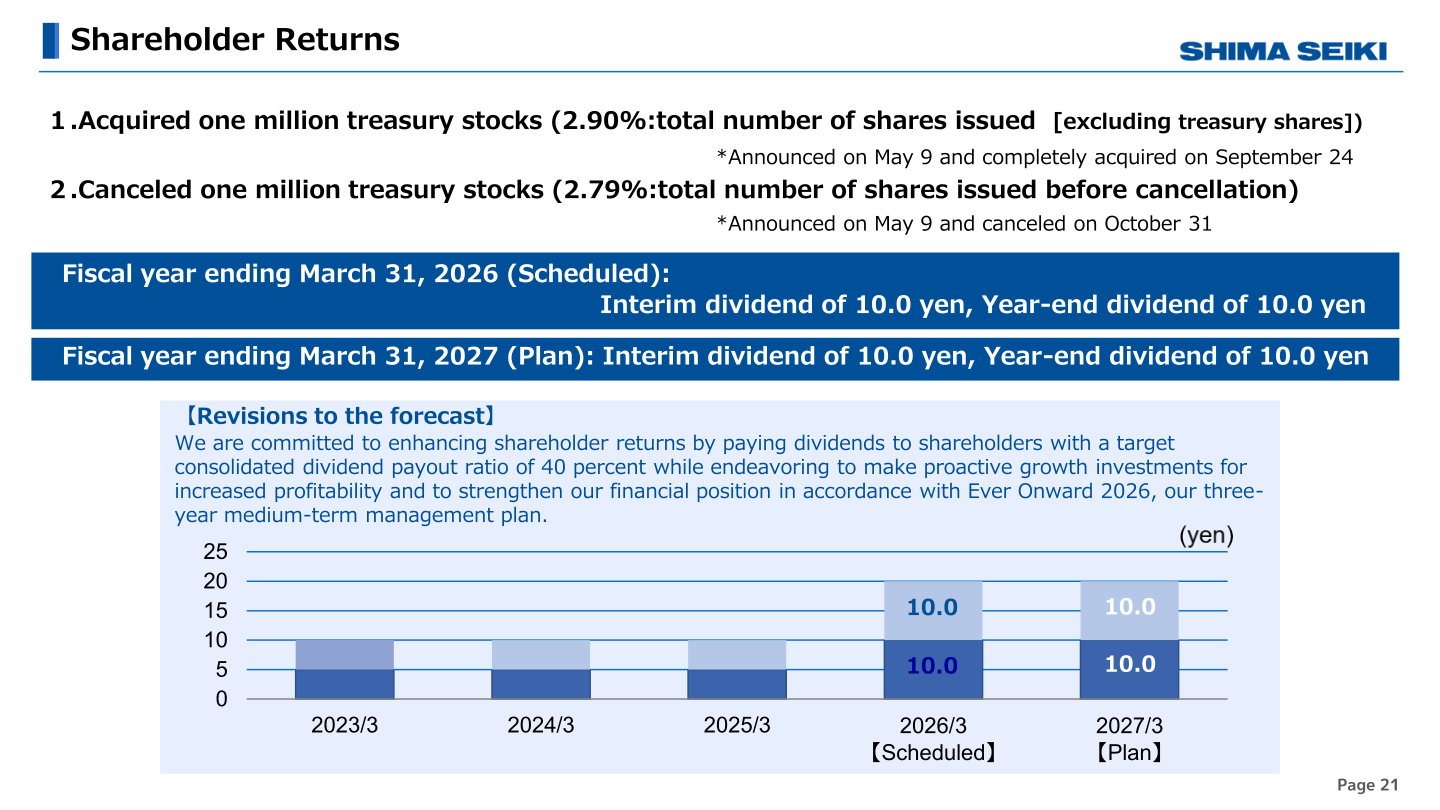
For the fiscal year ending March 31, 2026 (Scheduled) the deck shows an interim dividend of 10.0 yen and a year-end dividend of 10.0 yen, and for the fiscal year ending March 31, 2027 (Plan) an interim dividend of 10.0 yen and a year-end dividend of 10.0 yen. The company also acquired one million treasury shares, equal to 2.90% of the total number of shares issued (excluding treasury shares), announced on May 9 and completely acquired on September 24, and canceled one million treasury shares, equal to 2.79% of the total number of shares issued before cancellation, announced on May 9 and canceled on October 31.
Medium-Term Plan and Investment
The company states that it is committed to enhancing shareholder returns by paying dividends with a target consolidated dividend payout ratio of 40 percent, while making proactive growth investments for increased profitability and strengthening its financial position, in accordance with Ever Onward 2026, its three-year medium-term management plan. For the fiscal year ended March 2026 (actual results) the deck reports capital investment of 1.17 billion yen (including leased assets of 60 million yen), depreciation and amortization of 1.08 billion yen and R&D of 3.26 billion yen. For the fiscal year ending March 2027 (plan) it shows capital investment of 1.6 billion yen (including leased assets of 300 million yen), depreciation and amortization of 1.2 billion yen and R&D of 3.8 billion yen.
This article is an analysis based on publicly available information and is not a recommendation to buy or sell any specific securities. Investment decisions are your own responsibility.
![[Obayashi] Investors’ Guide 2026 — The Complete 24-Article Breakdown](https://japan-equity.com/wp-content/uploads/2026/07/hub_cover-1024x1024.png)
![[Obayashi] IR & SR Policy — Feeding Dialogue Back into Management](https://japan-equity.com/wp-content/uploads/2026/07/p32_sq-1024x1024.jpg)
![[Obayashi] Real Estate Development — 18.7% Margin, ¥287.7bn Unrealized Gains](https://japan-equity.com/wp-content/uploads/2026/07/p20_sq-1024x1024.jpg)
![[Obayashi] Domestic Civil Engineering — Resilience Spending Supports 9.6% Margin](https://japan-equity.com/wp-content/uploads/2026/07/p11_sq-1024x1024.jpg)
![[Obayashi] Share Price & External Ratings — vs TOPIX, ESG Index Inclusion](https://japan-equity.com/wp-content/uploads/2026/07/p40_sq-1024x1024.jpg)
![[Construction] ¥75.5tn Investment, Shrinking Workforce — Big-5 Market Share](https://japan-equity.com/wp-content/uploads/2026/07/p12_sq-1024x1024.jpg)
![[Obayashi] Capital Policy & Shareholder Returns — ROE 10%+, DOE ~5%, ¥100bn Buyback](https://japan-equity.com/wp-content/uploads/2026/07/p27_sq-1024x1024.jpg)
![[Obayashi] Reducing Cross-Shareholdings — ¥285.2bn Sold in Five Years](https://japan-equity.com/wp-content/uploads/2026/07/p29_sq-1024x1024.jpg)
![[Obayashi] ¥750bn Investment Plan — ¥300bn to Development, ¥190bn to Tech/DX](https://japan-equity.com/wp-content/uploads/2026/07/p30_sq-1024x1024.jpg)
![[Obayashi] MTP2022 KPIs — Operating Profit ~2x Target, ROE 14.4%](https://japan-equity.com/wp-content/uploads/2026/07/p25_sq-1024x1024.jpg)
![[Obayashi] Cash Allocation — ¥420bn Investment CF Over Five Years](https://japan-equity.com/wp-content/uploads/2026/07/p26_sq-1024x1024.jpg)
![[Obayashi] Green Energy — 44 Plants, 344MW, and the Green Hydrogen Challenge](https://japan-equity.com/wp-content/uploads/2026/07/p21_sq-1024x1024.jpg)
![[Obayashi] Tackling the Labor Shortage — Robotics Construction®](https://japan-equity.com/wp-content/uploads/2026/07/p14_sq-1024x1024.jpg)
