
This article is based on publicly available IR materials and is not a recommendation to buy or sell any specific securities.
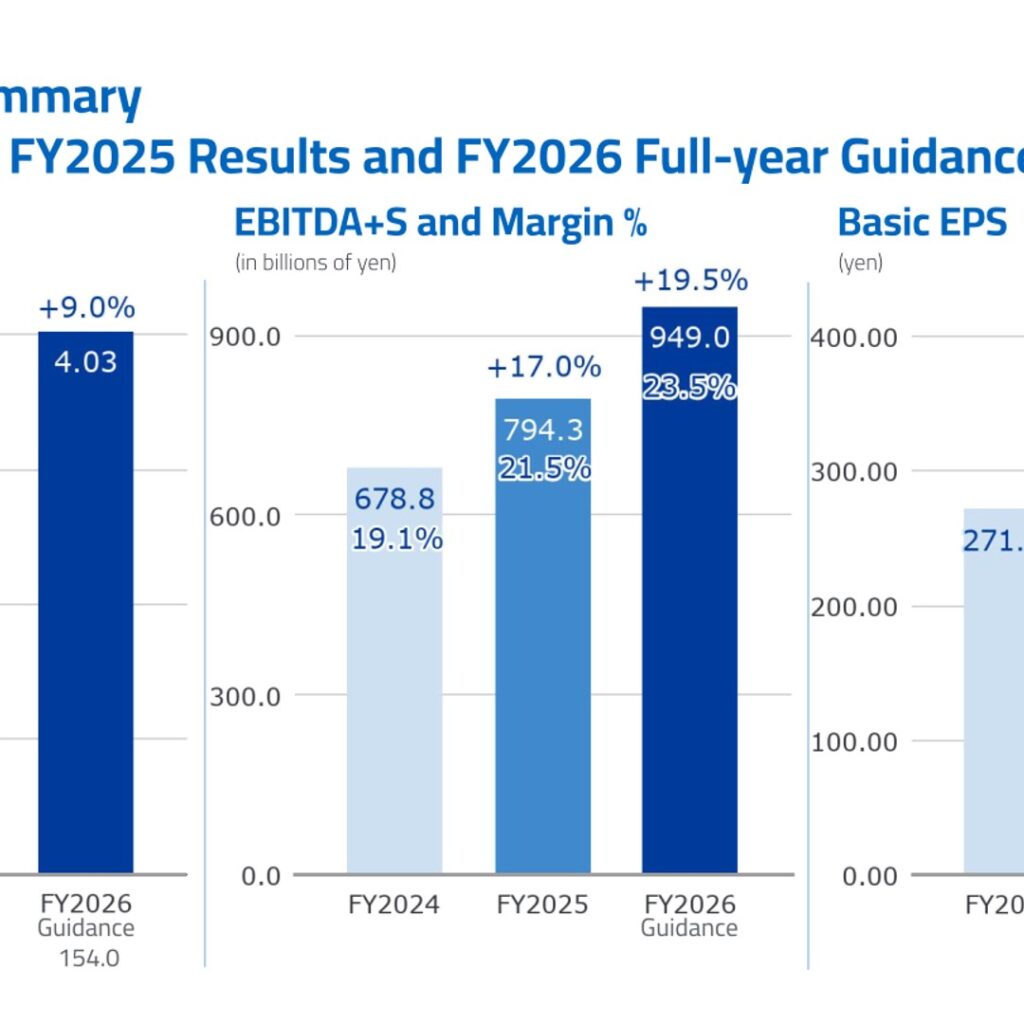
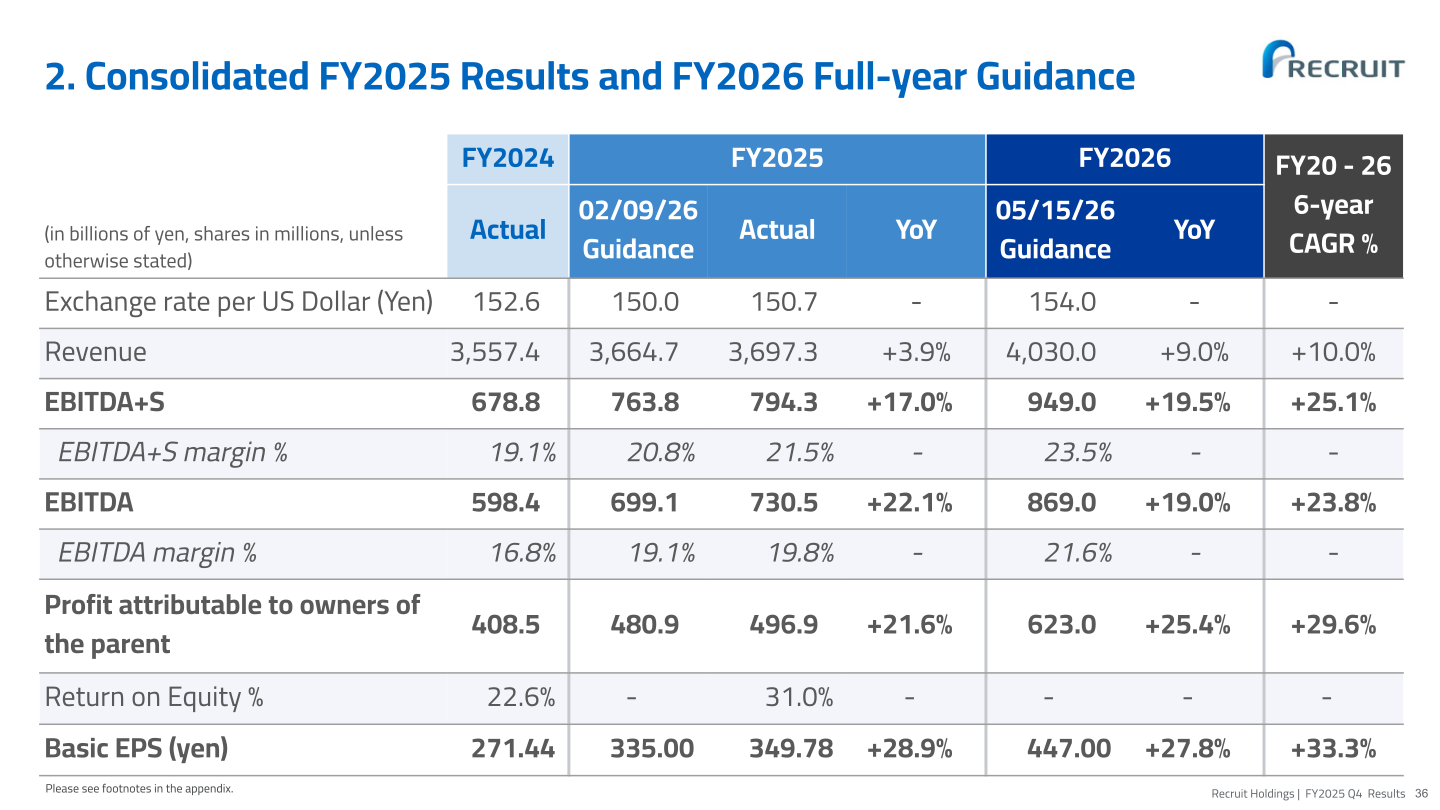
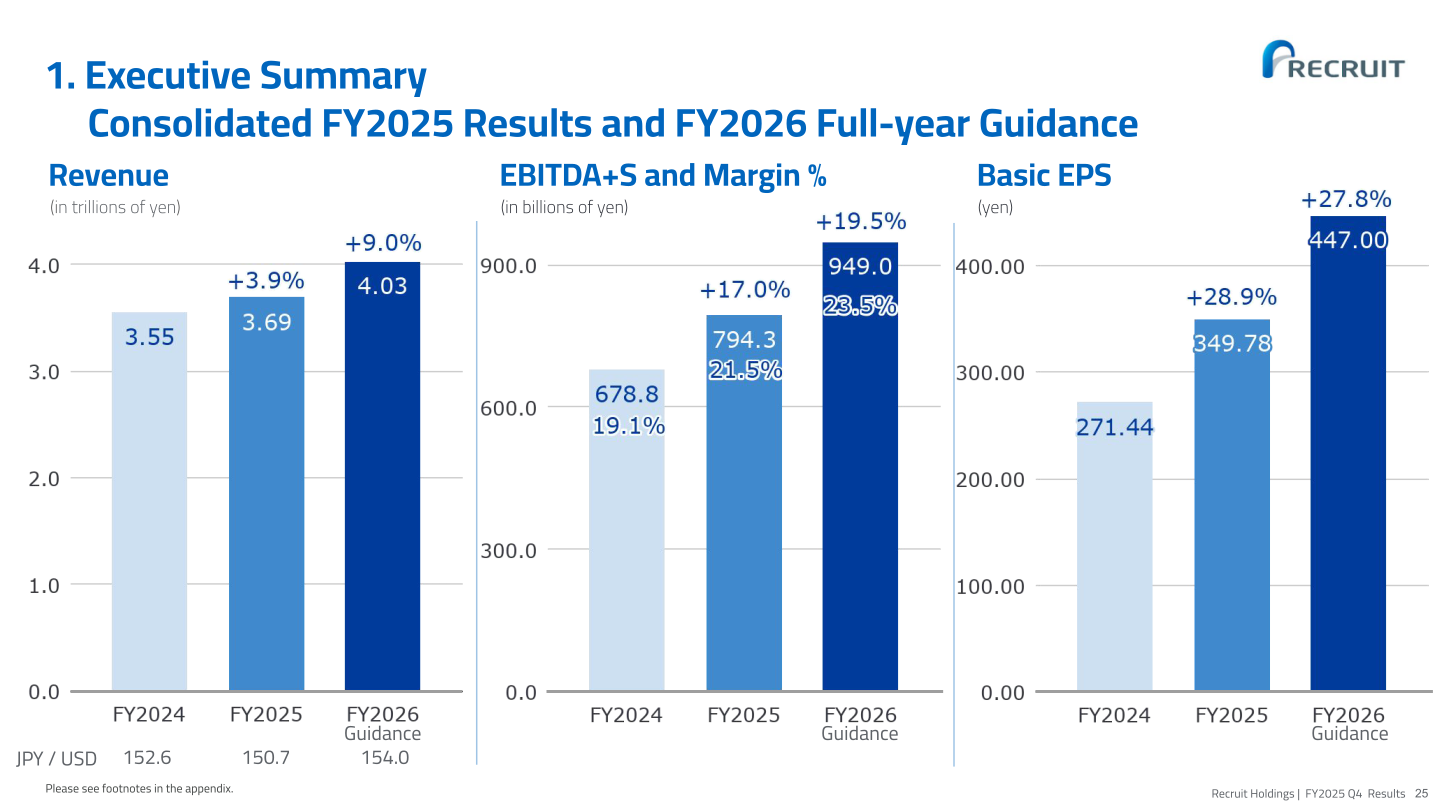
Recruit Holdings Co., Ltd. reported FY2025 full-year consolidated results for the fiscal year from April 1, 2025 to March 31, 2026. Revenue rose 3.9% year on year to 3,697.3 billion yen, EBITDA+S increased 17.0% to 794.3 billion yen with an EBITDA+S margin of 21.5%, and profit attributable to owners of the parent grew 21.6% to 496.9 billion yen. Basic EPS reached 349.78 yen (+28.9% YoY) and return on equity was 31.0%. All three reported figures came in above the company’s February 9, 2026 guidance. For FY2026, Recruit Holdings guides to revenue of 4,030.0 billion yen (+9.0%), EBITDA+S of 949.0 billion yen (+19.5%) and profit attributable to owners of the parent of 623.0 billion yen (+25.4%).
Consolidated Results (Full-Year Actual)
FY2025 revenue was 3,697.3 billion yen, up 3.9% year on year from 3,557.4 billion yen and ahead of the 3,664.7 billion yen guidance issued on February 9, 2026. EBITDA+S rose 17.0% to 794.3 billion yen against guidance of 763.8 billion yen, lifting the EBITDA+S margin to 21.5% from 19.1%; the margin over gross profit improved to 36.3% from 32.6%. EBITDA increased 22.1% to 730.5 billion yen (margin 19.8% versus 16.8%), and profit attributable to owners of the parent rose 21.6% to 496.9 billion yen versus guidance of 480.9 billion yen. Basic EPS was 349.78 yen, up 28.9% year on year and above the 335.00 yen guidance, and return on equity was 31.0% versus 22.6% in FY2024. The average exchange rate was 150.7 yen per US dollar in FY2025 against 152.6 yen in FY2024. On a six-year view (FY2020-FY2026), the company presents CAGRs of +10.0% for revenue, +25.1% for EBITDA+S, +23.8% for EBITDA, +29.6% for profit attributable to owners of the parent and +33.3% for basic EPS.
| Item (in billions of yen) | FY2024 Actual | FY2025 Guidance (02/09/26) | FY2025 Actual | YoY |
|---|---|---|---|---|
| Exchange rate per US Dollar (Yen) | 152.6 | 150.0 | 150.7 | – |
| Revenue | 3,557.4 | 3,664.7 | 3,697.3 | +3.9% |
| EBITDA+S | 678.8 | 763.8 | 794.3 | +17.0% |
| EBITDA+S margin % | 19.1% | 20.8% | 21.5% | – |
| EBITDA | 598.4 | 699.1 | 730.5 | +22.1% |
| EBITDA margin % | 16.8% | 19.1% | 19.8% | – |
| Profit attributable to owners of the parent | 408.5 | 480.9 | 496.9 | +21.6% |
| Return on Equity % | 22.6% | – | 31.0% | – |
| Basic EPS (yen) | 271.44 | 335.00 | 349.78 | +28.9% |
The company also discloses the reconciliation from operating income to EBITDA+S. FY2025 operating income was 630.5 billion yen, up 28.5% year on year from 490.5 billion yen. Deducting other operating income / (expenses), net of (29.9) billion yen gives Non-GAAP operating income of 660.5 billion yen (+25.3% YoY from 526.9 billion yen). Adding depreciation and amortization of 70.0 billion yen produces EBITDA of 730.5 billion yen, and adding share-based payment expenses of 63.8 billion yen produces EBITDA+S of 794.3 billion yen. Gross profit was 2.18 trillion yen (+4.9% YoY), equivalent to 59.2% of revenue, versus 2.08 trillion yen and 58.6% in FY2024.
Segment Results
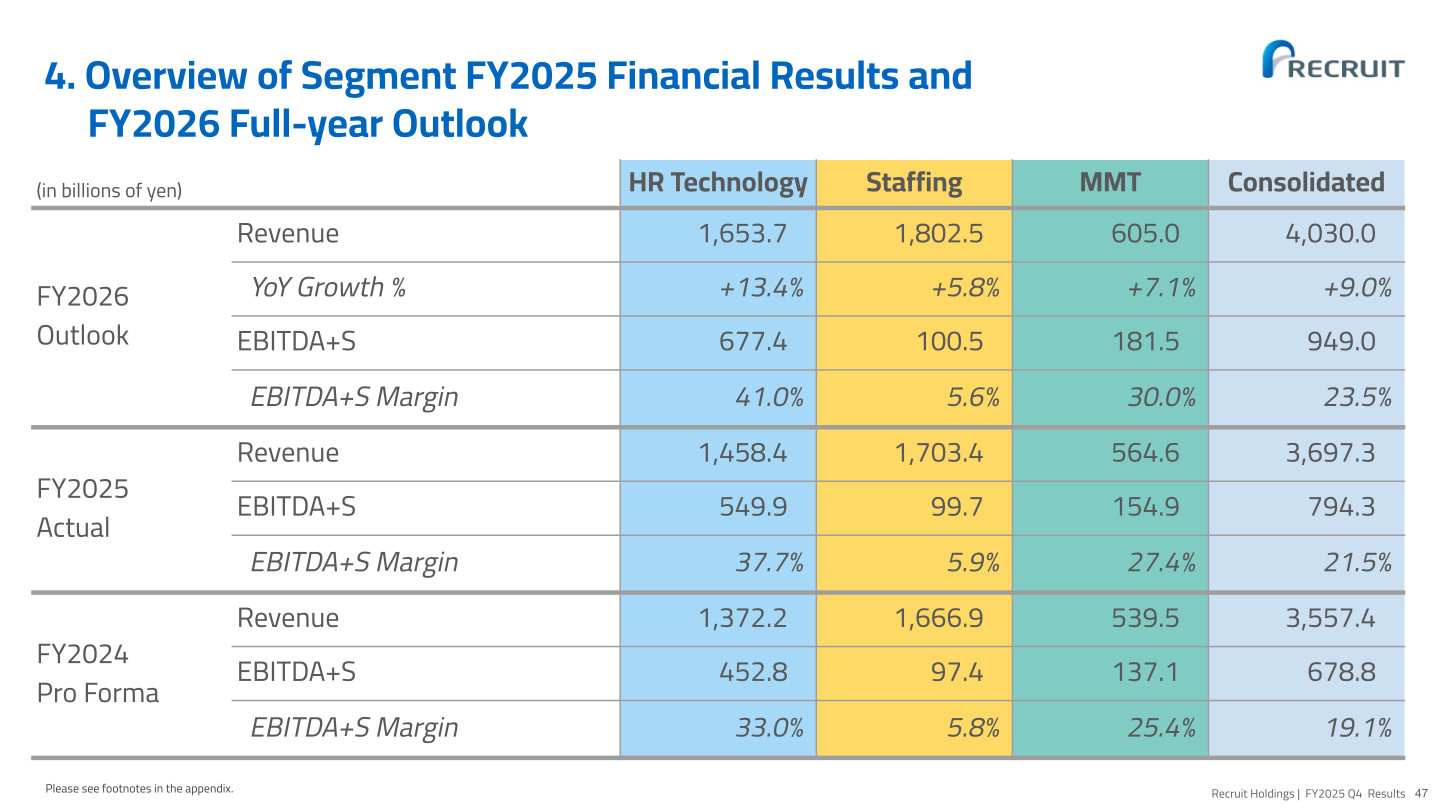
Recruit Holdings reports three segments: HR Technology, Staffing and Matching & Solutions (MMT). FY2025 revenue was 1,458.4 billion yen for HR Technology, 1,703.4 billion yen for Staffing and 564.6 billion yen for MMT, against FY2024 Pro Forma revenue of 1,372.2 billion yen, 1,666.9 billion yen and 539.5 billion yen respectively. EBITDA+S was 549.9 billion yen for HR Technology (margin 37.7%, versus 452.8 billion yen and 33.0% on a FY2024 Pro Forma basis), 99.7 billion yen for Staffing (margin 5.9%, versus 97.4 billion yen and 5.8%) and 154.9 billion yen for MMT (margin 27.4%, versus 137.1 billion yen and 25.4%). HR Technology was therefore the principal driver of the consolidated EBITDA+S margin improvement to 21.5%.
| Segment (in billions of yen) | Metric | FY2024 Pro Forma | FY2025 Actual | FY2026 Outlook |
|---|---|---|---|---|
| HR Technology | Revenue | 1,372.2 | 1,458.4 | 1,653.7 |
| HR Technology | EBITDA+S | 452.8 | 549.9 | 677.4 |
| HR Technology | EBITDA+S Margin | 33.0% | 37.7% | 41.0% |
| Staffing | Revenue | 1,666.9 | 1,703.4 | 1,802.5 |
| Staffing | EBITDA+S | 97.4 | 99.7 | 100.5 |
| Staffing | EBITDA+S Margin | 5.8% | 5.9% | 5.6% |
| MMT | Revenue | 539.5 | 564.6 | 605.0 |
| MMT | EBITDA+S | 137.1 | 154.9 | 181.5 |
| MMT | EBITDA+S Margin | 25.4% | 27.4% | 30.0% |
| Consolidated | Revenue | 3,557.4 | 3,697.3 | 4,030.0 |
| Consolidated | EBITDA+S | 678.8 | 794.3 | 949.0 |
| Consolidated | EBITDA+S Margin | 19.1% | 21.5% | 23.5% |
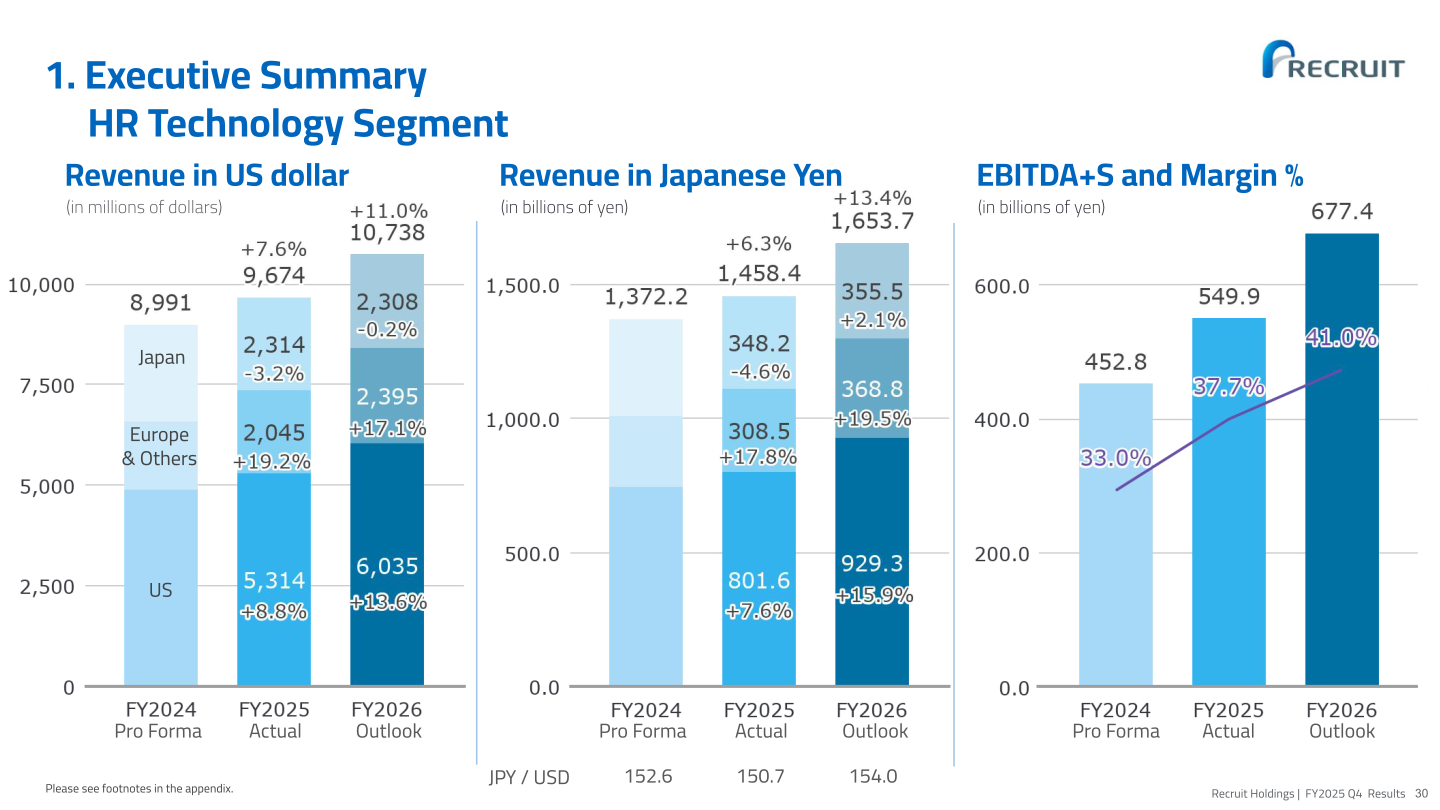
HR Technology segment revenue in US dollar terms was 9,674 million dollars in FY2025, up 7.6% from 8,991 million dollars on a FY2024 Pro Forma basis. By region, the US contributed 5,314 million dollars (+8.8%), Europe & Others 2,045 million dollars (+19.2%) and Japan 2,314 million dollars (-3.2%). In yen terms, segment revenue of 1,458.4 billion yen (+6.3%) comprised 801.6 billion yen from the US (+7.6%), 308.5 billion yen from Europe & Others (+17.8%) and 348.2 billion yen from Japan (-4.6%), at an assumed rate of 150.7 yen per US dollar versus 152.6 yen in FY2024.
Staffing segment revenue of 1,703.4 billion yen (+2.2% YoY) was split between Japan at 846.8 billion yen (+5.2%) and Europe, US and Australia at 856.5 billion yen (-0.6%). Segment EBITDA+S rose 2.4% to 99.7 billion yen with a margin of 5.9%, compared with 97.4 billion yen and 5.8% in FY2024 and 102.2 billion yen and 6.5% in FY2022.
MMT segment revenue of 564.6 billion yen (+4.7% versus FY2024 Pro Forma) comprised Lifestyle (Beauty, Dining, Travel, SaaS) at 293.8 billion yen (+6.6%), Housing & Real Estate at 156.9 billion yen (+4.5%) and Others at 113.8 billion yen (+0.2%). Segment EBITDA+S rose 13.0% to 154.9 billion yen with a margin of 27.4%. On a semi-annual basis, MMT EBITDA+S was 89.7 billion yen in 1H FY2025 (margin 31.9%) and 65.1 billion yen in 2H FY2025 (margin 23.0%).
FY2026 Forecast
For FY2026, the fiscal year from April 1, 2026 to March 31, 2027, the guidance announced on May 15, 2026 calls for revenue of 4,030.0 billion yen (+9.0% YoY), EBITDA+S of 949.0 billion yen (+19.5%) with a margin of 23.5%, EBITDA of 869.0 billion yen (+19.0%) with a margin of 21.6%, operating income of 787.0 billion yen (+24.8%), profit attributable to owners of the parent of 623.0 billion yen (+25.4%) and basic EPS of 447.00 yen (+27.8%). The guidance assumes an exchange rate of 154.0 yen per US dollar. By segment, revenue guidance is 1,653.7 billion yen for HR Technology (+13.4%), 1,802.5 billion yen for Staffing (+5.8%) and 605.0 billion yen for MMT (+7.1%), with EBITDA+S of 677.4 billion yen (margin 41.0%), 100.5 billion yen (margin 5.6%) and 181.5 billion yen (margin 30.0%) respectively. Within HR Technology, FY2026 revenue in US dollars is expected at 10,738 million dollars (+11.0%), comprising 6,035 million dollars in the US (+13.6%), 2,395 million dollars in Europe & Others (+17.1%) and 2,308 million dollars in Japan (-0.2%).
| Item (in billions of yen) | FY2025 Actual | FY2026 Guidance (05/15/26) | YoY |
|---|---|---|---|
| Exchange rate per US Dollar (Yen) | 150.7 | 154.0 | – |
| Revenue | 3,697.3 | 4,030.0 | +9.0% |
| EBITDA+S | 794.3 | 949.0 | +19.5% |
| EBITDA+S margin % | 21.5% | 23.5% | – |
| EBITDA | 730.5 | 869.0 | +19.0% |
| EBITDA margin % | 19.8% | 21.6% | – |
| Operating income | 630.5 | 787.0 | +24.8% |
| Profit attributable to owners of the parent | 496.9 | 623.0 | +25.4% |
| Basic EPS (yen) | 349.78 | 447.00 | +27.8% |
| Dividends per share (yen) | 25.00 | 26.00 | – |
Shareholder Returns
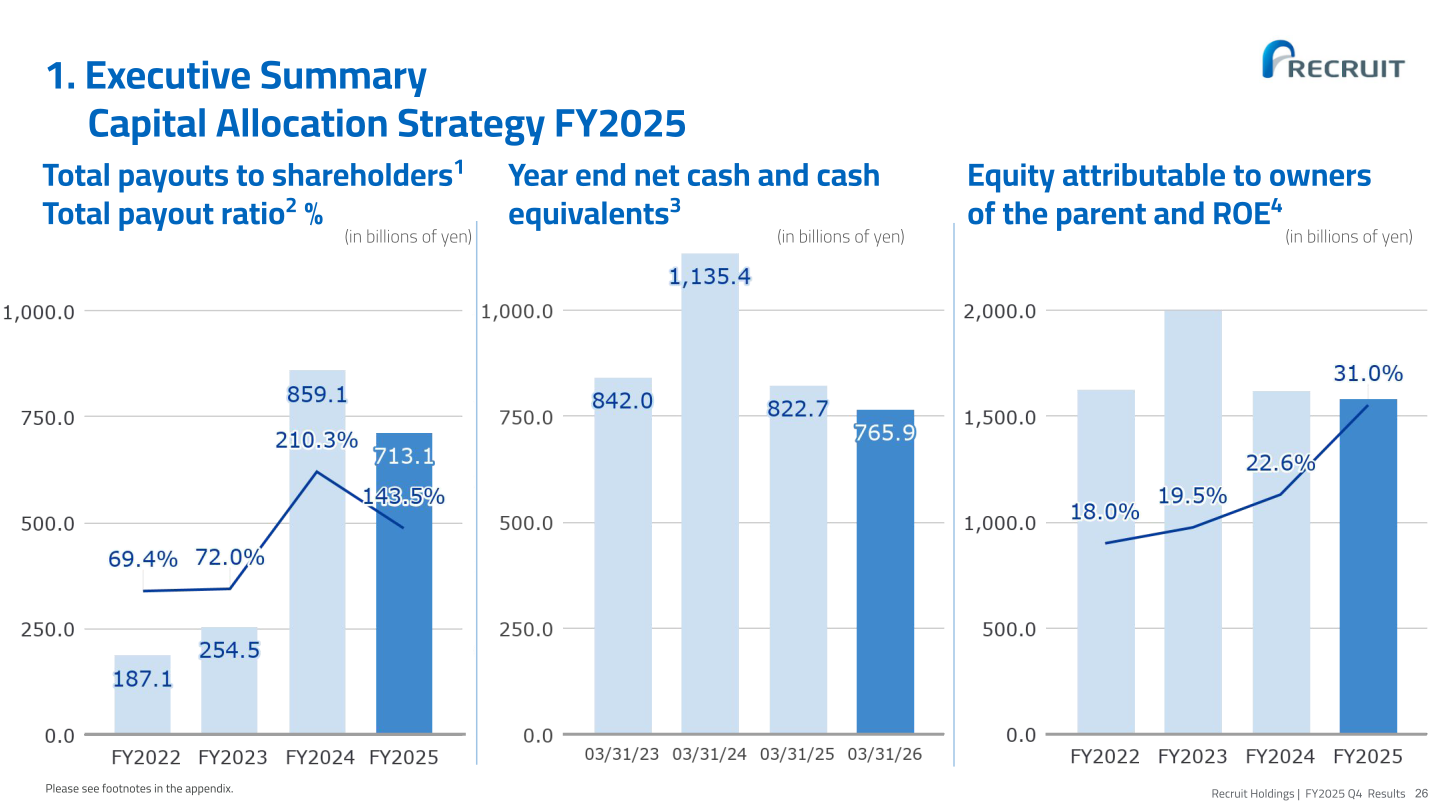
Dividends per share were 25.00 yen for FY2025, and the company plans 26.00 yen for FY2026, split between 13.0 yen for the first half and 13.0 yen for the second half. Total payouts to shareholders were 713.1 billion yen in FY2025, down 146.0 billion yen from 859.1 billion yen in FY2024, with the total payout ratio at 143.5% versus 210.3%. The number of issued shares net of treasury stock declined by 70.5 million to 1,396.2 million as of March 31, 2026, from 1,466.7 million a year earlier; total shares outstanding net of treasury stock fell to 1.39 billion from 1.46 billion. Gross cash and cash equivalents ended FY2025 at 767.9 billion yen (down 55.8 billion yen) and net cash and cash equivalents at 765.9 billion yen (down 56.8 billion yen). Return on equity improved to 31.0% in FY2025 from 22.6% in FY2024, 19.5% in FY2023 and 18.0% in FY2022.
| Item (in billions of yen, shares in millions) | FY2024 | FY2025 | Variance |
|---|---|---|---|
| Total payouts to shareholders | 859.1 | 713.1 | (146.0) |
| Total payout ratio % | 210.3% | 143.5% | – |
| Gross cash and cash equivalents | 823.8 | 767.9 | (55.8) |
| Net cash and cash equivalents | 822.7 | 765.9 | (56.8) |
| Number of issued shares, Net | 1,466.7 | 1,396.2 | (70.5) |
Capital Allocation Strategy FY2026 – FY2028
Recruit Holdings states that its capital allocation policy remains unchanged for FY2026 through FY2028. The four stated priorities are: investments for continuous growth of existing businesses; dividends per share for FY2026 totaling 26.0 yen (1H 13.0 yen and 2H 13.0 yen); strategic M&A focused on HR Technology; and a share repurchase program of 350 billion yen that has been ongoing since April 1, 2026. The company also intends to maintain approximately 750 billion yen of gross cash and cash equivalents at fiscal year ends.
Mid-term Growth Ambition
For the HR Technology segment, the company presents a mid-term growth ambition of revenue year-on-year growth of 10%+, rising to 20%+ when hiring demand recovers, together with an EBITDA+S margin of 50%+.
Balance Sheet
As of March 31, 2026, total assets were 2,789.0 billion yen (up 16.7 billion yen from a year earlier), including cash and cash equivalents of 725.5 billion yen. Total liabilities were 1,194.4 billion yen (up 49.5 billion yen) and total equity was 1,594.5 billion yen (down 32.8 billion yen), of which total equity attributable to owners of the parent was 1,583.3 billion yen. The number of issued shares was 1,472.5 million with total treasury stock of 76.2 million.
This article is an analysis based on publicly available information and is not a recommendation to buy or sell any specific securities. Investment decisions are your own responsibility.
![[Obayashi] Investors’ Guide 2026 — The Complete 24-Article Breakdown](https://japan-equity.com/wp-content/uploads/2026/07/hub_cover-1024x1024.png)
![[Obayashi] IR & SR Policy — Feeding Dialogue Back into Management](https://japan-equity.com/wp-content/uploads/2026/07/p32_sq-1024x1024.jpg)
![[Obayashi] Real Estate Development — 18.7% Margin, ¥287.7bn Unrealized Gains](https://japan-equity.com/wp-content/uploads/2026/07/p20_sq-1024x1024.jpg)
![[Obayashi] Domestic Civil Engineering — Resilience Spending Supports 9.6% Margin](https://japan-equity.com/wp-content/uploads/2026/07/p11_sq-1024x1024.jpg)
![[Obayashi] Share Price & External Ratings — vs TOPIX, ESG Index Inclusion](https://japan-equity.com/wp-content/uploads/2026/07/p40_sq-1024x1024.jpg)
![[Construction] ¥75.5tn Investment, Shrinking Workforce — Big-5 Market Share](https://japan-equity.com/wp-content/uploads/2026/07/p12_sq-1024x1024.jpg)



![[Obayashi] Capital Policy & Shareholder Returns — ROE 10%+, DOE ~5%, ¥100bn Buyback](https://japan-equity.com/wp-content/uploads/2026/07/p27_sq-1024x1024.jpg)
![[Obayashi] Reducing Cross-Shareholdings — ¥285.2bn Sold in Five Years](https://japan-equity.com/wp-content/uploads/2026/07/p29_sq-1024x1024.jpg)
![[Obayashi] ¥750bn Investment Plan — ¥300bn to Development, ¥190bn to Tech/DX](https://japan-equity.com/wp-content/uploads/2026/07/p30_sq-1024x1024.jpg)
![[Obayashi] MTP2022 KPIs — Operating Profit ~2x Target, ROE 14.4%](https://japan-equity.com/wp-content/uploads/2026/07/p25_sq-1024x1024.jpg)
![[Obayashi] Cash Allocation — ¥420bn Investment CF Over Five Years](https://japan-equity.com/wp-content/uploads/2026/07/p26_sq-1024x1024.jpg)
![[Obayashi] Green Energy — 44 Plants, 344MW, and the Green Hydrogen Challenge](https://japan-equity.com/wp-content/uploads/2026/07/p21_sq-1024x1024.jpg)
![[Obayashi] Tackling the Labor Shortage — Robotics Construction®](https://japan-equity.com/wp-content/uploads/2026/07/p14_sq-1024x1024.jpg)
