
This article is based on publicly available IR materials and is not a recommendation to buy or sell any specific securities.
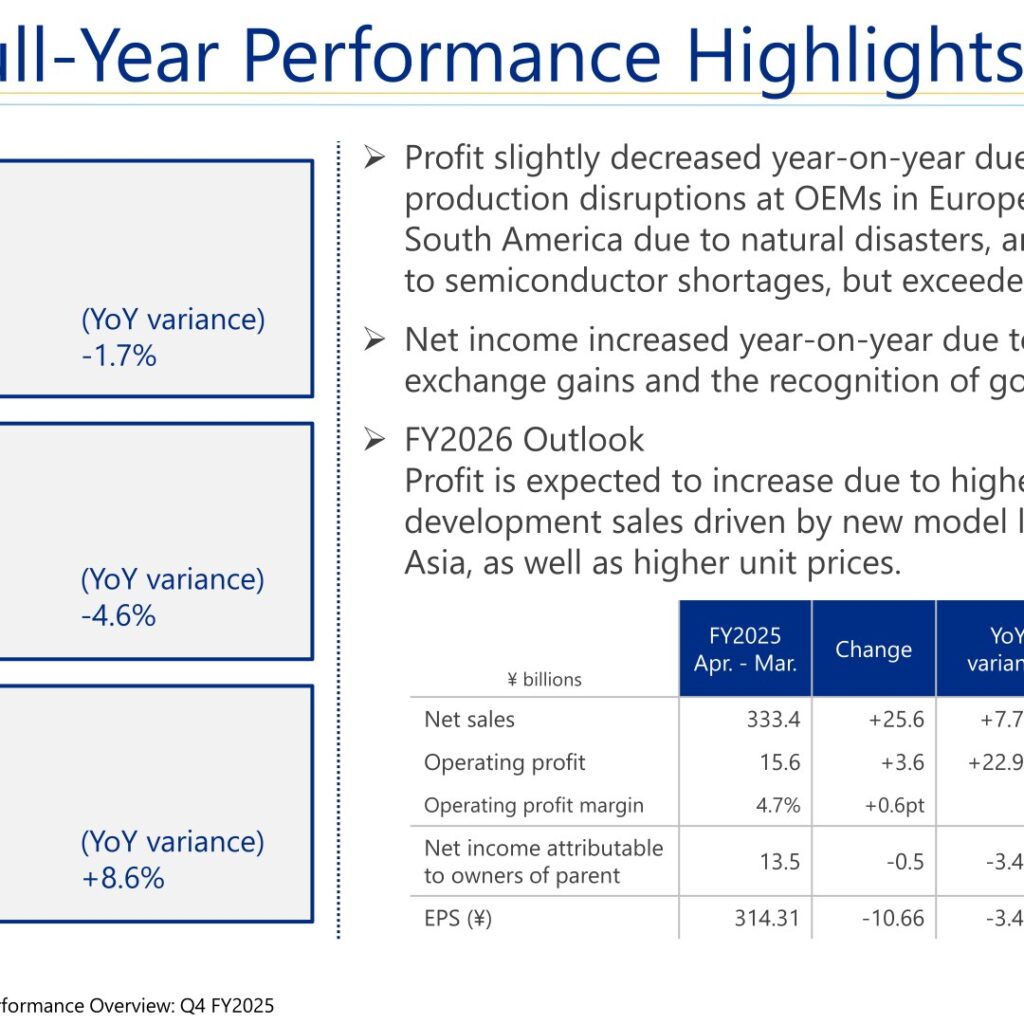
G-TEKT reported FY2025 (April 1, 2025 – March 31, 2026) net sales of ¥333.4 billion, down 1.7% year on year, and operating profit of ¥15.6 billion, down 4.6%. The company said profit slightly decreased year-on-year due to factors such as production disruptions at OEMs in Europe due to cyberattacks, in South America due to natural disasters, and in North America due to semiconductor shortages, but exceeded the plan. Net income attributable to owners of parent rose 8.2% to ¥13.5 billion, which the company attributed to factors such as foreign exchange gains and the recognition of government grant income. For FY2026 the company forecasts net sales of ¥359.0 billion and operating profit of ¥19.2 billion.
Consolidated Results (Full-Year Actual)
Net sales fell ¥5.8 billion year on year to ¥333.4 billion and operating profit fell ¥0.8 billion to ¥15.6 billion, with the operating profit margin at 4.7%, down 0.1pt. Net income attributable to owners of parent increased ¥1.1 billion to ¥13.5 billion and EPS rose ¥24.92 to ¥314.31. Currency effects were +¥2.0 billion on net sales, +¥0.2 billion on operating profit and +¥0.2 billion on net income.
| Item (¥ billions) | FY2024 Apr. – Mar. | Change | YoY variance | FY2025 Apr. – Mar. | Currency effects |
|---|---|---|---|---|---|
| Net sales | 339.2 | -5.8 | -1.7% | 333.4 | +2.0 |
| Operating profit | 16.4 | -0.8 | -4.6% | 15.6 | +0.2 |
| Operating profit margin | 4.8% | -0.1pt | – | 4.7% | – |
| Net income attributable to owners of parent | 12.4 | +1.1 | +8.2% | 13.5 | +0.2 |
| EPS (¥) | 289.39 | +24.92 | +8.6% | 314.31 | – |
On a fourth-quarter basis (January – March), net sales rose 17.1% year on year to ¥99.0 billion, operating profit rose 50.7% to ¥8.2 billion with an 8.3% margin, and net income attributable to owners of parent rose 103.5% to ¥7.2 billion, with EPS of ¥167.37.
Factors Affecting Operating Profit
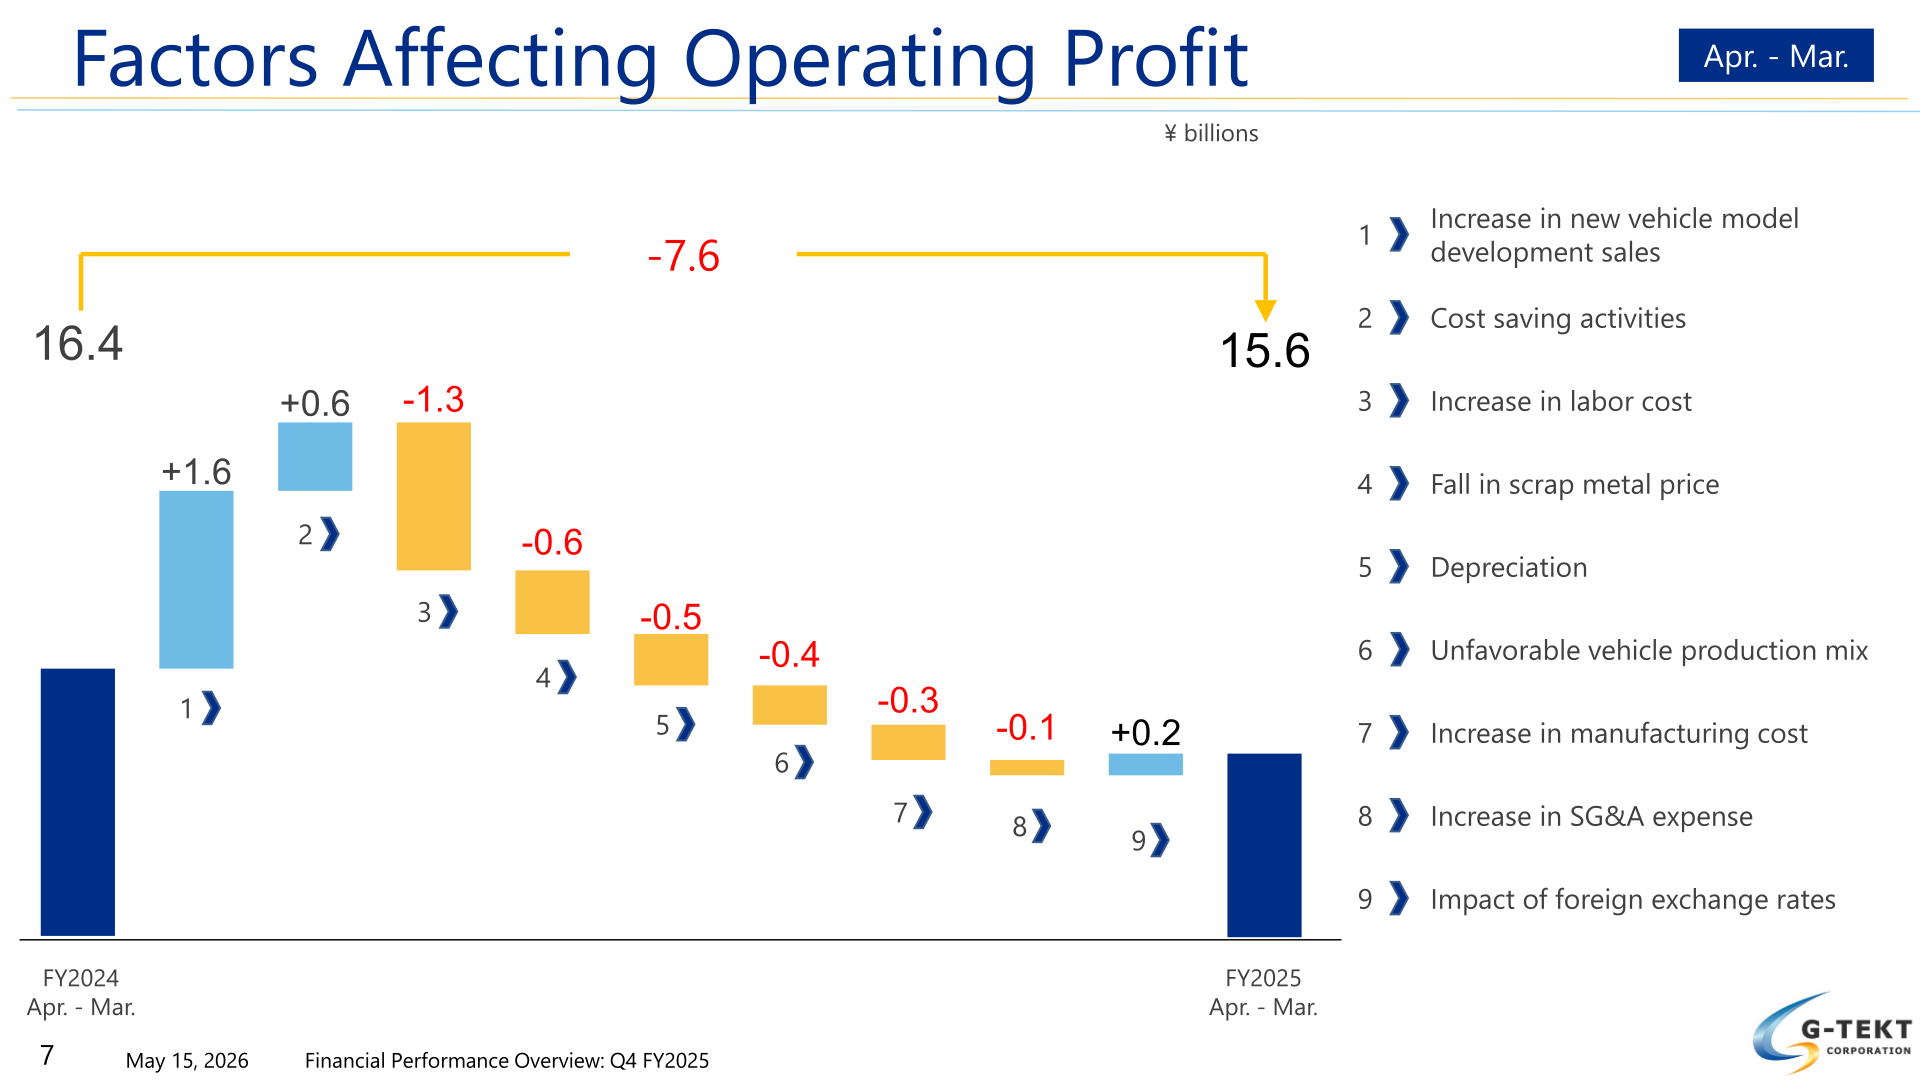
The company bridged operating profit from ¥16.4 billion in FY2024 to ¥15.6 billion in FY2025 with the following items, in ¥ billions: an increase in new vehicle model development sales (+1.6), cost saving activities (+0.6), an increase in labor cost (-1.3), a fall in scrap metal price (-0.6), depreciation (-0.5), an unfavorable vehicle production mix (-0.4), an increase in manufacturing cost (-0.3), an increase in SG&A expense (-0.1) and the impact of foreign exchange rates (+0.2).
Net Sales by Business Type and Customer
Auto body components, the largest category, declined 3.2% to ¥295.3 billion, or 88.6% of the total, while new vehicle model development sales grew 25.9% to ¥30.2 billion, or 9.1%. Transmission parts fell 7.2% to ¥7.7 billion. EV-related net sales rose 72.6% to ¥19.4 billion, equal to 5.8% of net sales versus 3.3% a year earlier. In the materials, “mass production” sales means sales of assembly and transmission parts, and “new vehicle model development” sales means sales of equipment, die and new model prototype.
| Item (¥ billions) | FY2024 Net sales | FY2024 Ratio | FY2025 Net sales | FY2025 Ratio | YoY variance |
|---|---|---|---|---|---|
| Auto body components | 304.9 | 89.9% | 295.3 | 88.6% | -3.2% |
| New vehicle model development | 24.0 | 7.1% | 30.2 | 9.1% | +25.9% |
| Transmission parts | 8.3 | 2.5% | 7.7 | 2.3% | -7.2% |
| Other | 2.0 | 0.6% | 0.2 | 0.0% | -92.3% |
| Total | 339.2 | – | 333.4 | – | -1.7% |
| EV-related Net Sales | 11.3 | 3.3% | 19.4 | 5.8% | +72.6% |
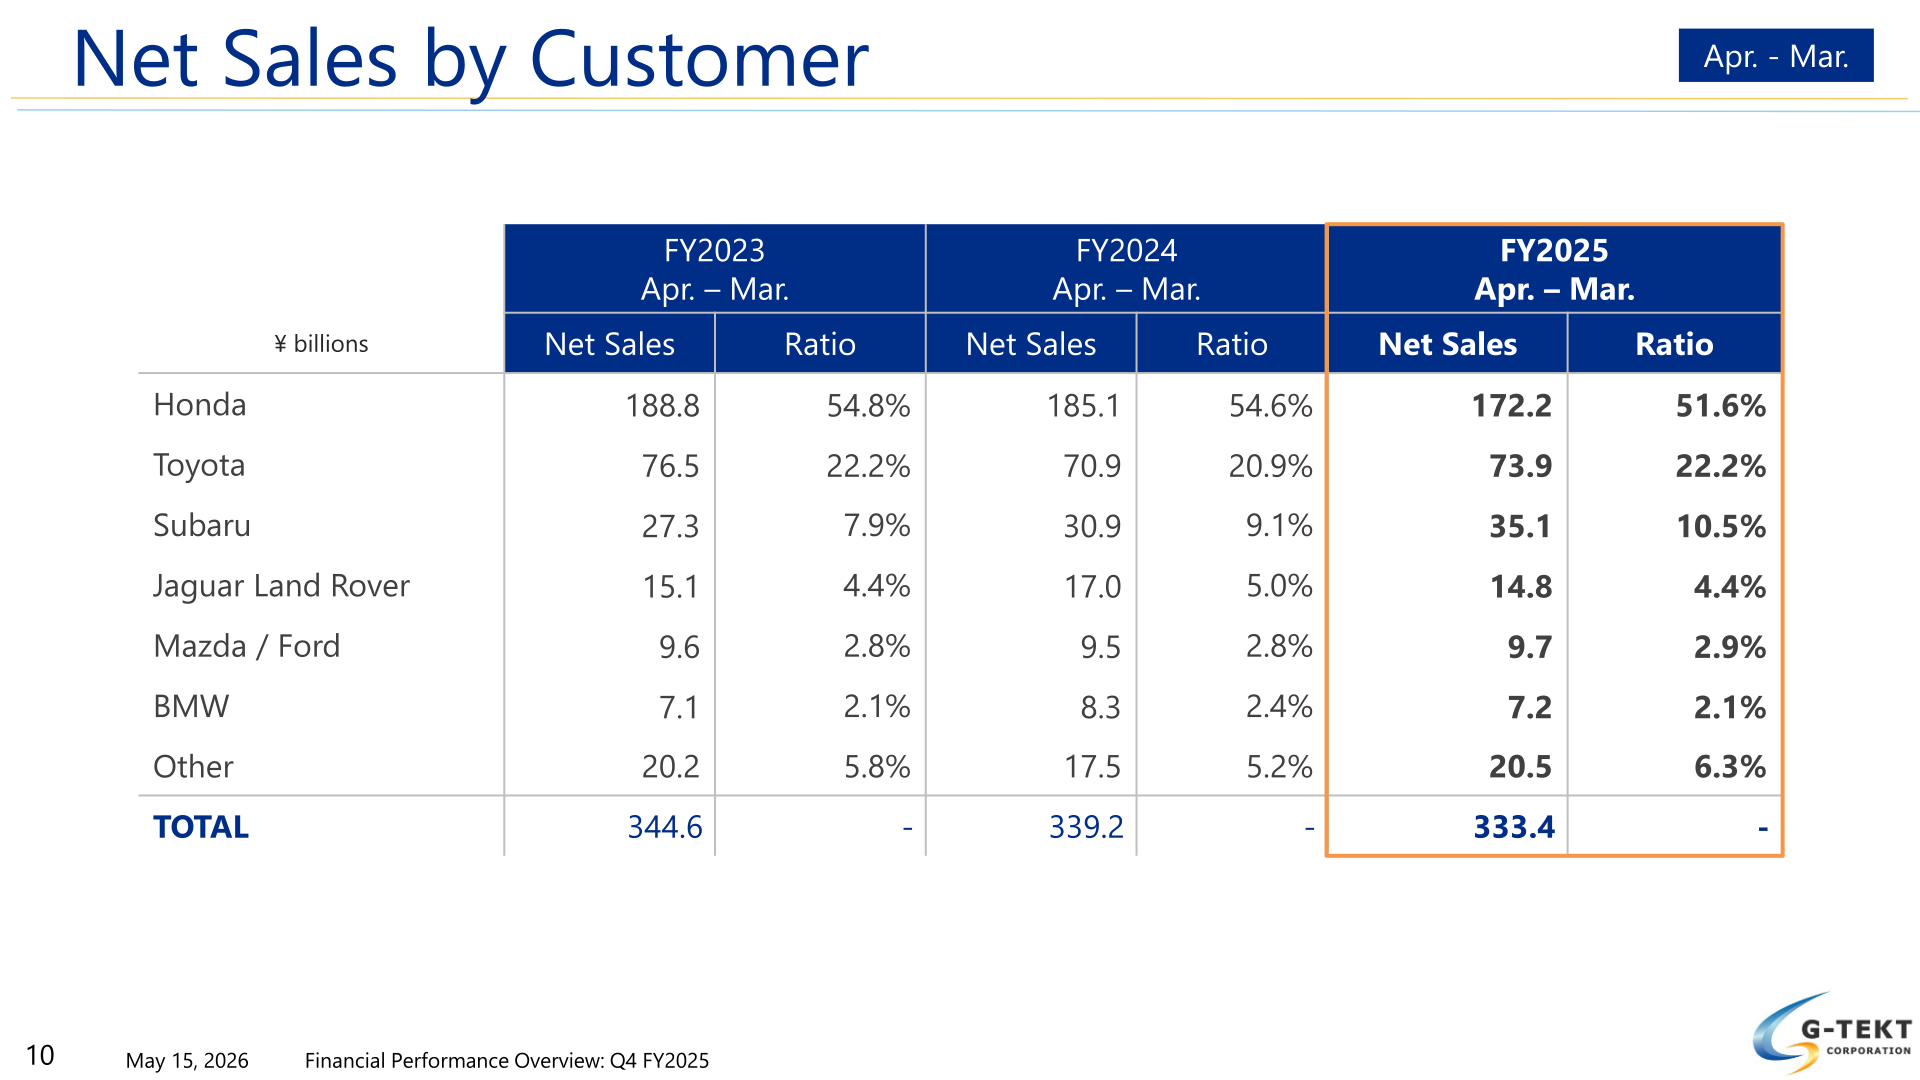
By customer, Honda accounted for ¥172.2 billion or 51.6% of net sales, down from ¥185.1 billion and 54.6% in FY2024. Toyota contributed ¥73.9 billion or 22.2%, Subaru ¥35.1 billion or 10.5%, Jaguar Land Rover ¥14.8 billion or 4.4%, Mazda / Ford ¥9.7 billion or 2.9%, BMW ¥7.2 billion or 2.1%, and other customers ¥20.5 billion or 6.3%.
Segment Results
Japan posted the largest gain, with net sales up 10.2% to ¥76.0 billion and operating profit up 29.8% to ¥7.36 billion on higher mass production by major customers and higher new vehicle model development sales. North America grew net sales 1.0% to ¥127.0 billion and operating profit 7.5% to ¥5.40 billion, as higher new vehicle model development sales including molds and prototyping offset lower production volumes at major clients. Europe saw net sales fall 2.5% to ¥36.6 billion and operating profit fall 24.4% to ¥2.18 billion on lower customer production volumes and higher labor costs. Asia was broadly flat on sales at ¥40.2 billion with operating profit up 2.4% to ¥1.61 billion. China recorded net sales down 7.9% to ¥53.2 billion and an operating loss of ¥0.95 billion, as the sales decline outweighed efforts to control labor costs and reduce expenses. South America lifted net sales 1.1% to ¥18.3 billion but operating profit fell 46.2% to ¥0.67 billion. The materials note that the equity-method affiliate G-ONE AUTO PARTS DE MEXICO, S.A. DE C.V. is excluded from the North America segment.
| Segment | Metric (¥ billions) | FY2024 Apr. – Mar. | FY2025 Apr. – Mar. | YoY variance | Currency effects |
|---|---|---|---|---|---|
| Japan | Net Sales | 68.9 | 76.0 | 10.2% | – |
| Japan | Operating Profit | 5.67 | 7.36 | 29.8% | – |
| North America (the U.S., Canada, Mexico) | Net Sales | 125.8 | 127.0 | 1.0% | -1.3 |
| North America (the U.S., Canada, Mexico) | Operating Profit | 5.03 | 5.40 | 7.5% | 0.02 |
| Europe (the U.K., Slovakia) | Net Sales | 37.5 | 36.6 | -2.5% | 1.0 |
| Europe (the U.K., Slovakia) | Operating Profit | 2.89 | 2.18 | -24.4% | 0.11 |
| Asia (Thailand, India, Indonesia) | Net Sales | 40.3 | 40.2 | -0.1% | 1.7 |
| Asia (Thailand, India, Indonesia) | Operating Profit | 1.57 | 1.61 | 2.4% | 0.08 |
| China | Net Sales | 57.8 | 53.2 | -7.9% | 0.3 |
| China | Operating Profit | -0.15 | -0.95 | – | 0.05 |
| South America (Brazil) | Net Sales | 18.1 | 18.3 | 1.1% | 0.3 |
| South America (Brazil) | Operating Profit | 1.24 | 0.67 | -46.2% | -0.03 |
Cash Flow and Capital Expenditure
Cash and cash equivalents rose from ¥31.2 billion at March 31, 2025 to ¥37.3 billion at March 31, 2026, with operating cash flow of ¥35.1 billion, investing cash flow of -¥37.4 billion, financing cash flow of ¥6.1 billion and other of ¥2.3 billion. Key factors cited were profit before income taxes of ¥19.0 billion and depreciation of ¥18.9 billion within operating cash flow, purchase of property, plant and equipment of -¥40.2 billion and payments into time deposits of ¥2.4 billion within investing cash flow, and a net increase in borrowings of ¥10.7 billion within financing cash flow.
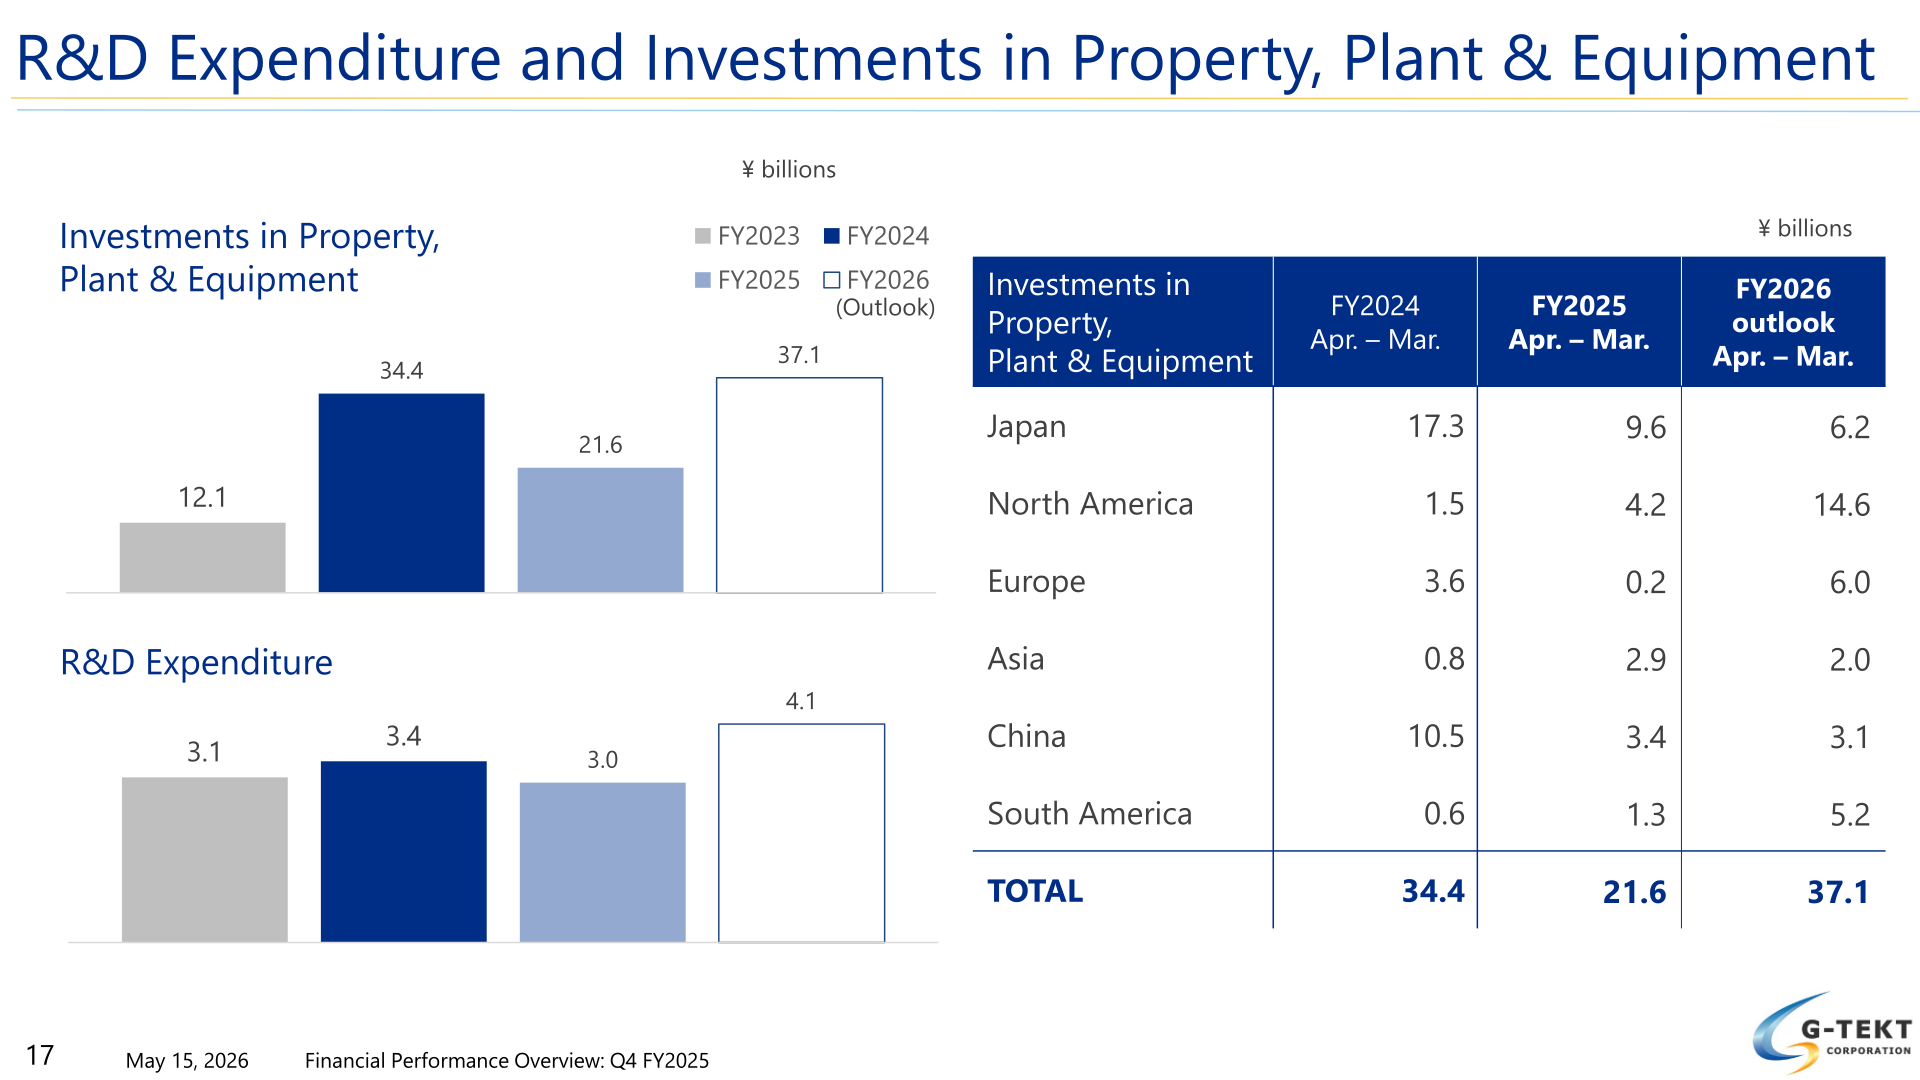
Investments in property, plant and equipment totaled ¥21.6 billion in FY2025, down from ¥34.4 billion in FY2024, and are planned at ¥37.1 billion in FY2026, with North America rising to ¥14.6 billion from ¥4.2 billion. R&D expenditure was ¥3.0 billion in FY2025 against ¥3.4 billion in FY2024, with ¥4.1 billion planned for FY2026.
FY2026 Forecast
For FY2026 the company forecasts net sales of ¥359.0 billion, up 7.7%, operating profit of ¥19.2 billion, up 22.9%, with a 5.3% margin, net income attributable to owners of parent of ¥13.0 billion, down 3.4%, and EPS of ¥303.65. Currency effects are assumed at -¥2.7 billion on net sales and -¥0.1 billion on operating profit. The company said profit is expected to increase due to higher new vehicle model development sales driven by new model launches in Europe and Asia, as well as higher unit prices.
| Item (¥ billions) | FY2025 Apr. – Mar. | Change | YoY variance | FY2026 Outlook Apr. – Mar. | Currency effects |
|---|---|---|---|---|---|
| Net sales | 333.4 | +25.6 | +7.7% | 359.0 | -2.7 |
| Operating profit | 15.6 | +3.6 | +22.9% | 19.2 | -0.1 |
| Operating profit margin | 4.7% | +0.6pt | – | 5.3% | – |
| Net income attributable to owners of parent | 13.5 | -0.5 | -3.4% | 13.0 | -0.1 |
| EPS (¥) | 314.31 | -10.66 | -3.4% | 303.65 | – |
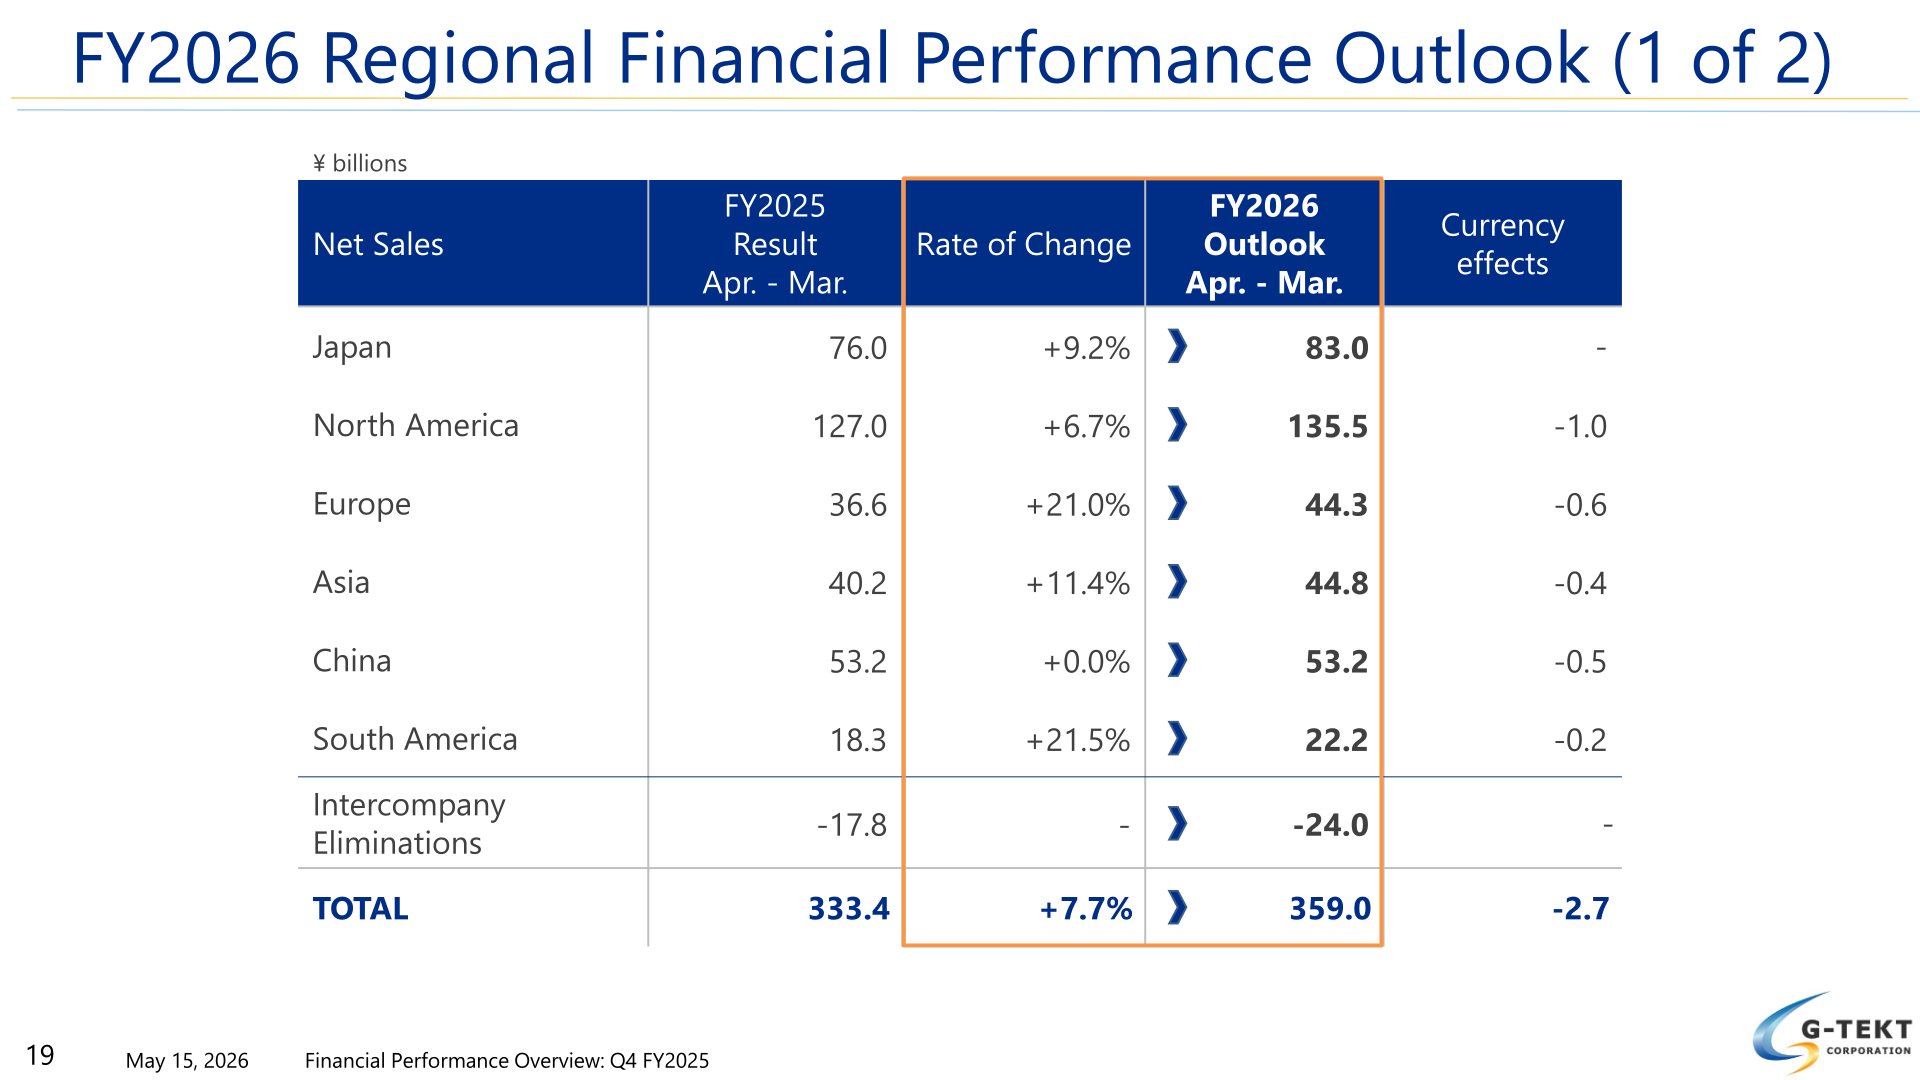
By region, every segment is guided higher on sales except China, which is held flat at ¥53.2 billion but is expected to return to an operating profit of ¥0.40 billion from an operating loss of ¥0.95 billion. Europe, at +21.0%, and South America, at +21.5%, show the largest planned sales growth.
| Region (¥ billions) | Net Sales FY2025 Result | Net Sales FY2026 Outlook | Operating Profit FY2025 Result | Operating Profit FY2026 Outlook |
|---|---|---|---|---|
| Japan | 76.0 | 83.0 | 7.36 | 7.97 |
| North America | 127.0 | 135.5 | 5.40 | 7.00 |
| Europe | 36.6 | 44.3 | 2.18 | 3.09 |
| Asia | 40.2 | 44.8 | 1.61 | 1.99 |
| China | 53.2 | 53.2 | -0.95 | 0.40 |
| South America | 18.3 | 22.2 | 0.67 | 1.09 |
| Intercompany Eliminations | -17.8 | -24.0 | -0.64 | -2.34 |
| TOTAL | 333.4 | 359.0 | 15.62 | 19.20 |
Shareholder Returns
This cannot be confirmed from the materials. The presentation does not include dividend or share repurchase information.
Currency Assumptions
Weighted average rates in FY2025 were ¥150.79 per US dollar, a change of -1.2% year on year, ¥202.11 per UK pound sterling (3.8%), ¥174.81 per euro (6.7%), ¥4.67 per Thai baht (6.6%), ¥1.71 per Indian rupee (-5.5%), ¥0.0091 per Indonesian rupiah (-4.2%), ¥21.24 per Chinese yuan renminbi (0.6%) and ¥27.73 per Brazilian real (1.7%).
This article is an analysis based on publicly available information and is not a recommendation to buy or sell any specific securities. Investment decisions are your own responsibility.
![[Obayashi] Investors’ Guide 2026 — The Complete 24-Article Breakdown](https://japan-equity.com/wp-content/uploads/2026/07/hub_cover-1024x1024.png)
![[Obayashi] IR & SR Policy — Feeding Dialogue Back into Management](https://japan-equity.com/wp-content/uploads/2026/07/p32_sq-1024x1024.jpg)
![[Obayashi] Real Estate Development — 18.7% Margin, ¥287.7bn Unrealized Gains](https://japan-equity.com/wp-content/uploads/2026/07/p20_sq-1024x1024.jpg)
![[Obayashi] Domestic Civil Engineering — Resilience Spending Supports 9.6% Margin](https://japan-equity.com/wp-content/uploads/2026/07/p11_sq-1024x1024.jpg)
![[Obayashi] Share Price & External Ratings — vs TOPIX, ESG Index Inclusion](https://japan-equity.com/wp-content/uploads/2026/07/p40_sq-1024x1024.jpg)
![[Construction] ¥75.5tn Investment, Shrinking Workforce — Big-5 Market Share](https://japan-equity.com/wp-content/uploads/2026/07/p12_sq-1024x1024.jpg)



![[Obayashi] Capital Policy & Shareholder Returns — ROE 10%+, DOE ~5%, ¥100bn Buyback](https://japan-equity.com/wp-content/uploads/2026/07/p27_sq-1024x1024.jpg)
![[Obayashi] Reducing Cross-Shareholdings — ¥285.2bn Sold in Five Years](https://japan-equity.com/wp-content/uploads/2026/07/p29_sq-1024x1024.jpg)
![[Obayashi] ¥750bn Investment Plan — ¥300bn to Development, ¥190bn to Tech/DX](https://japan-equity.com/wp-content/uploads/2026/07/p30_sq-1024x1024.jpg)
![[Obayashi] MTP2022 KPIs — Operating Profit ~2x Target, ROE 14.4%](https://japan-equity.com/wp-content/uploads/2026/07/p25_sq-1024x1024.jpg)
![[Obayashi] Cash Allocation — ¥420bn Investment CF Over Five Years](https://japan-equity.com/wp-content/uploads/2026/07/p26_sq-1024x1024.jpg)
![[Obayashi] Green Energy — 44 Plants, 344MW, and the Green Hydrogen Challenge](https://japan-equity.com/wp-content/uploads/2026/07/p21_sq-1024x1024.jpg)
![[Obayashi] Tackling the Labor Shortage — Robotics Construction®](https://japan-equity.com/wp-content/uploads/2026/07/p14_sq-1024x1024.jpg)
