
This article is based on publicly available IR materials and is not a recommendation to buy or sell any specific securities.
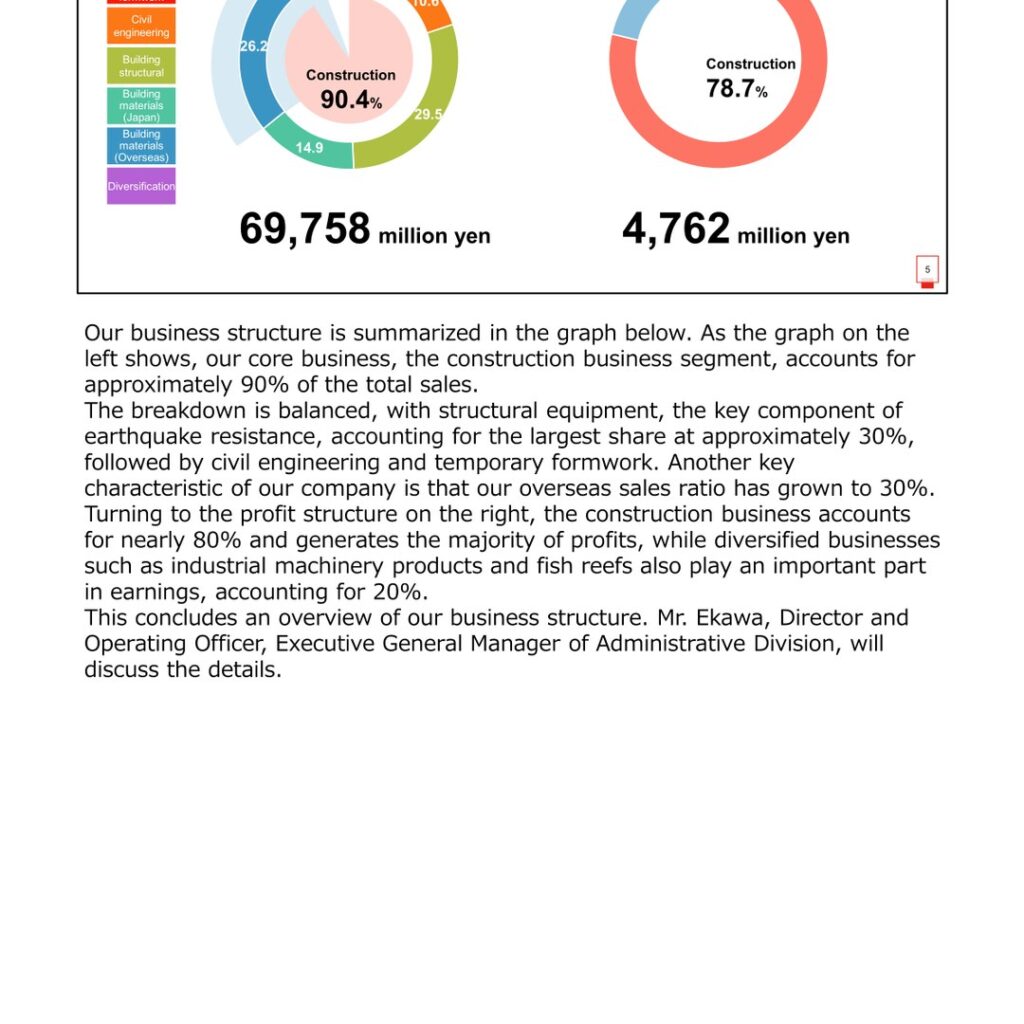
Okabe Co., Ltd. reported net sales of 69,758 million yen for the fiscal year ended December 31, 2025, up 2.9% year on year, and operating profit of 4,762 million yen, up 13.5%. Ordinary profit rose 14.9% to 5,081 million yen, while profit attributable to owners of parent came to 3,285 million yen against a loss of 874 million yen in the previous year, an improvement of 4,159 million yen. For the fiscal year ending December 31, 2026, the company forecasts net sales of 72,500 million yen and operating profit of 5,150 million yen.
Consolidated Results (Full-Year Actual)
In the construction-related products business, demand for temporary building and formwork products declined on a decrease in the floor area of reinforced concrete building starts and construction delays, while civil engineering products benefited from the government policy for building national resilience and orders for disaster recovery support projects. Building structural products were supported by the release of the modified Select Base column base for steel buildings, and overseas building materials grew on infrastructure-related demand in the United States together with a strengthened immediate delivery system at the new warehouse. In the diversification business, industrial machinery products expanded through high value-added and custom-made products and automotive products secured stable orders, while marine materials slowed toward the end of the period despite orders for large floating fish banks.
| Item | 2024 full-year results | 2025 full-year results | Change (amount) | Change (%) |
|---|---|---|---|---|
| Net sales | 67,806 | 69,758 | 1,951 | 2.9% |
| Operating profit | 4,194 | 4,762 | 568 | 13.5% |
| Operating profit margin | 6.2% | 6.8% | 0.6Pt | — |
| Ordinary profit | 4,422 | 5,081 | 658 | 14.9% |
| Profit attributable to owners of parent | (874) | 3,285 | 4,159 | — |
Figures are in millions of yen. Against the company’s own forecasts, net sales reached 96.2% of the 72,500 million yen plan, while operating profit came in at 101.3% of the 4,700 million yen plan, ordinary profit at 105.9% of the 4,800 million yen plan and profit at 105.3% of the 3,120 million yen plan; as the company put it, sales fell short of expectations but the profit base exceeded forecasts.
By composition, construction-related products accounted for 90.4% of FY2025 net sales of 69,758 million yen and 78.7% of operating profit of 4,762 million yen, with the diversification business making up 21.3% of operating profit. The overseas ratio of net sales stood at 30.0%. On foreign exchange, the average rate moved from 149.44 yen to the U.S. dollar in FY2024 to 148.28 yen in FY2025; the 1.16-yen appreciation reduced net sales by 184 million yen and operating profit by 2 million yen.
Segment and Product Category Results
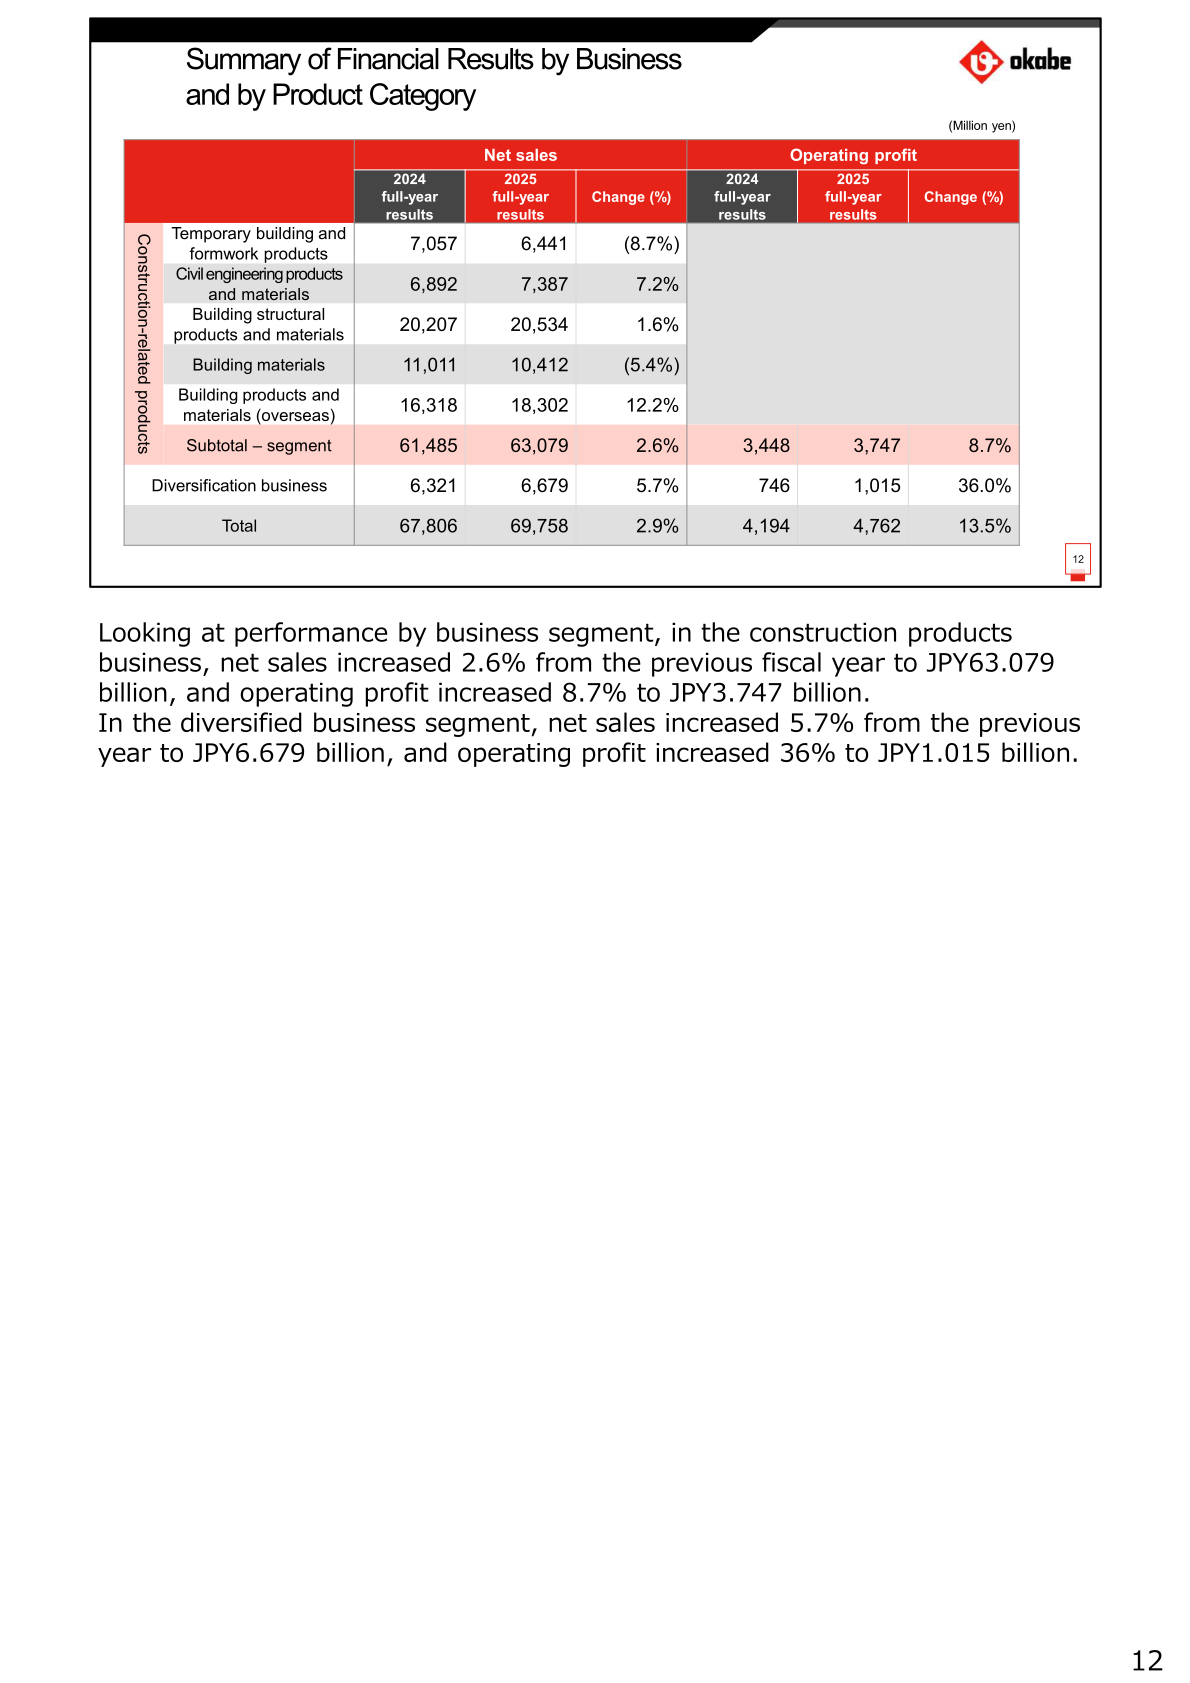
Net sales in the construction-related products segment rose 2.6% to 63,079 million yen and operating profit increased 8.7% to 3,747 million yen. The diversification business posted net sales up 5.7% at 6,679 million yen and operating profit up 36.0% at 1,015 million yen.
| Item | Net sales 2024 | Net sales 2025 | Change (%) | Operating profit 2024 | Operating profit 2025 | Change (%) |
|---|---|---|---|---|---|---|
| Temporary building and formwork products | 7,057 | 6,441 | (8.7%) | |||
| Civil engineering products and materials | 6,892 | 7,387 | 7.2% | |||
| Building structural products and materials | 20,207 | 20,534 | 1.6% | |||
| Building materials | 11,011 | 10,412 | (5.4%) | |||
| Building products and materials (overseas) | 16,318 | 18,302 | 12.2% | |||
| Subtotal – segment (construction-related products) | 61,485 | 63,079 | 2.6% | 3,448 | 3,747 | 8.7% |
| Diversification business | 6,321 | 6,679 | 5.7% | 746 | 1,015 | 36.0% |
| Total | 67,806 | 69,758 | 2.9% | 4,194 | 4,762 | 13.5% |
Figures are in millions of yen. Operating profit is disclosed at the segment level only. On the balance sheet, total assets decreased 1,962 million yen from the end of the previous year to 85,030 million yen and liabilities fell 4,328 million yen to 23,124 million yen, while interest-bearing liabilities edged up 96 million yen to 6,226 million yen. Net assets rose 2,365 million yen to 61,906 million yen and the equity ratio improved 4.4 points to 72.8%.
FY2026 Forecast
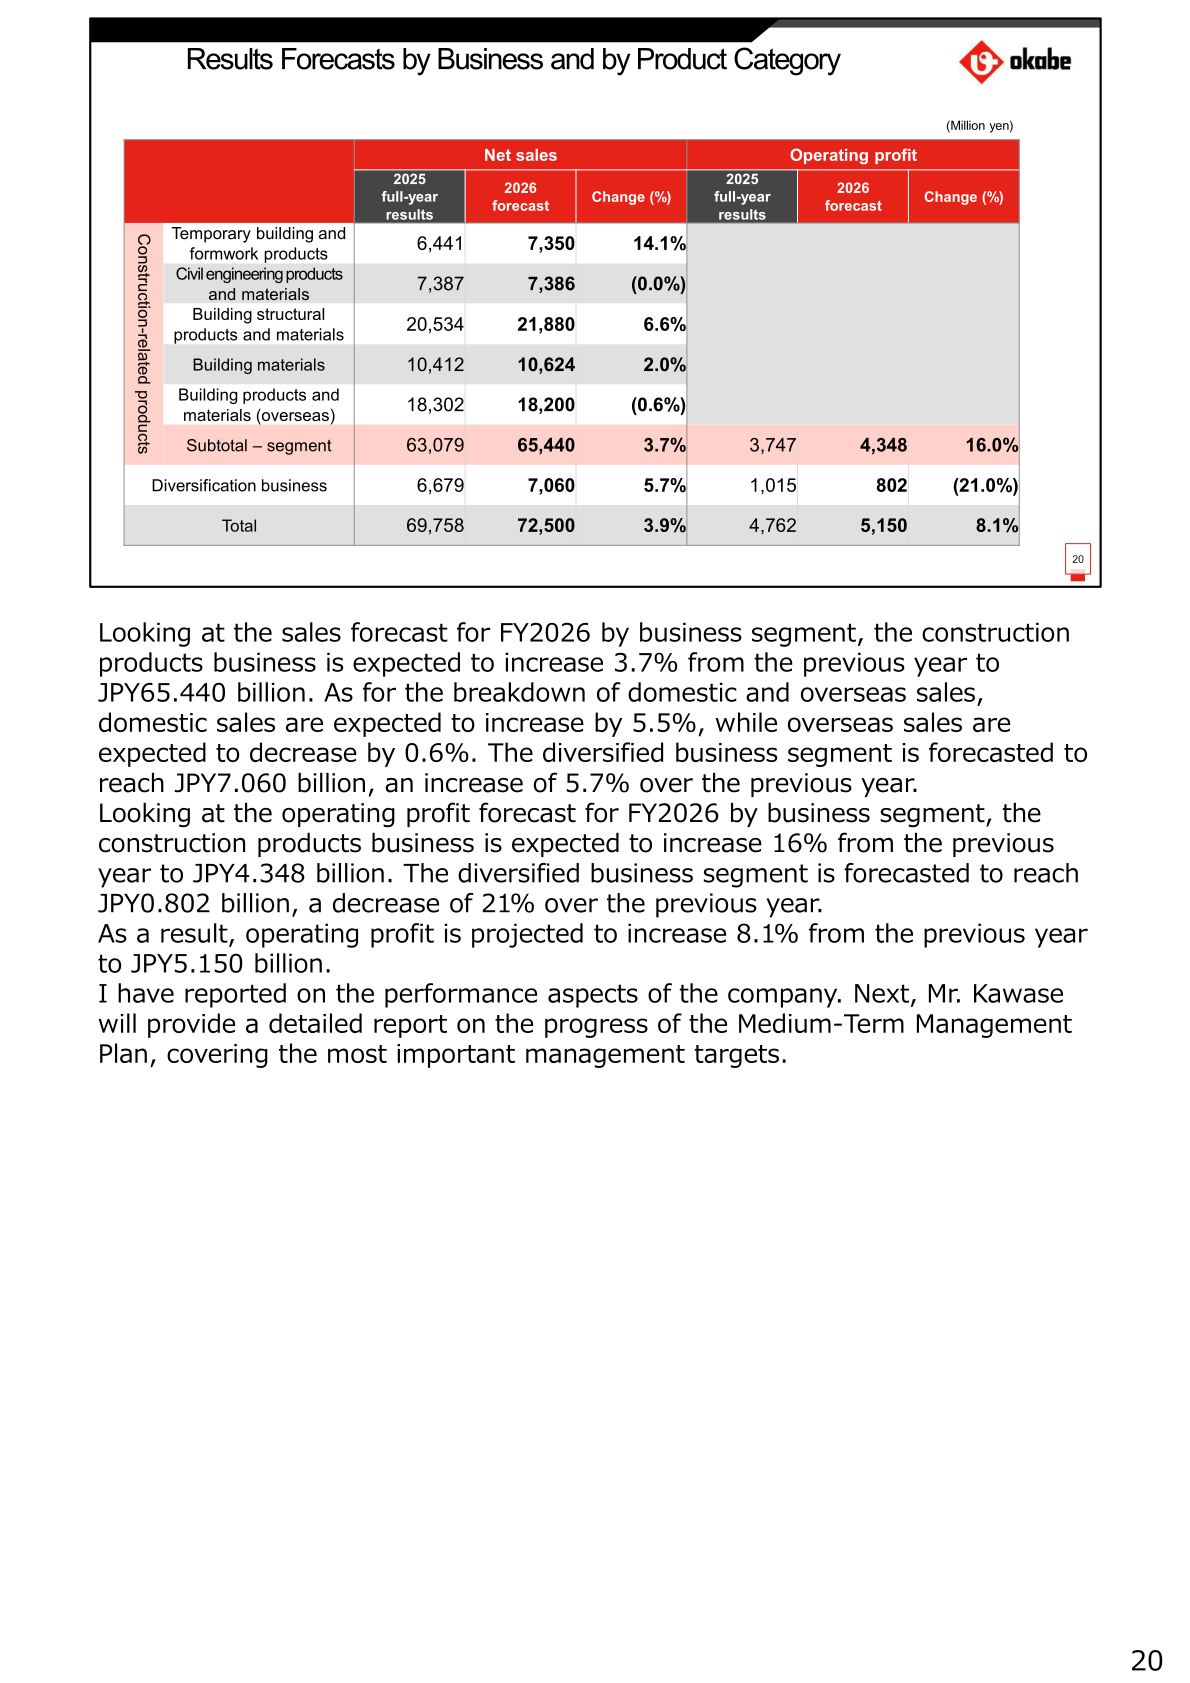
For FY2026 the company assumes that public investment in Japan will be strong on the back of the national resilience policy and countermeasures against aging infrastructure, while construction costs continue to rise and real construction volume stays nearly flat because of the labor shortage and overtime regulations. Overseas, budget implementation under the Infrastructure Investment and Jobs Act is expected to progress, with data centers and power grids driving market growth, while chronic shortages of skilled labor push up labor costs and cause construction delays. The assumed exchange rate is 147.00 yen to the U.S. dollar, a 1.28-yen appreciation that is expected to reduce net sales by 193 million yen and operating profit by 8 million yen.
| Item | 2025 full-year results | 2026 forecast | Change (amount) | Change (%) |
|---|---|---|---|---|
| Net sales | 69,758 | 72,500 | 2,741 | 3.9% |
| Operating profit | 4,762 | 5,150 | 387 | 8.1% |
| Operating profit margin | 6.8% | 7.1% | 0.3Pt | – |
| Ordinary profit | 5,081 | 5,300 | 218 | 4.3% |
| Profit attributable to owners of parent | 3,285 | 3,700 | 414 | 12.6% |
| ROE | 5.4% | 6.0% | 0.6Pt | – |
| Item | Net sales 2025 | Net sales 2026 forecast | Change (%) | Operating profit 2025 | Operating profit 2026 forecast | Change (%) |
|---|---|---|---|---|---|---|
| Temporary building and formwork products | 6,441 | 7,350 | 14.1% | |||
| Civil engineering products and materials | 7,387 | 7,386 | (0.0%) | |||
| Building structural products and materials | 20,534 | 21,880 | 6.6% | |||
| Building materials | 10,412 | 10,624 | 2.0% | |||
| Building products and materials (overseas) | 18,302 | 18,200 | (0.6%) | |||
| Subtotal – segment (construction-related products) | 63,079 | 65,440 | 3.7% | 3,747 | 4,348 | 16.0% |
| Diversification business | 6,679 | 7,060 | 5.7% | 1,015 | 802 | (21.0%) |
| Total | 69,758 | 72,500 | 3.9% | 4,762 | 5,150 | 8.1% |
Figures are in millions of yen. Within the construction-related products forecast, the company expects domestic sales to increase by 5.5% and overseas sales to decrease by 0.6%. On a half-year basis, the FY2026 plan breaks down into net sales of 34,100 million yen in the first half and 38,400 million yen in the second half, with operating profit of 2,300 million yen and 2,850 million yen respectively.
Shareholder Returns
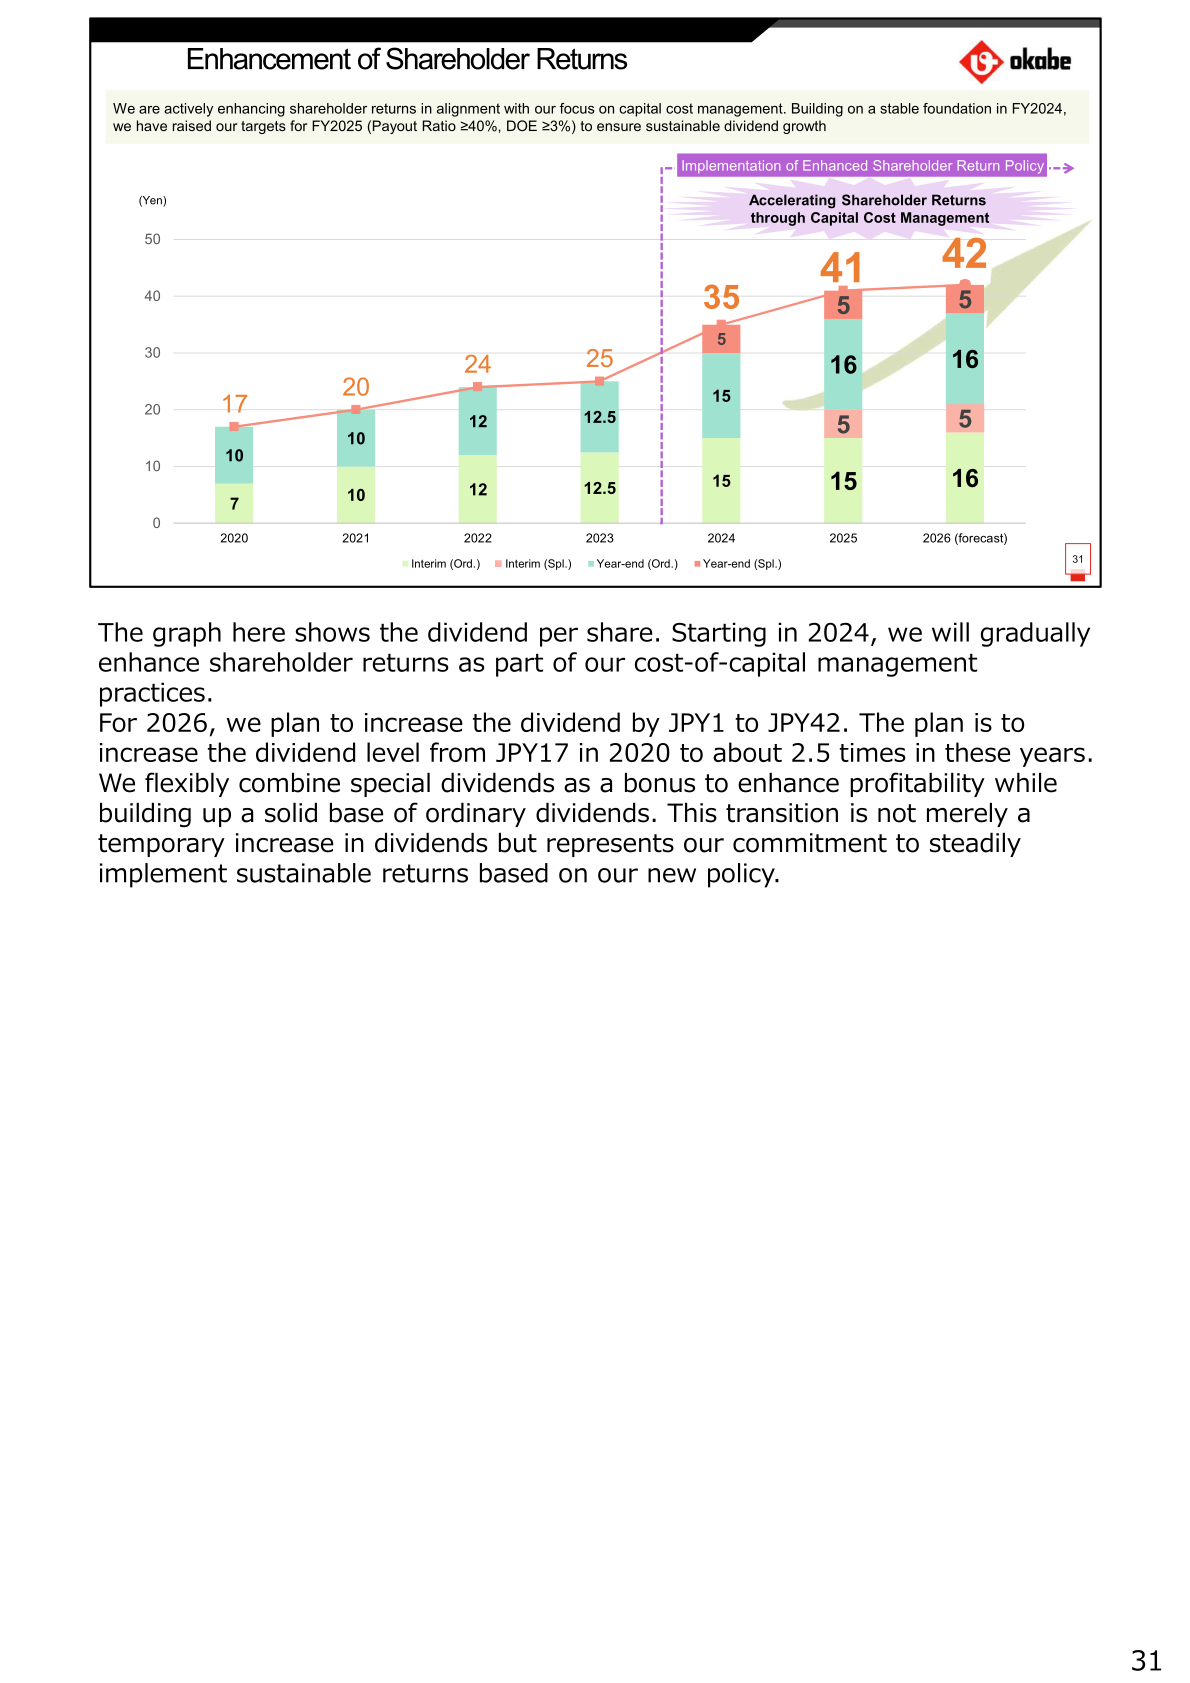
In February 2025 Okabe revised its shareholder returns policy, raising the target dividend payout ratio from a rough target of 30% or more to 40% or more and introducing a dividend on equity (DOE) target of at least 3%, while combining special dividends and flexible purchases of treasury shares to optimize its capital structure and achieve a P/B ratio of over 1x. The dividend per share was 35 yen in FY2024 and 41 yen in FY2025, and the company plans a 1 yen increase to 42 yen for FY2026. Special dividends were 5 yen in FY2024 and 10 yen in FY2025, an increase of 5 yen.
| Item | FY2024 | FY2025 | FY2026 (forecast) |
|---|---|---|---|
| Dividend per share (yen) | 35 | 41 | 42 |
| Payout ratio (%) | N/A due to net loss | 57.1 | 51.8 |
| DOE (%) | 2.7 | 3.1 | 3.1 |
In FY2025 the company repurchased 705,300 shares for approximately 0.6 billion yen, about 1.5% of total issued shares, and cancelled 2,000,000 shares, about 4.1% of total issued shares before cancellation. As a result the total return ratio for FY2025 reached 75.5%. For FY2026 the company plans new share repurchases of up to 5.0 billion yen, of which 1.5 billion yen was resolved on February 13 for execution via market purchase; the remaining 3.5 billion yen will be decided by comprehensively considering strategic investment opportunities such as M&A and the stock price level.
Medium-Term Plan and Topics
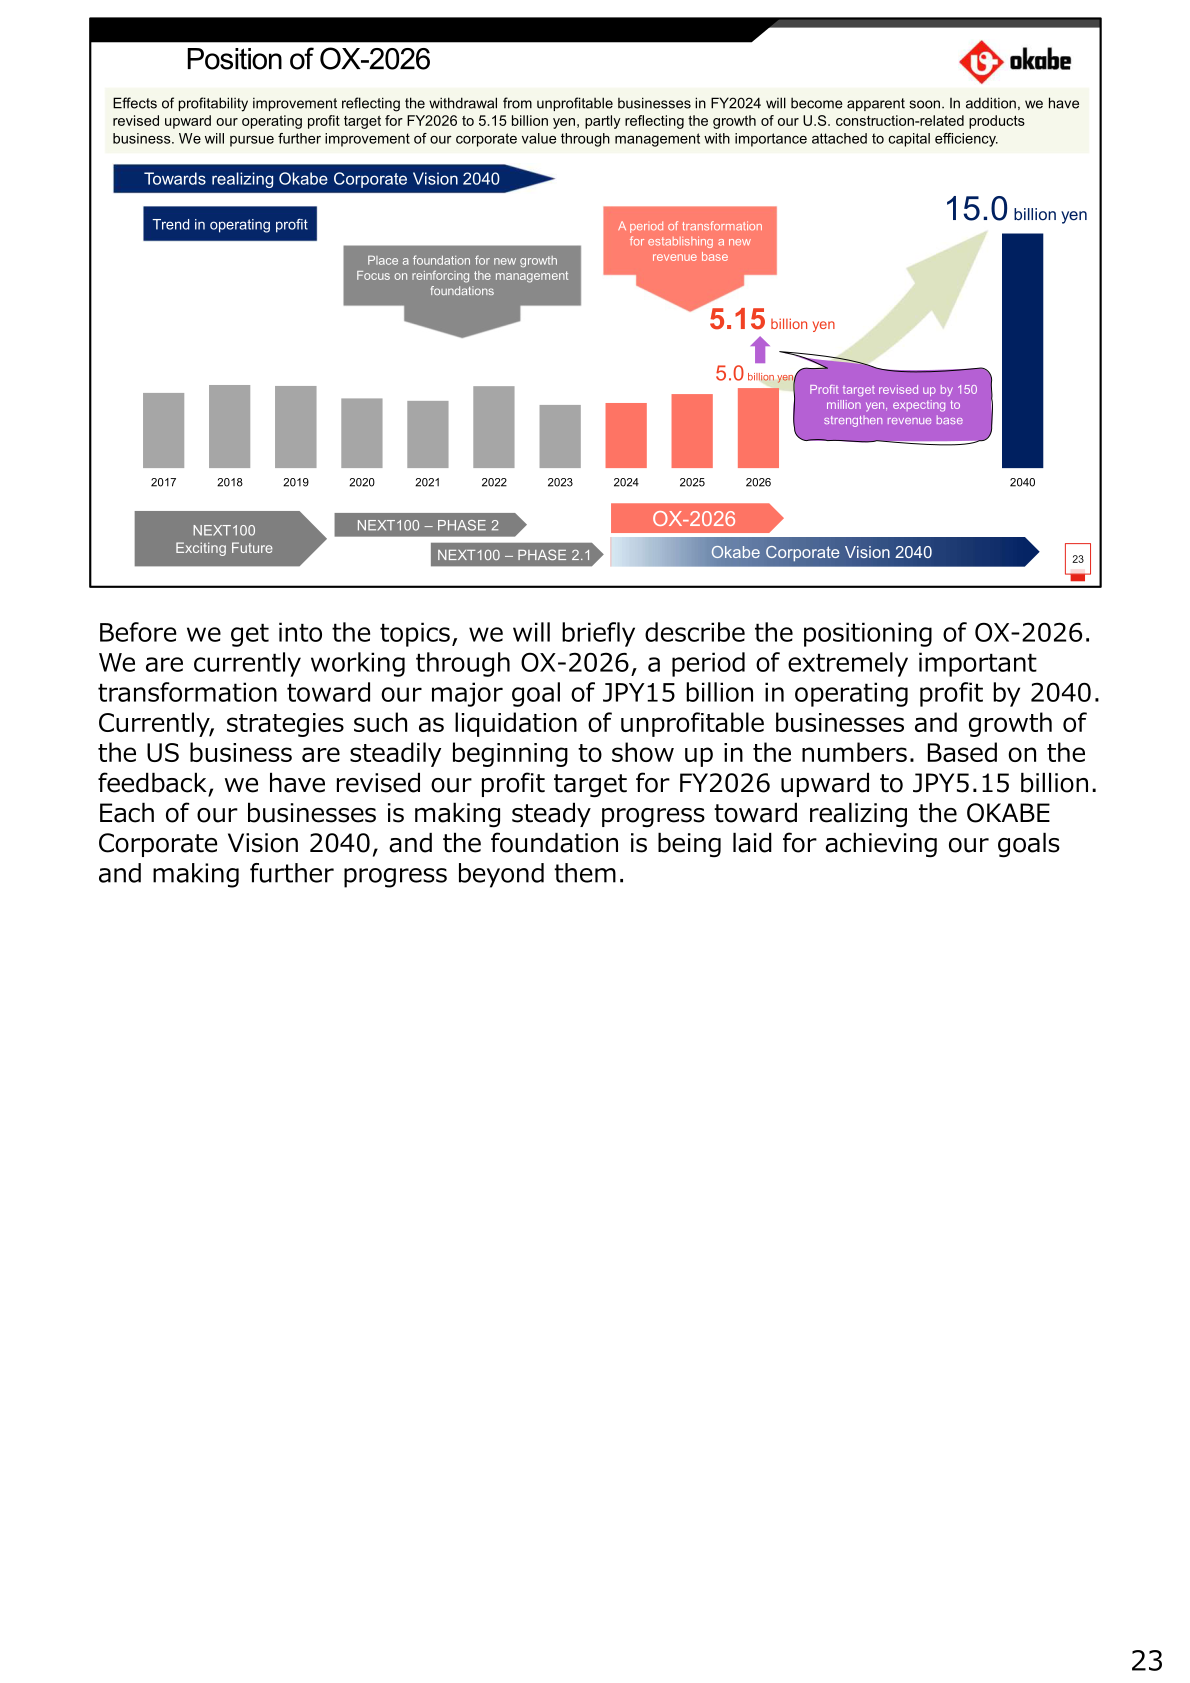
FY2026 is the final year of the medium-term management plan OX-2026, positioned as a period of transformation for establishing a new revenue base on the way to the Okabe Corporate Vision 2040 goal of 15.0 billion yen in operating profit. Reflecting the effects of the withdrawal from unprofitable businesses in FY2024 and the growth of the U.S. construction-related products business, the FY2026 operating profit target was revised up by 150 million yen from 5.0 billion yen to 5.15 billion yen. The plan also sets an aim of ROE of 8% or higher at an early stage and a P/B ratio of over 1x.
Three topics were highlighted as growth drivers. The Even-Surface NS Method, a new concrete slab formwork method that eliminates concrete leakage and reduces rework to zero, recorded sales of 150 million yen in 2025 during trial sales and will be expanded nationwide in 2026. Adoption of the revamped Select Base has been increasing since the May 2025 revamp, including completed delivery to the Atsuta Headquarters and Research and Development Center (tentative name) of MTG Co., Ltd., with sales of approximately 1.5 billion yen targeted in 2026. In North America, the OCM Group added a new plant in Philadelphia in 2024 and extended its Chicago warehouse in 2025 to strengthen supply capacity alongside its sales representative network. The company also formulated a revised M&A basic policy in 2025 that prioritizes domestic deals with high integration certainty and requires synergy creation with existing businesses.
Under the three-year OX-2026 investment framework of 21 billion yen in total—approximately 10 billion yen for capital investment, approximately 10 billion yen for M&A and strategic investment and approximately 1 billion yen for human capital investment—the company invested approximately 2.5 billion yen in capital expenditure and approximately 0.8 billion yen in strategic investment in FY2025, and allocated approximately 2.5 billion yen to shareholder returns. Capital investment is planned at 4,634 million yen in FY2026 against 2,501 million yen in FY2025, with depreciation of 1,955 million yen versus 1,741 million yen.
This article is an analysis based on publicly available information and is not a recommendation to buy or sell any specific securities. Investment decisions are your own responsibility.
![[Obayashi] Investors’ Guide 2026 — The Complete 24-Article Breakdown](https://japan-equity.com/wp-content/uploads/2026/07/hub_cover-1024x1024.png)
![[Obayashi] IR & SR Policy — Feeding Dialogue Back into Management](https://japan-equity.com/wp-content/uploads/2026/07/p32_sq-1024x1024.jpg)
![[Obayashi] Domestic Civil Engineering — Resilience Spending Supports 9.6% Margin](https://japan-equity.com/wp-content/uploads/2026/07/p11_sq-1024x1024.jpg)
![[Obayashi] Overseas Construction — Orders Reach ¥1.2tn](https://japan-equity.com/wp-content/uploads/2026/07/p15_sq-1024x1024.jpg)
![[Obayashi] Share Price & External Ratings — vs TOPIX, ESG Index Inclusion](https://japan-equity.com/wp-content/uploads/2026/07/p40_sq-1024x1024.jpg)
![[Construction] ¥75.5tn Investment, Shrinking Workforce — Big-5 Market Share](https://japan-equity.com/wp-content/uploads/2026/07/p12_sq-1024x1024.jpg)



![[Obayashi] Capital Policy & Shareholder Returns — ROE 10%+, DOE ~5%, ¥100bn Buyback](https://japan-equity.com/wp-content/uploads/2026/07/p27_sq-1024x1024.jpg)
![[Obayashi] Reducing Cross-Shareholdings — ¥285.2bn Sold in Five Years](https://japan-equity.com/wp-content/uploads/2026/07/p29_sq-1024x1024.jpg)
![[Obayashi] ¥750bn Investment Plan — ¥300bn to Development, ¥190bn to Tech/DX](https://japan-equity.com/wp-content/uploads/2026/07/p30_sq-1024x1024.jpg)
![[Obayashi] MTP2022 KPIs — Operating Profit ~2x Target, ROE 14.4%](https://japan-equity.com/wp-content/uploads/2026/07/p25_sq-1024x1024.jpg)
![[Obayashi] Cash Allocation — ¥420bn Investment CF Over Five Years](https://japan-equity.com/wp-content/uploads/2026/07/p26_sq-1024x1024.jpg)
![[Obayashi] Green Energy — 44 Plants, 344MW, and the Green Hydrogen Challenge](https://japan-equity.com/wp-content/uploads/2026/07/p21_sq-1024x1024.jpg)
![[Obayashi] Tackling the Labor Shortage — Robotics Construction®](https://japan-equity.com/wp-content/uploads/2026/07/p14_sq-1024x1024.jpg)
