
This article is based on publicly available IR materials and is not a recommendation to buy or sell any specific securities.
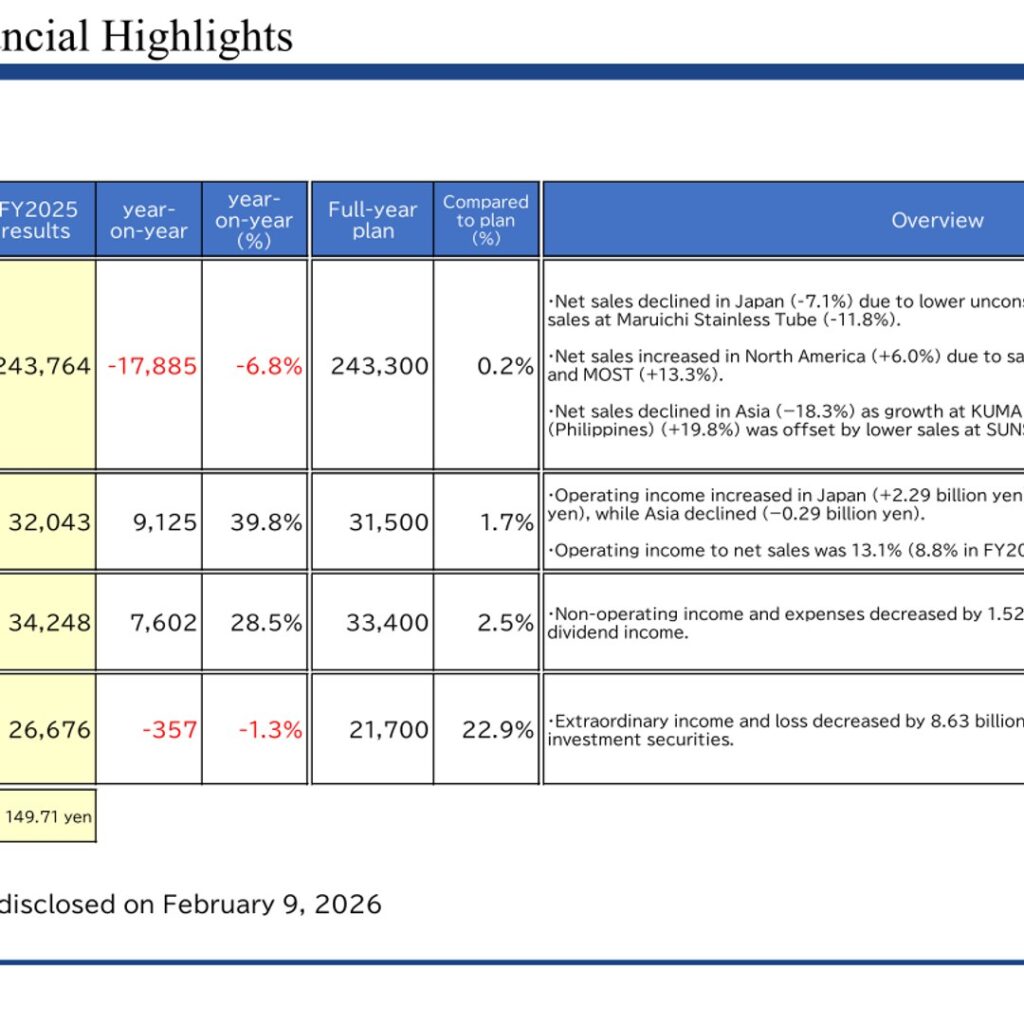
Maruichi Steel Tube Ltd. reported net sales of 243,764 million yen for the fiscal year ended March 31, 2026, down 6.8% year on year, while consolidated operating income rose 39.8% to 32,043 million yen on a recovery in the U.S. Ordinary income increased 28.5% to 34,248 million yen, but net income attributable to owners of parent edged down 1.3% to 26,676 million yen as extraordinary income and loss decreased by 8.63 billion yen due to lower gains on sales of investment securities. For the following year the company forecasts record net sales of 274,500 million yen and record operating income of 36,900 million yen. Note: the presentation labels the fiscal year ended March 31, 2026 as “FY2025” and the following fiscal year as “FY2026”; those labels are kept as reported in the text, tables and figures below.
Consolidated Results (Full-Year Actual)
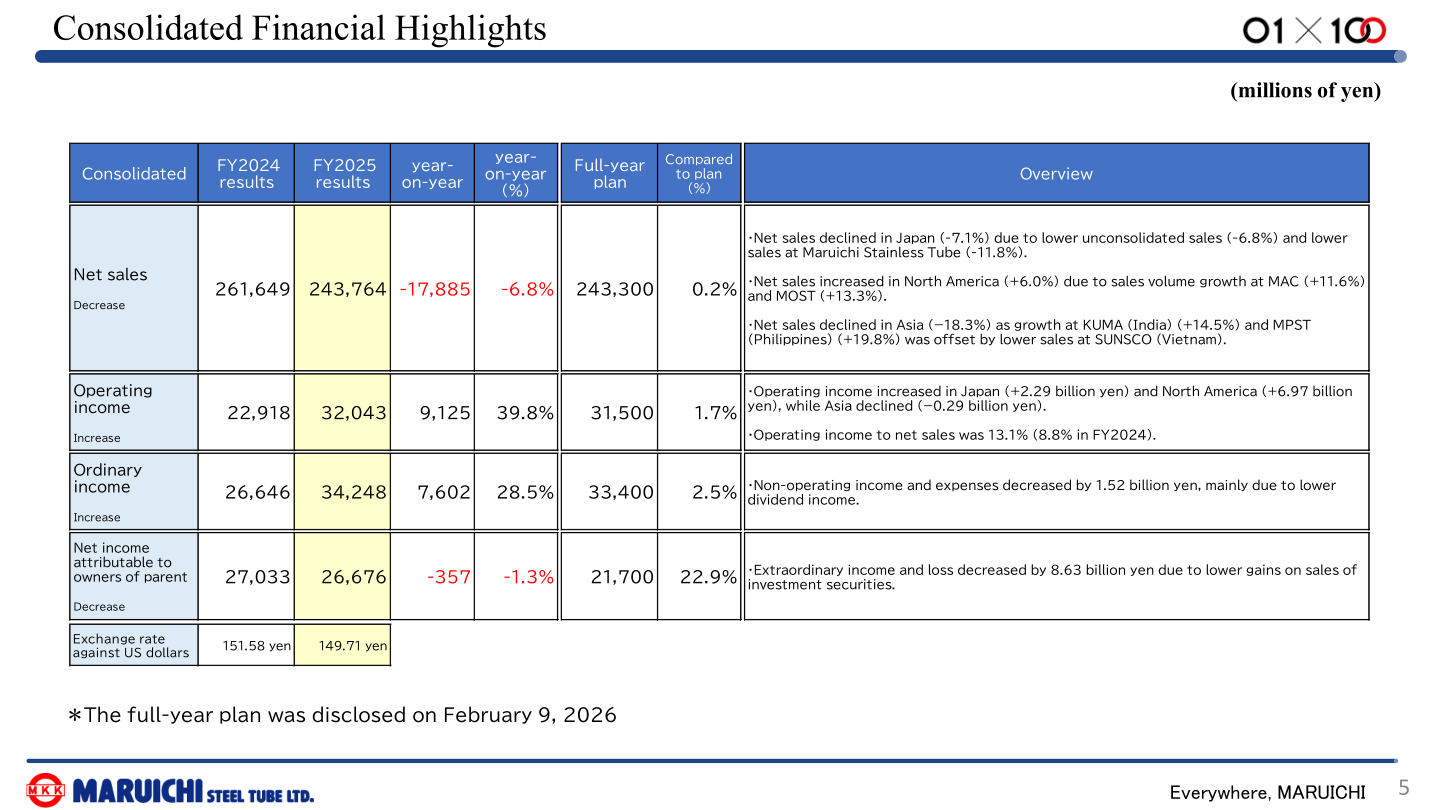
Net sales declined in Japan (-7.1%) due to lower unconsolidated sales (-6.8%) and lower sales at Maruichi Stainless Tube (-11.8%). Net sales increased in North America (+6.0%) on sales volume growth at MAC (+11.6%) and MOST (+13.3%), while Asia declined (-18.3%) as growth at KUMA (India) (+14.5%) and MPST (Philippines) (+19.8%) was offset by lower sales at SUNSCO (Vietnam). Operating income to net sales was 13.1% (8.8% in FY2024). Non-operating income and expenses decreased by 1.52 billion yen, mainly due to lower dividend income. Against the full-year plan disclosed on February 9, 2026, net sales came in 0.2% above plan, operating income 1.7% above plan, ordinary income 2.5% above plan and net income 22.9% above plan.
| Consolidated (millions of yen) | FY2024 results | FY2025 results | Year-on-year | Year-on-year (%) | Full-year plan | Compared to plan (%) |
|---|---|---|---|---|---|---|
| Net sales | 261,649 | 243,764 | -17,885 | -6.8% | 243,300 | 0.2% |
| Operating income | 22,918 | 32,043 | 9,125 | 39.8% | 31,500 | 1.7% |
| Ordinary income | 26,646 | 34,248 | 7,602 | 28.5% | 33,400 | 2.5% |
| Net income attributable to owners of parent | 27,033 | 26,676 | -357 | -1.3% | 21,700 | 22.9% |
| Exchange rate against US dollars | 151.58 yen | 149.71 yen | ー | ー | ー | ー |
Segment Results
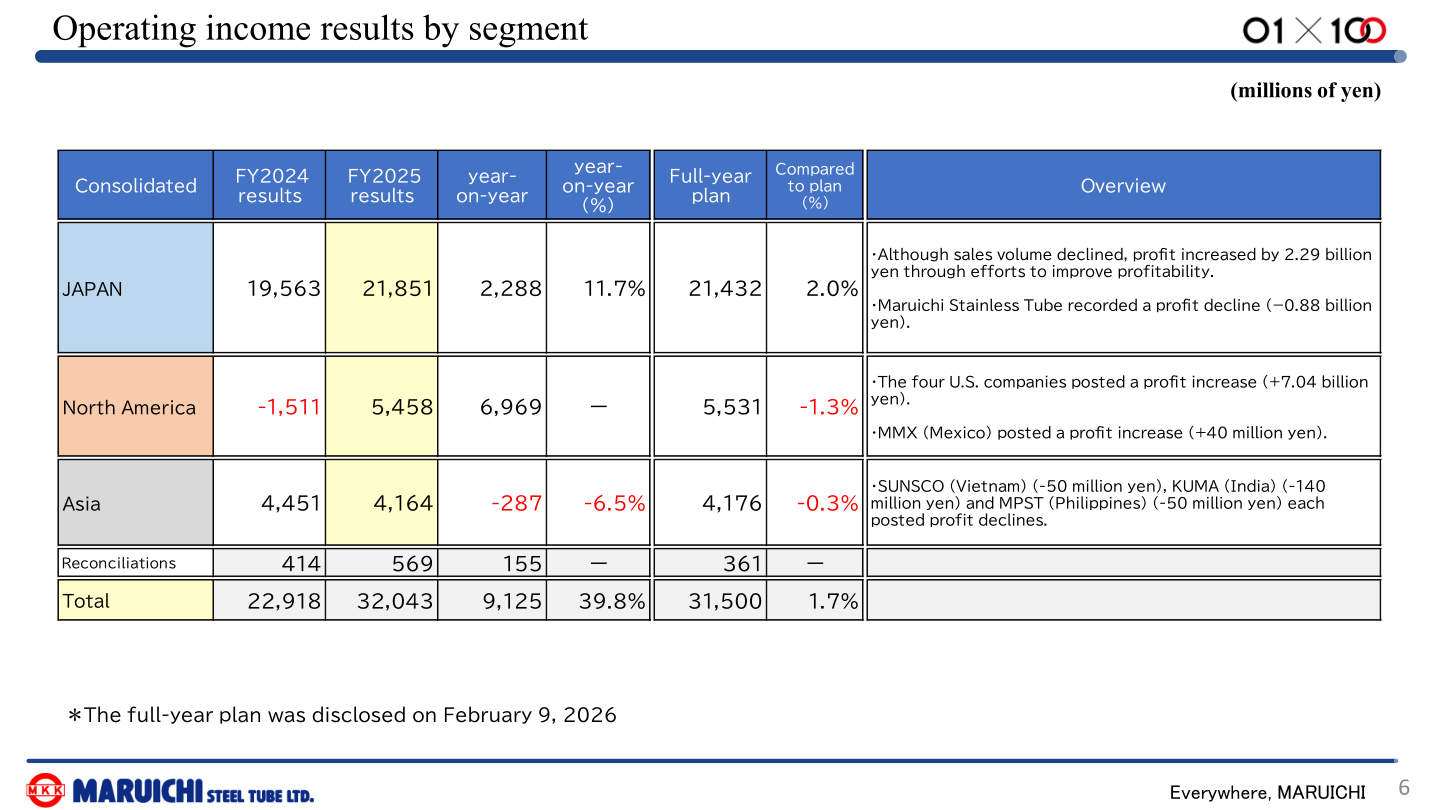
By segment, operating income in JAPAN rose 11.7% to 21,851 million yen: although sales volume declined, profit increased by 2.29 billion yen through efforts to improve profitability, while Maruichi Stainless Tube recorded a profit decline (-0.88 billion yen). North America swung from an operating loss of 1,511 million yen to a profit of 5,458 million yen, as the four U.S. companies posted a profit increase (+7.04 billion yen) and MMX (Mexico) a profit increase (+40 million yen). Asia fell 6.5% to 4,164 million yen, with SUNSCO (Vietnam) (-50 million yen), KUMA (India) (-140 million yen) and MPST (Philippines) (-50 million yen) each posting profit declines. On a segment net sales basis, JAPAN was 144,139 million yen (155,149 million yen in FY2024), North America 54,837 million yen (51,710 million yen) and Asia 44,788 million yen (54,789 million yen).
| Segment: operating income (millions of yen) | FY2024 results | FY2025 results | Year-on-year | Year-on-year (%) | Full-year plan | Compared to plan (%) |
|---|---|---|---|---|---|---|
| JAPAN | 19,563 | 21,851 | 2,288 | 11.7% | 21,432 | 2.0% |
| North America | -1,511 | 5,458 | 6,969 | ー | 5,531 | -1.3% |
| Asia | 4,451 | 4,164 | -287 | -6.5% | 4,176 | -0.3% |
| Reconciliations | 414 | 569 | 155 | ー | 361 | ー |
| Total | 22,918 | 32,043 | 9,125 | 39.8% | 31,500 | 1.7% |
At the parent company, Maruichi Steel Tube (unconsolidated) sales volume declined 1.6% to 641,428 MT from 652,020 MT due to weak domestic demand, yet operating income rose 20.5% to 18,573 million yen. Maruichi Stainless Tube’s operating income fell 35.0% to 1,635 million yen on lower U.S. exports and weak demand for semiconductor-related BA tubes. SUNSCO (Vietnam) posted lower revenue due to the halt of steel sheet exports to the U.S. caused by A/D, with sales volume down 19.1%, while its operating profit was maintained with a slight decline to 2,389 million yen. A gain of 5.8 billion yen was recorded in Q4 due to the sale of stock.
FY2026 Forecast
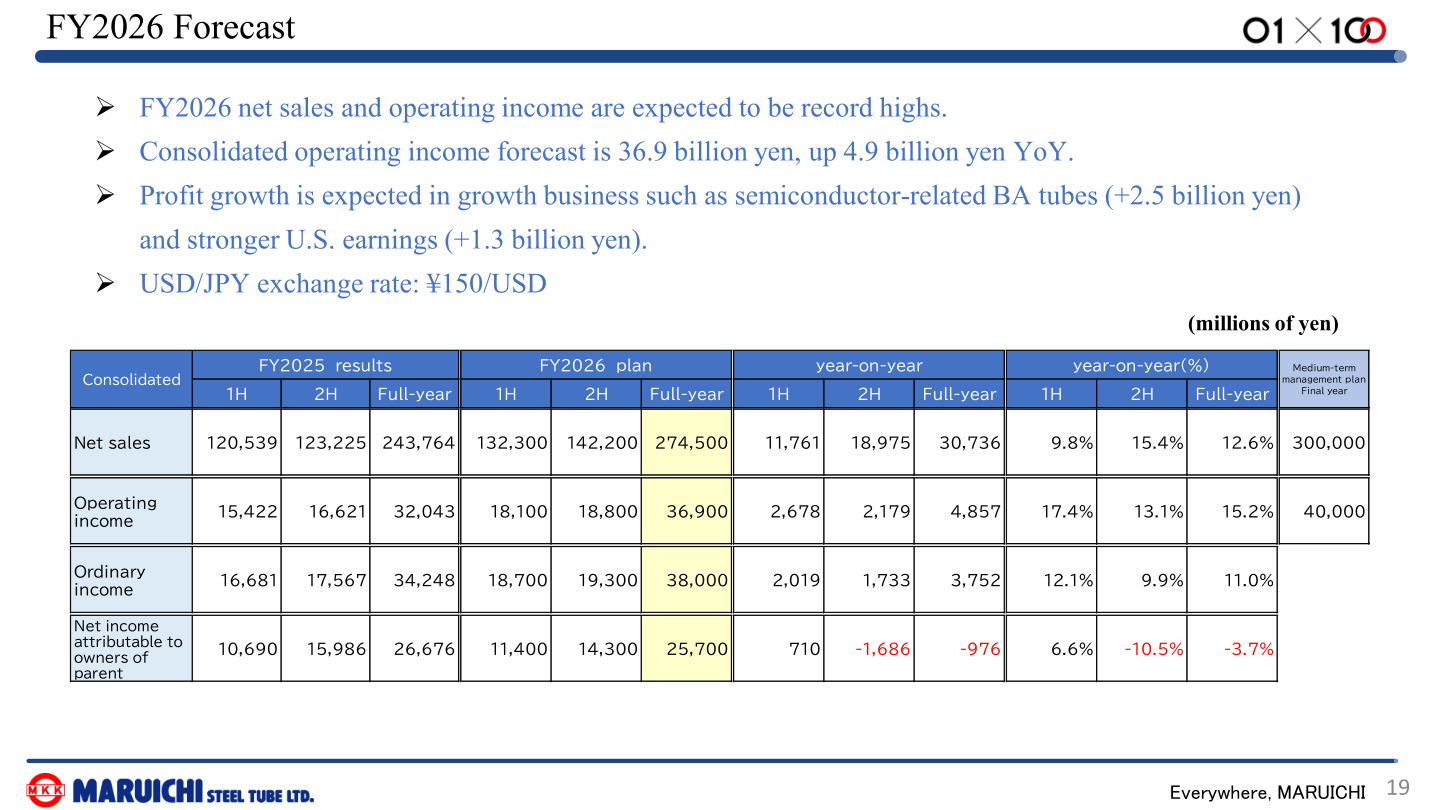
FY2026 net sales and operating income are expected to be record highs. The consolidated operating income forecast is 36.9 billion yen, up 4.9 billion yen year on year. Profit growth is expected in growth businesses such as semiconductor-related BA tubes (+2.5 billion yen) and stronger U.S. earnings (+1.3 billion yen). The forecast assumes a USD/JPY exchange rate of 150 yen per dollar. By segment, the plan calls for net sales of 158,150 million yen in JAPAN, 67,612 million yen in North America and 48,738 million yen in Asia, with operating income of 24,188 million yen, 8,173 million yen and 4,274 million yen respectively. Full-year capital expenditure is expected to be 32.3 billion yen in FY2026.
| Consolidated (millions of yen) | FY2025 results (full-year) | FY2026 plan (full-year) | Year-on-year | Year-on-year (%) | Medium-term management plan final year |
|---|---|---|---|---|---|
| Net sales | 243,764 | 274,500 | 30,736 | 12.6% | 300,000 |
| Operating income | 32,043 | 36,900 | 4,857 | 15.2% | 40,000 |
| Ordinary income | 34,248 | 38,000 | 3,752 | 11.0% | ー |
| Net income attributable to owners of parent | 26,676 | 25,700 | -976 | -3.7% | ー |
Shareholder Returns
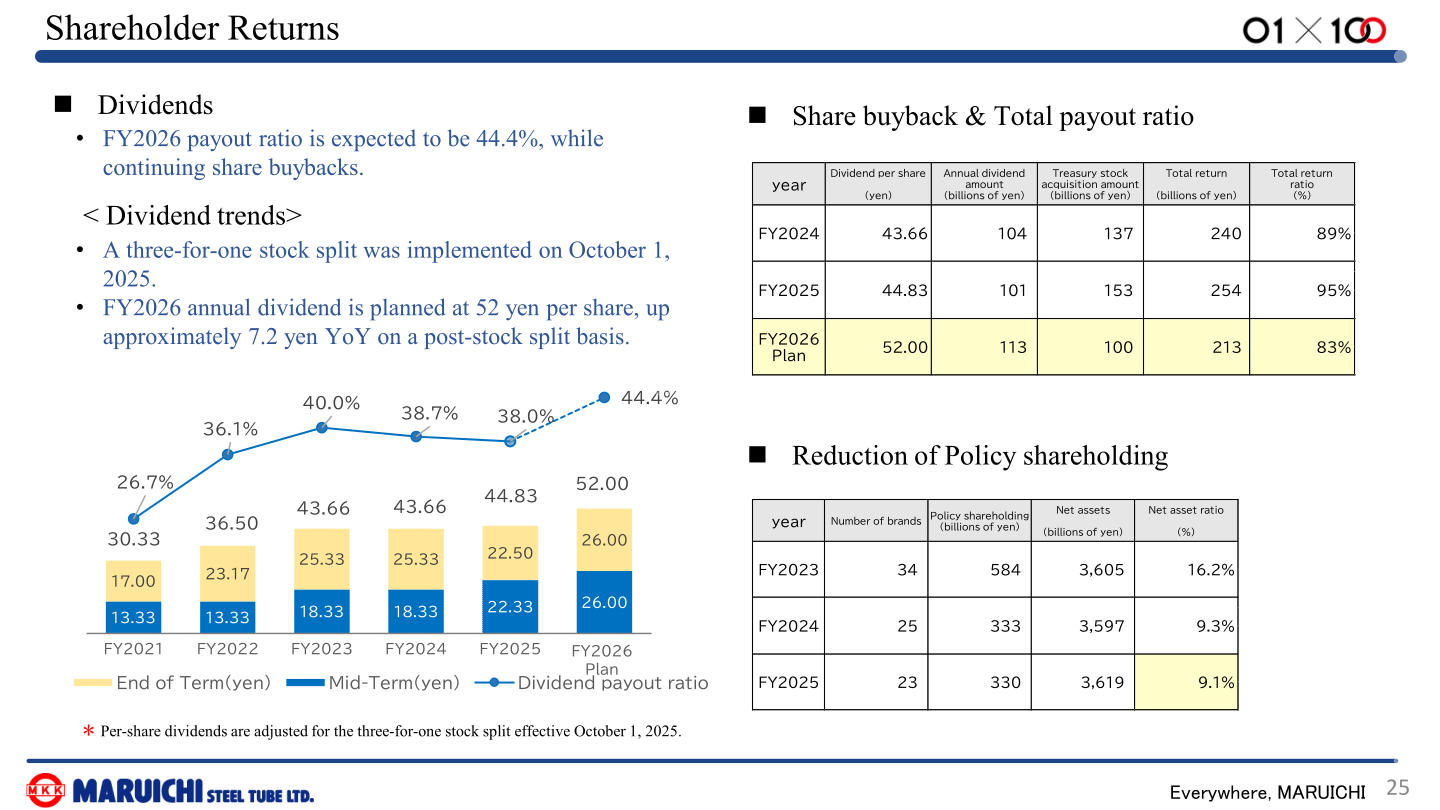
The FY2026 payout ratio is expected to be 44.4%, while the company continues share buybacks. A three-for-one stock split was implemented on October 1, 2025, and per-share dividends are adjusted for that split. The FY2026 annual dividend is planned at 52 yen per share, up approximately 7.2 yen year on year on a post-stock split basis. Following share buybacks of 13.7 billion yen in FY2024 and 15.3 billion yen in FY2025, the company plans an additional 10.0 billion yen in FY2026, maintaining a high total payout ratio (83%). On policy shareholdings, the number of brands was reduced to 23 in FY2025 from 25 in FY2024 and 34 in FY2023, and the ratio of policy shareholdings to net assets declined to 9.1% from 9.3% in FY2024 and 16.2% in FY2023.
| Item | FY2024 | FY2025 | FY2026 Plan |
|---|---|---|---|
| Dividend per share (yen) | 43.66 | 44.83 | 52.00 |
| Dividend payout ratio | 38.7% | 38.0% | 44.4% |
| Total return ratio (%) | 89% | 95% | 83% |
| Policy shareholding: number of brands | 25 | 23 | ー |
| Policy shareholding as a ratio of net assets (%) | 9.3% | 9.1% | ー |
Medium-Term Plan Review
In the review of the 7th Medium-Term Plan, FY2025 results came in below the FY2025 medium-term plan, with ROE of 7.7% and a payout ratio of 38.0% against a plan payout ratio of 43%. For FY2026 the company forecasts ROE of 7.3% and a payout ratio of 44.4%, against medium-term plan targets of 8% and 45%. The FY2026 operating income forecast is 3.1 billion yen below the medium-term plan due to weak semiconductor-related BA tube demand, while core businesses are expected to remain largely in line with the plan. Key initiatives include implementing sales price increases to mitigate higher input costs and continuing cost reductions through production optimization in the domestic core business; focusing on securing spreads and inventory control in the U.S. and on high value-added steel sheet sales at SUNSCO in the offshore core business; and capturing recovering semiconductor demand in the growth business, where BA tube production is expected to reach 190 thousand tubes per month against capacity of 250 thousand.
Business Environment and Topics
Domestic steel sheet demand remained weak, but the market turned upward on announced price increases by steelmakers, and imports of Chinese and Korean GI declined due to A/D, accelerating the shift to domestic suppliers and increasing orders. In North America, U.S. CRU has continued to recover since October 2025, and the U.S. pipe market remains strong on data center and border fence demand, with pipe prices continuing to rise. In semiconductors, shipments started for Samsung/Korea and SMIC (Beijing) projects, and Micron (Idaho) is expected to begin installing semiconductor equipment in 2H FY2026. On new plants, Maruichi Stainless Tube Texas Corporation (MST-X) has been in commercial operation from February 2025, the KUMA (India) Gujarat plant 2-inch mill started operation from April 2025, MPST (Philippines) started a 2-inch mill at its existing plant in January 2026, and the MMX No.2 location in Monterrey, Nuevo Leon State, Mexico is scheduled to start operation in July 2026.
This article is an analysis based on publicly available information and is not a recommendation to buy or sell any specific securities. Investment decisions are your own responsibility.
![[Obayashi] Investors’ Guide 2026 — The Complete 24-Article Breakdown](https://japan-equity.com/wp-content/uploads/2026/07/hub_cover-1024x1024.png)
![[Obayashi] IR & SR Policy — Feeding Dialogue Back into Management](https://japan-equity.com/wp-content/uploads/2026/07/p32_sq-1024x1024.jpg)
![[Obayashi] Real Estate Development — 18.7% Margin, ¥287.7bn Unrealized Gains](https://japan-equity.com/wp-content/uploads/2026/07/p20_sq-1024x1024.jpg)
![[Obayashi] Domestic Civil Engineering — Resilience Spending Supports 9.6% Margin](https://japan-equity.com/wp-content/uploads/2026/07/p11_sq-1024x1024.jpg)
![[Obayashi] Share Price & External Ratings — vs TOPIX, ESG Index Inclusion](https://japan-equity.com/wp-content/uploads/2026/07/p40_sq-1024x1024.jpg)
![[Construction] ¥75.5tn Investment, Shrinking Workforce — Big-5 Market Share](https://japan-equity.com/wp-content/uploads/2026/07/p12_sq-1024x1024.jpg)



![[Obayashi] Capital Policy & Shareholder Returns — ROE 10%+, DOE ~5%, ¥100bn Buyback](https://japan-equity.com/wp-content/uploads/2026/07/p27_sq-1024x1024.jpg)
![[Obayashi] Reducing Cross-Shareholdings — ¥285.2bn Sold in Five Years](https://japan-equity.com/wp-content/uploads/2026/07/p29_sq-1024x1024.jpg)
![[Obayashi] ¥750bn Investment Plan — ¥300bn to Development, ¥190bn to Tech/DX](https://japan-equity.com/wp-content/uploads/2026/07/p30_sq-1024x1024.jpg)
![[Obayashi] MTP2022 KPIs — Operating Profit ~2x Target, ROE 14.4%](https://japan-equity.com/wp-content/uploads/2026/07/p25_sq-1024x1024.jpg)
![[Obayashi] Cash Allocation — ¥420bn Investment CF Over Five Years](https://japan-equity.com/wp-content/uploads/2026/07/p26_sq-1024x1024.jpg)
![[Obayashi] Green Energy — 44 Plants, 344MW, and the Green Hydrogen Challenge](https://japan-equity.com/wp-content/uploads/2026/07/p21_sq-1024x1024.jpg)
![[Obayashi] Tackling the Labor Shortage — Robotics Construction®](https://japan-equity.com/wp-content/uploads/2026/07/p14_sq-1024x1024.jpg)
