
This article is based on publicly available IR materials and is not a recommendation to buy or sell any specific securities.
TOYO TIRE CORPORATION reported record results for FY2025 (January-December 2025). Net sales hit a record high of 594.9 billion yen (the highest figure since 2013, when the current accounting period was applied) and operating income also hit a record high of 97.4 billion yen despite an increase in costs. Ordinary income and profit attributable to owners of parent both declined year on year, with profit attributable to owners of parent falling primarily due to the recording of impairment losses. The annual dividend per share is forecast to increase year on year to 130 yen, including a 5 yen 80th anniversary commemorative dividend.
Consolidated Results (FY2025 Full-Year Actual)
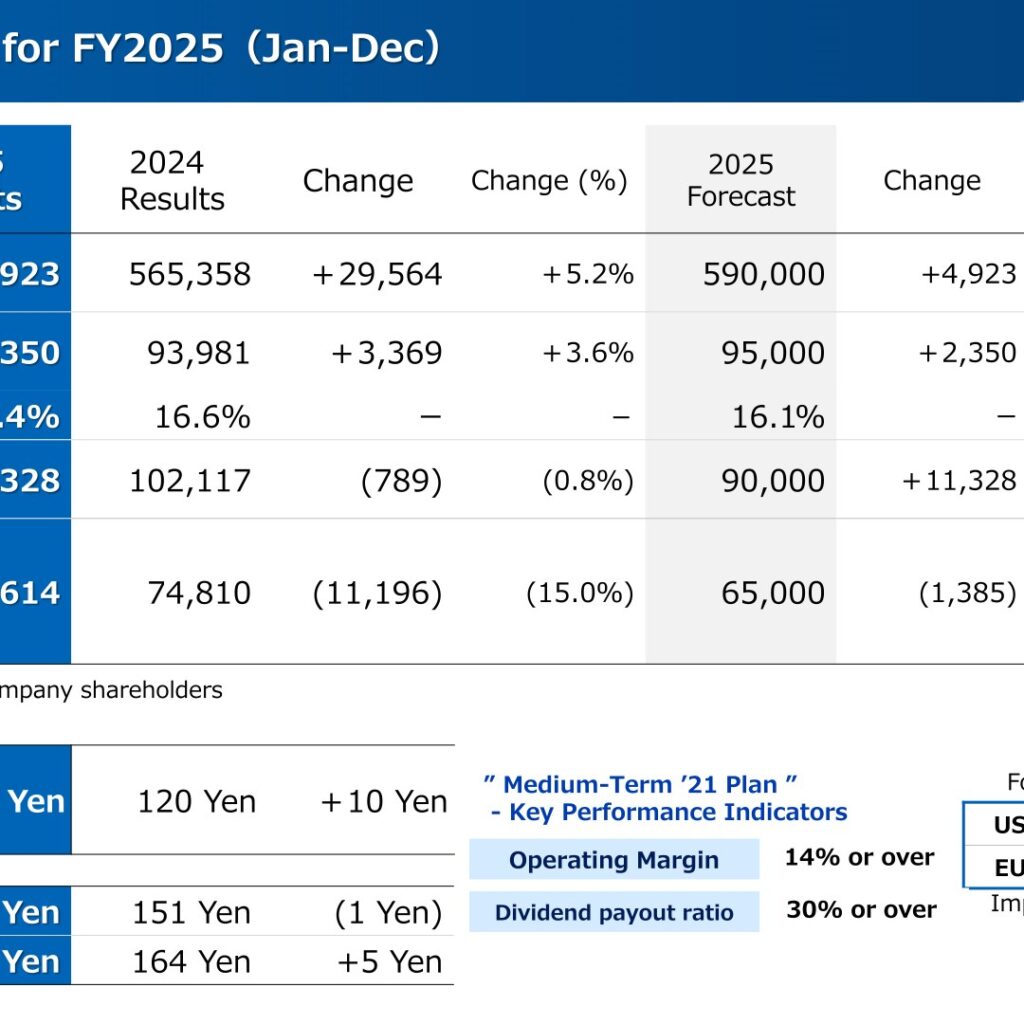
Net sales came to 594,923 million yen, up 29,564 million yen or 5.2% year on year, and operating income was 97,350 million yen, up 3,369 million yen or 3.6%. The operating margin was 16.4%, against 16.6% a year earlier. Ordinary income was 101,328 million yen, down 0.8%, and profit attributable to owners of parent was 63,614 million yen, down 15.0%. All figures are in millions of yen unless otherwise stated.
Results also came in ahead of the company’s own FY2025 forecast on the top line and at the operating level: net sales exceeded the 590,000 million yen forecast by 4,923 million yen, operating income exceeded the 95,000 million yen forecast by 2,350 million yen and ordinary income exceeded the 90,000 million yen forecast by 11,328 million yen, while profit attributable to owners of parent fell 1,385 million yen short of the 65,000 million yen forecast. In the October-December quarter alone, net sales were 159,633 million yen (up 14,884 million yen year on year) and operating income was 25,282 million yen (up 7,539 million yen).
In the operating income analysis (unit: billions of yen), sales factors added 11.4 in January-September and a further 7.0 in October-December, while the tariff impact subtracted 5.2 and 5.0 in the respective periods. Assumed exchange rates for the year were 150 yen to the US dollar (151 yen in the prior year) and 169 yen to the euro (164 yen). The company states that a 1 yen fluctuation has an annual operating income sensitivity of 0.8 billion yen for the US dollar and 0.1 billion yen for the euro.
| Item | FY2025 Results | FY2024 Results | Change | Change (%) |
|---|---|---|---|---|
| Net Sales | 594,923 | 565,358 | +29,564 | +5.2% |
| Operating Income | 97,350 | 93,981 | +3,369 | +3.6% |
| Operating Margin | 16.4% | 16.6% | — | — |
| Ordinary Income | 101,328 | 102,117 | (789) | (0.8%) |
| Profit Attributable to Owners of Parent | 63,614 | 74,810 | (11,196) | (15.0%) |
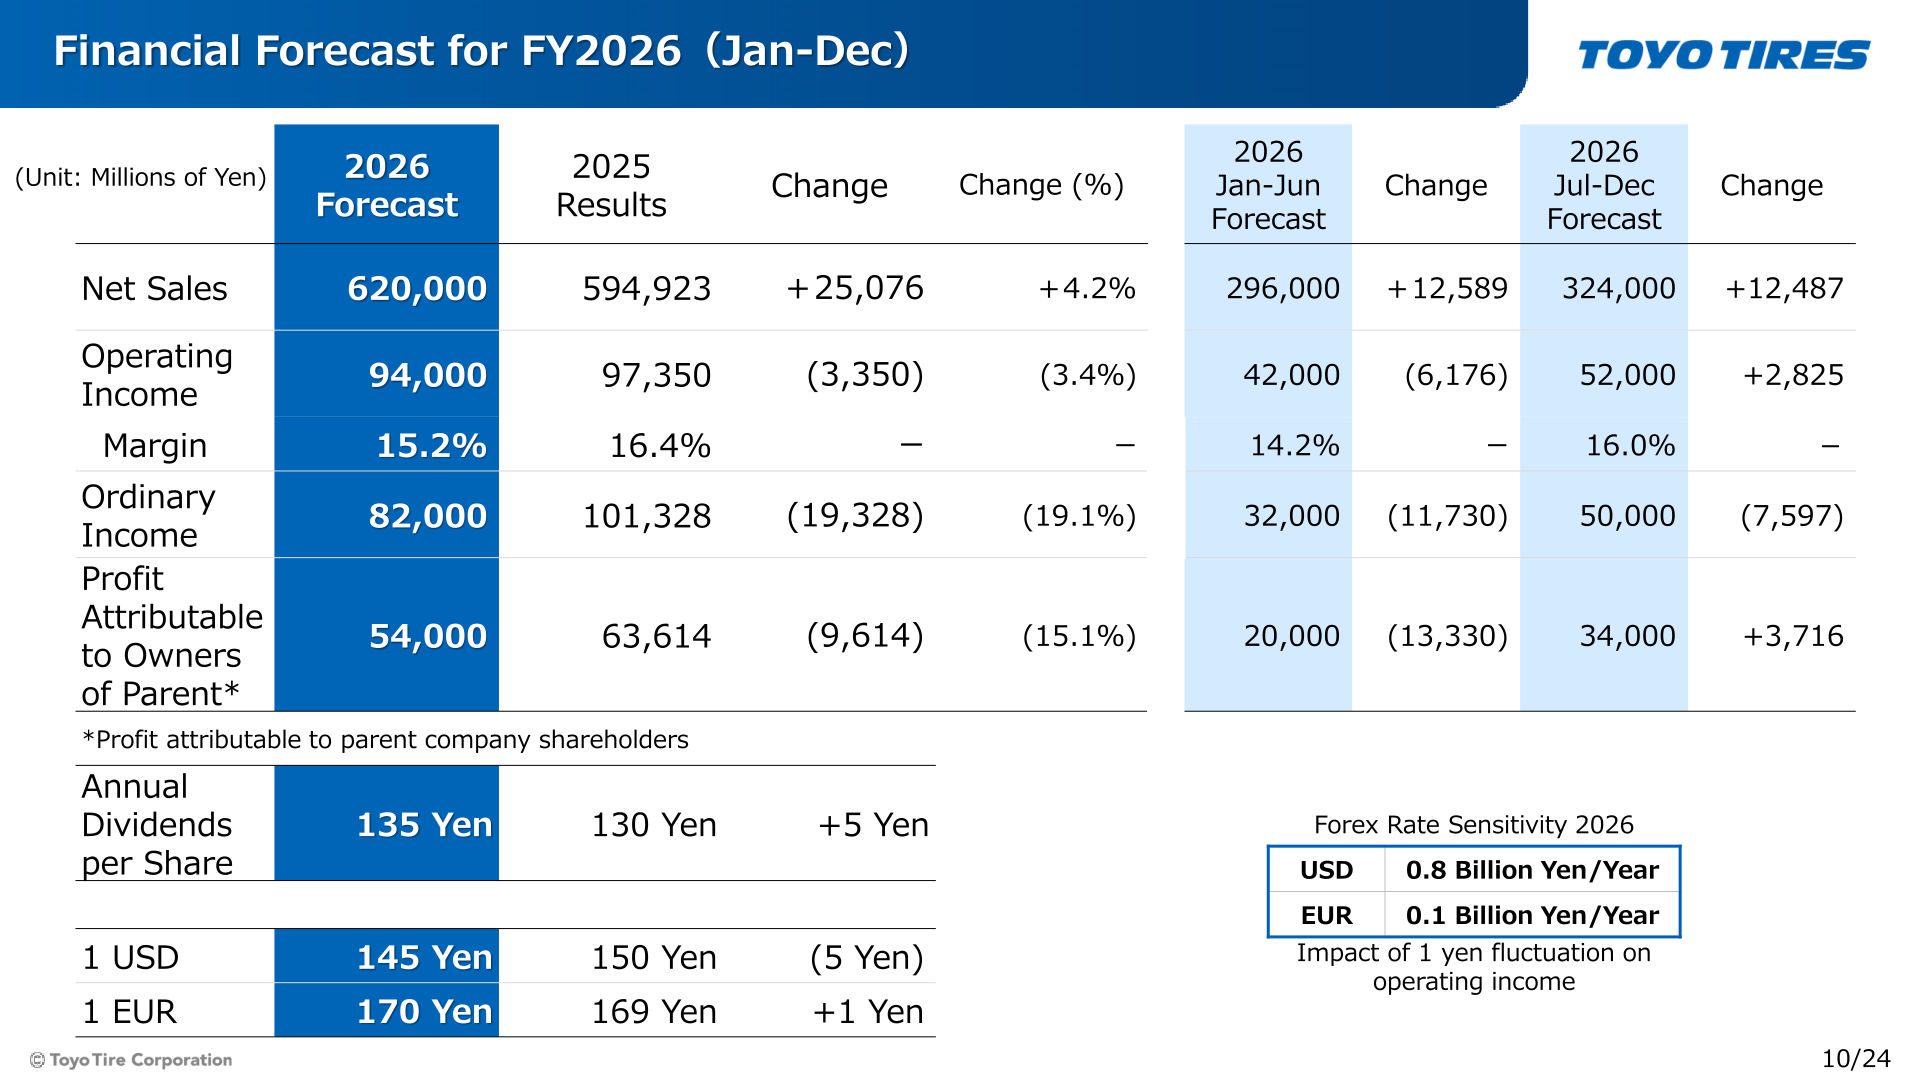
| Annual Dividends per Share | 130 Yen | 120 Yen | +10 Yen | — |
Segment Results
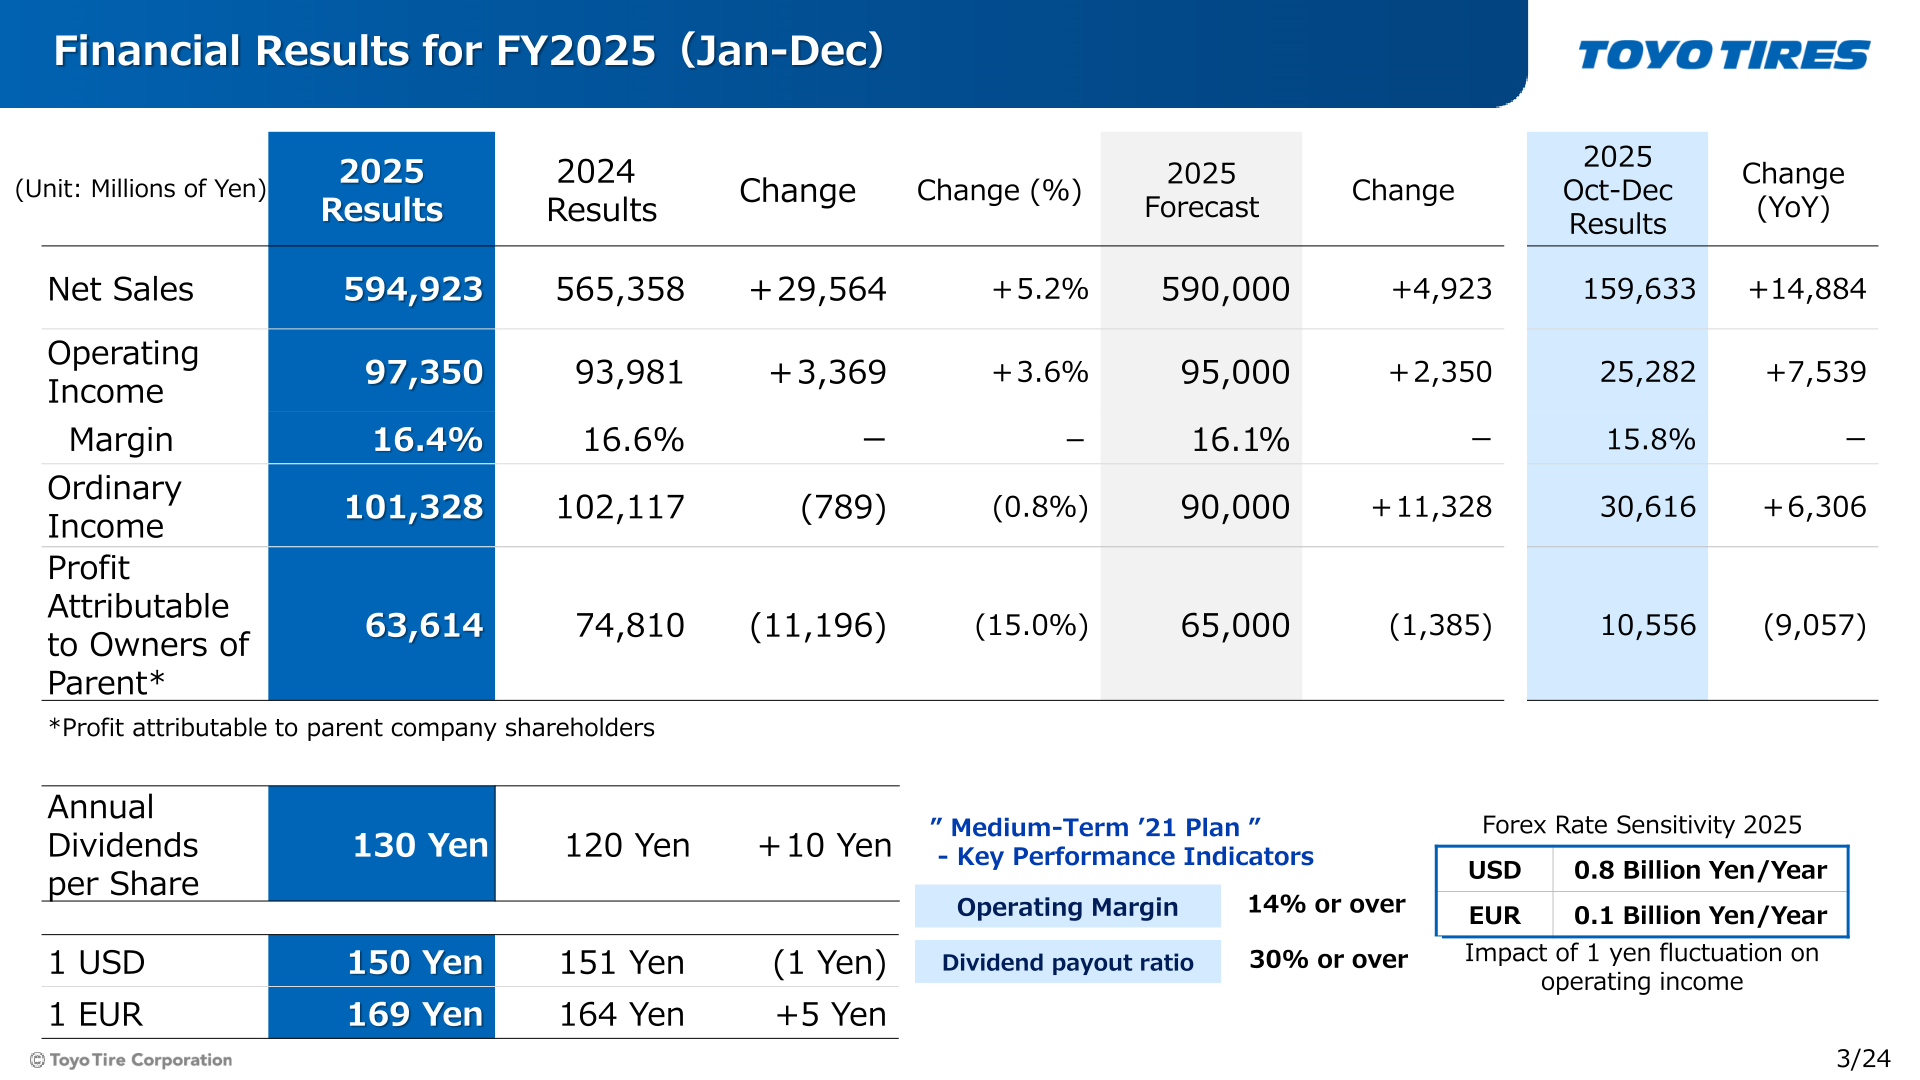
The Tires segment posted net sales of 547,697 million yen, up 5.4% year on year, and operating income of 95,509 million yen, up 3.7%, for a segment margin of 17.4% against 17.7% a year earlier. Automotive Parts recorded net sales of 47,225 million yen, up 3.7%, and operating income of 1,821 million yen, down 3.1%, for a margin of 3.9% against 4.1%.
By geographic area, Japan net sales were 121,985 million yen with operating income of 64,094 million yen, up 6.0%. North America net sales were 403,915 million yen, up 8.3%, but operating income fell 17.8% to 17,989 million yen. Other regions posted net sales of 69,021 million yen, down 8.4%, with operating income up 86.2% to 15,559 million yen.
Tire production on a new rubber volume basis totaled 237.4 thousand tons in 2025 against 230.9 thousand tons in 2024, with a 2026 forecast of 247.9 thousand tons. Total tire sales quantity was 98 on a year-on-year index where the same period of the previous year equals 100, with a 2026 forecast of 106.
| Business Segment | Net Sales FY2025 | Net Sales FY2024 | Operating Income FY2025 | Operating Income FY2024 |
|---|---|---|---|---|
| Tires | 547,697 | 519,832 | 95,509 | 92,089 |
| Automotive Parts | 47,225 | 45,526 | 1,821 | 1,880 |
| Other | — | 0 | 19 | 10 |
| Total | 594,923 | 565,358 | 97,350 | 93,981 |
| Geographic Area | Net Sales FY2025 | Net Sales FY2024 | Operating Income FY2025 | Operating Income FY2024 |
|---|---|---|---|---|
| Japan | 121,985 | 116,911 | 64,094 | 60,462 |
| N.America | 403,915 | 373,099 | 17,989 | 21,891 |
| Other | 69,021 | 75,348 | 15,559 | 8,355 |
| Eliminations or Adjustments | — | — | (293) | 3,271 |
| Total | 594,923 | 565,358 | 97,350 | 93,981 |
FY2026 Forecast
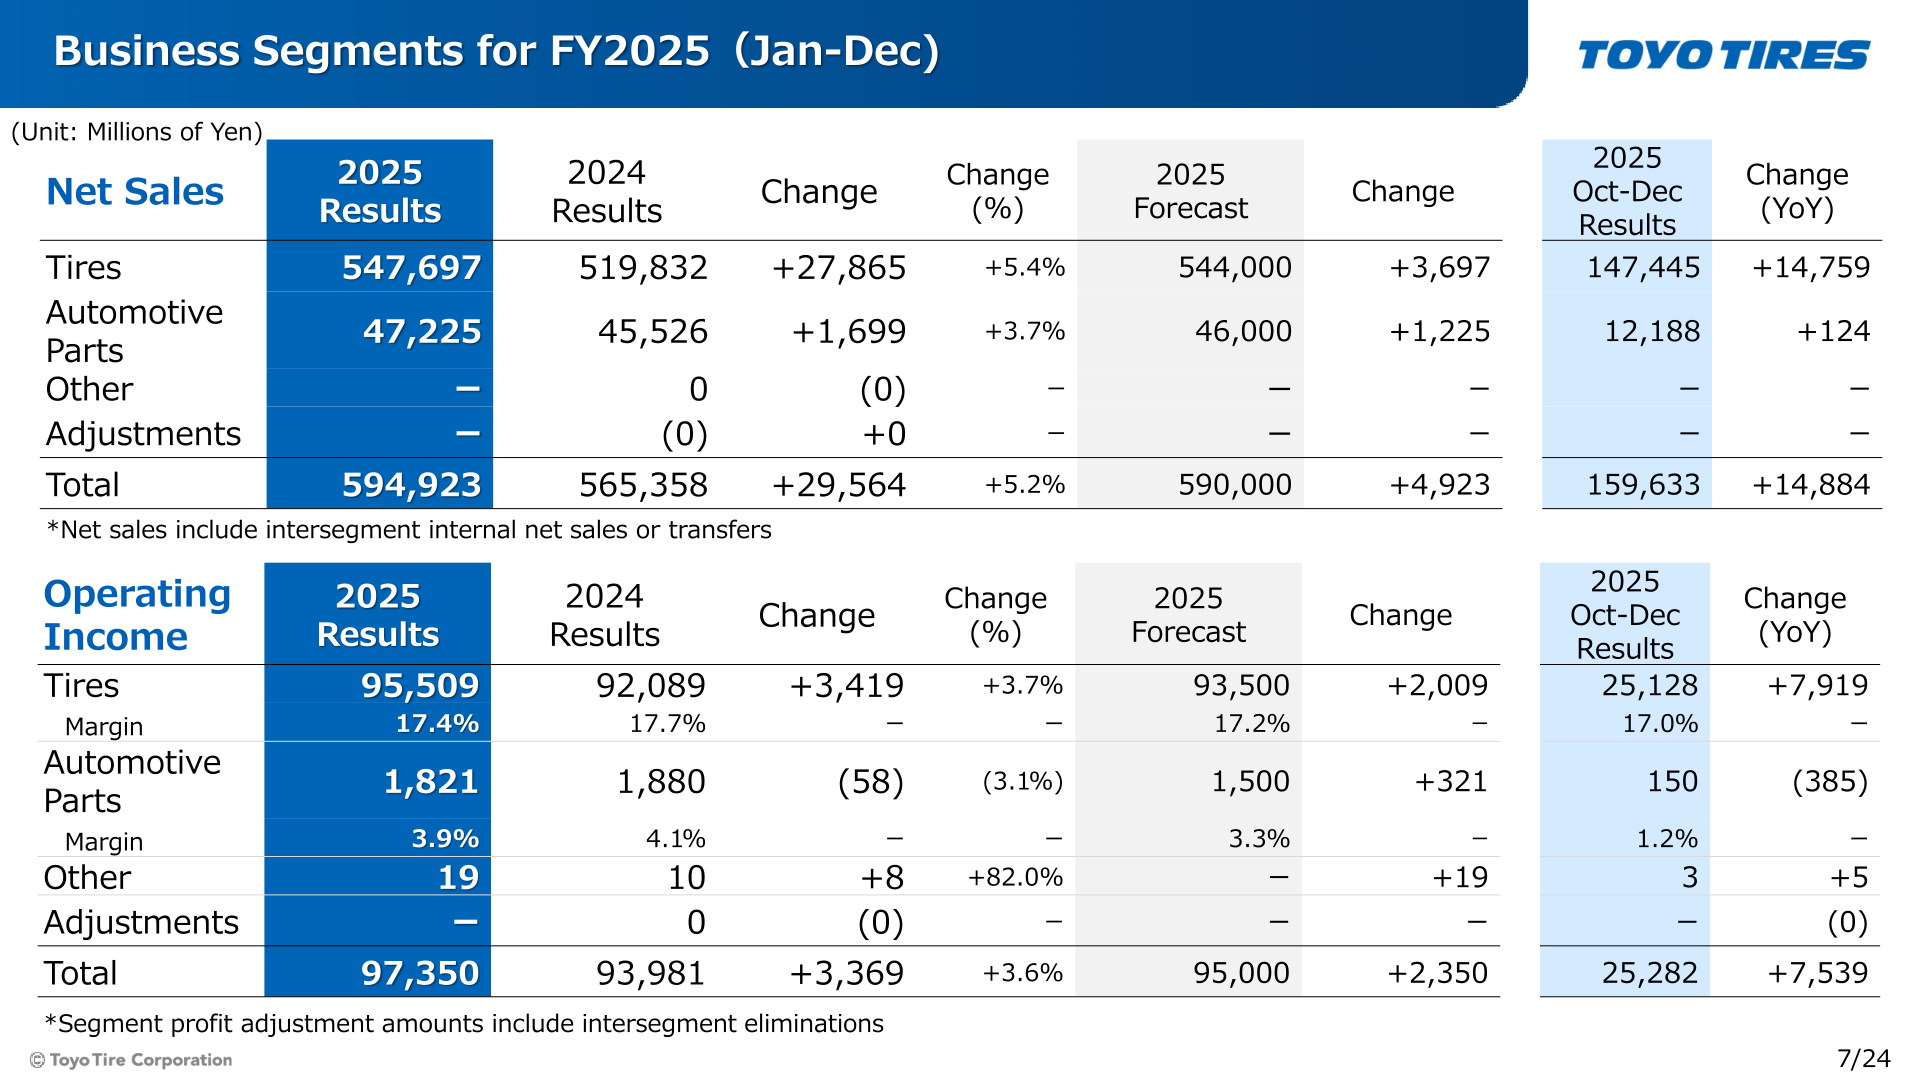
For FY2026 (January-December 2026) the company forecasts net sales of 620,000 million yen, up 4.2%, operating income of 94,000 million yen, down 3.4%, ordinary income of 82,000 million yen, down 19.1%, and profit attributable to owners of parent of 54,000 million yen, down 15.1%. The forecast operating margin is 15.2%. The forecast assumes 145 yen to the US dollar and 170 yen to the euro. By half, the company projects net sales of 296,000 million yen and operating income of 42,000 million yen in January-June, and net sales of 324,000 million yen and operating income of 52,000 million yen in July-December.
By segment, Tires net sales are forecast at 574,000 million yen, up 4.8%, with operating income of 93,500 million yen, down 2.1%. Automotive Parts net sales are forecast at 46,000 million yen, down 2.6%, with operating income of 500 million yen, down 72.5%. By region, Japan operating income is forecast to rise 9.1% to 69,900 million yen while North America operating income is forecast to fall 37.2% to 11,300 million yen.
| Item | FY2026 Forecast | FY2025 Results | Change | Change (%) |
|---|---|---|---|---|
| Net Sales | 620,000 | 594,923 | +25,076 | +4.2% |
| Operating Income | 94,000 | 97,350 | (3,350) | (3.4%) |
| Operating Margin | 15.2% | 16.4% | — | — |
| Ordinary Income | 82,000 | 101,328 | (19,328) | (19.1%) |
| Profit Attributable to Owners of Parent | 54,000 | 63,614 | (9,614) | (15.1%) |
| Annual Dividends per Share | 135 Yen | 130 Yen | +5 Yen | — |
Shareholder Returns
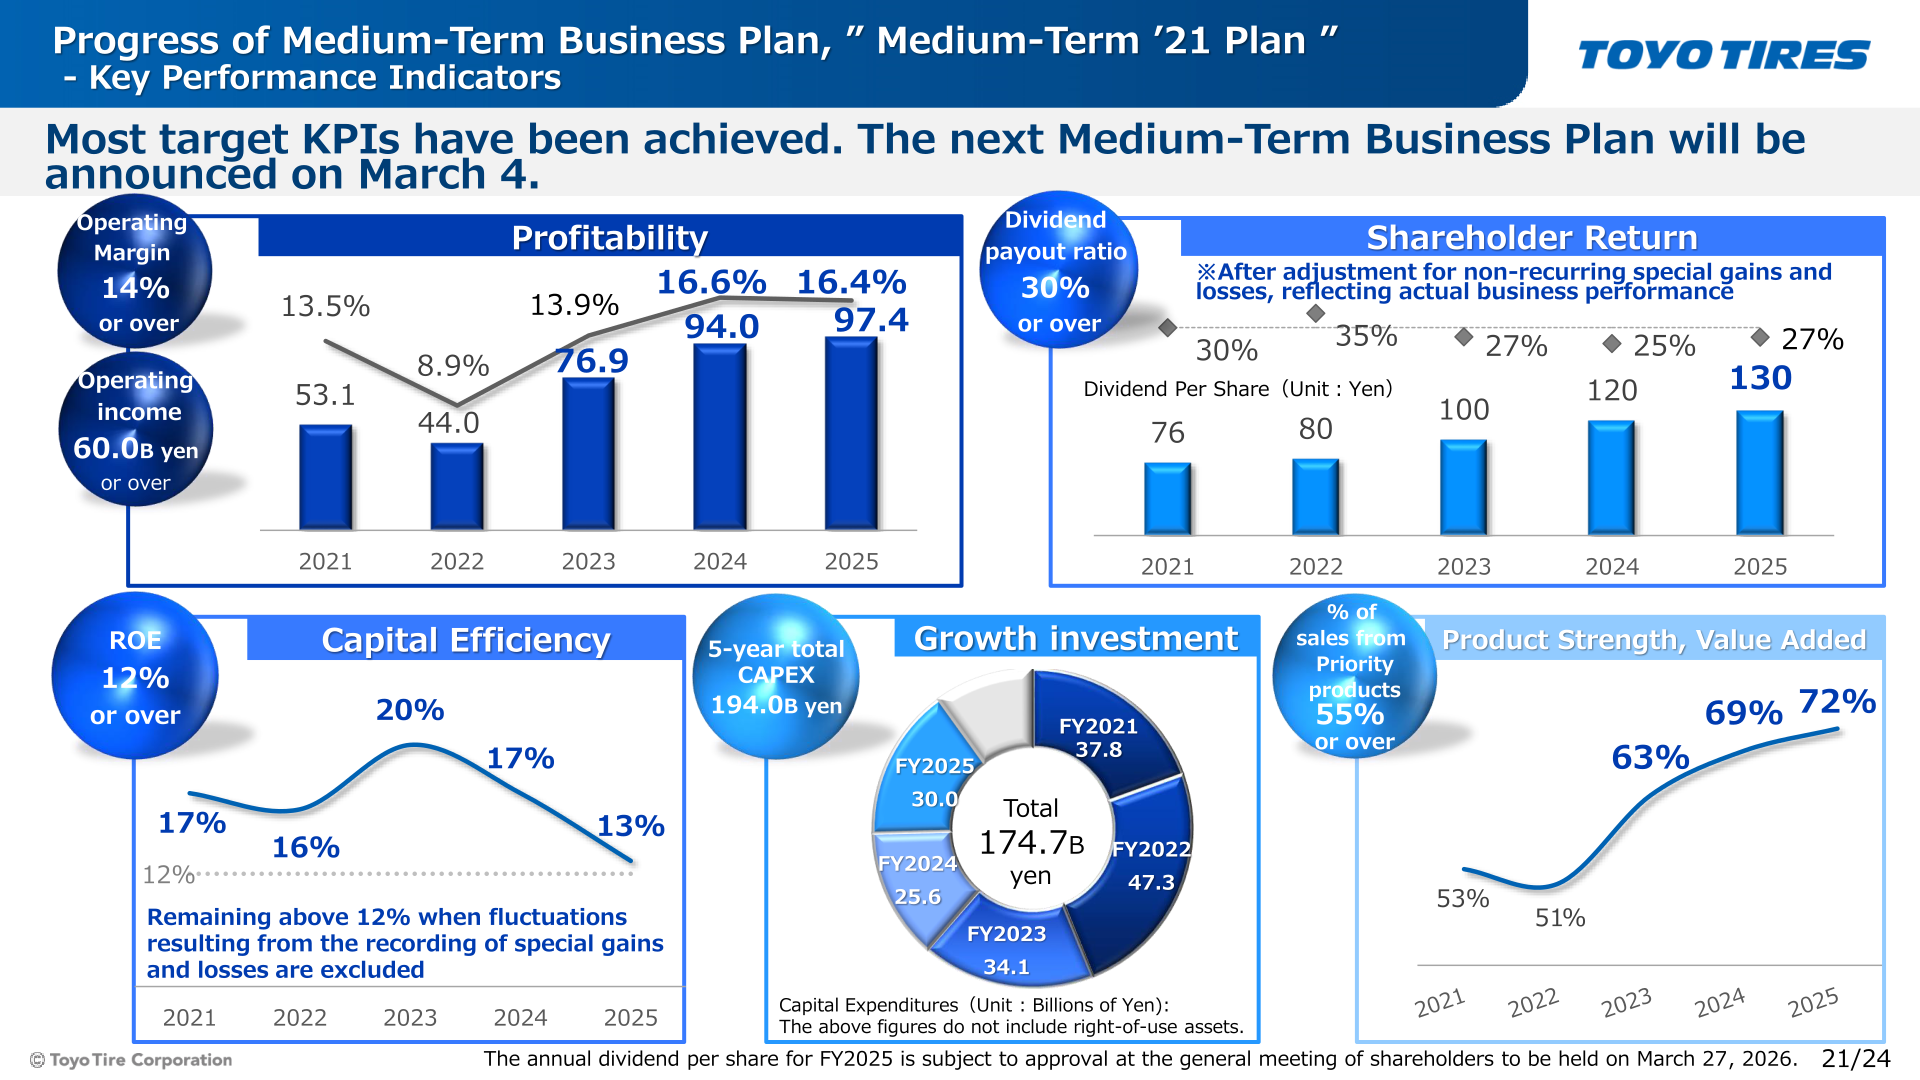
The annual dividend per share for FY2025 is 130 yen, up 10 yen year on year and including a 5 yen 80th anniversary commemorative dividend. The dividend is subject to approval at the general meeting of shareholders to be held on March 27, 2026. Dividends per share have risen from 76 yen in 2021 to 80 yen in 2022, 100 yen in 2023, 120 yen in 2024 and 130 yen in 2025. For FY2026 the company forecasts a further increase to 135 yen. A dividend payout ratio of 30% or over is one of the key performance indicators of the Medium-Term ’21 Plan.
Medium-Term Plan, Capital Efficiency and Financial Position
The company states that most target KPIs of the Medium-Term ’21 Plan have been achieved, and that the next Medium-Term Business Plan will be announced on March 4. The plan’s key performance indicators are an operating margin of 14% or over, operating income of 60.0 billion yen or over, ROE of 12% or over, a dividend payout ratio of 30% or over, five-year total capital expenditure of 194.0 billion yen and a ratio of sales from priority products of 55% or over.
Under the plan’s business structure reform, the company closed the Silverstone plant in Malaysia, ramped up capacity at the U.S. plant and began full-scale operations (Phase V, 2nd step), brought the Serbia Plant into operation, consolidated European sales bases in Serbia, transferred equity interests in a production subsidiary in China (de-consolidation) and closed the automotive parts plant in the U.S. The automotive parts business achieved profitability ahead of schedule, and the ratio of priority products to total sales exceeded 70% in Japan.
ROE was 12.8% in 2025, against 17.2% in 2024, 20.2% in 2023, 16.0% in 2022 and 16.5% in 2021. The company notes that ROE fluctuates widely due to the recording of extraordinary gains and losses but remains high partly because of consistently strong operating income. The P/B ratio was 1.3 in 2025, exceeding 1.0. At the end of 2025 the capital ratio was 69.4%, the D/E ratio was 0.18 and the net D/E ratio was △0.05. Net cash provided by operating activities was 93.1 billion yen and free cash flow was 70.0 billion yen in 2025. Capital investment was 30.0 billion yen in 2025, with a 2026 plan of 49.0 billion yen.
This article is an analysis based on publicly available information and is not a recommendation to buy or sell any specific securities. Investment decisions are your own responsibility.
![[Obayashi] Investors’ Guide 2026 — The Complete 24-Article Breakdown](https://japan-equity.com/wp-content/uploads/2026/07/hub_cover-1024x1024.png)
![[Obayashi] IR & SR Policy — Feeding Dialogue Back into Management](https://japan-equity.com/wp-content/uploads/2026/07/p32_sq-1024x1024.jpg)
![[Obayashi] Domestic Civil Engineering — Resilience Spending Supports 9.6% Margin](https://japan-equity.com/wp-content/uploads/2026/07/p11_sq-1024x1024.jpg)
![[Obayashi] Overseas Construction — Orders Reach ¥1.2tn](https://japan-equity.com/wp-content/uploads/2026/07/p15_sq-1024x1024.jpg)
![[Obayashi] Share Price & External Ratings — vs TOPIX, ESG Index Inclusion](https://japan-equity.com/wp-content/uploads/2026/07/p40_sq-1024x1024.jpg)
![[Construction] ¥75.5tn Investment, Shrinking Workforce — Big-5 Market Share](https://japan-equity.com/wp-content/uploads/2026/07/p12_sq-1024x1024.jpg)



![[Obayashi] Capital Policy & Shareholder Returns — ROE 10%+, DOE ~5%, ¥100bn Buyback](https://japan-equity.com/wp-content/uploads/2026/07/p27_sq-1024x1024.jpg)
![[Obayashi] Reducing Cross-Shareholdings — ¥285.2bn Sold in Five Years](https://japan-equity.com/wp-content/uploads/2026/07/p29_sq-1024x1024.jpg)
![[Obayashi] ¥750bn Investment Plan — ¥300bn to Development, ¥190bn to Tech/DX](https://japan-equity.com/wp-content/uploads/2026/07/p30_sq-1024x1024.jpg)
![[Obayashi] MTP2022 KPIs — Operating Profit ~2x Target, ROE 14.4%](https://japan-equity.com/wp-content/uploads/2026/07/p25_sq-1024x1024.jpg)
![[Obayashi] Cash Allocation — ¥420bn Investment CF Over Five Years](https://japan-equity.com/wp-content/uploads/2026/07/p26_sq-1024x1024.jpg)
![[Obayashi] Green Energy — 44 Plants, 344MW, and the Green Hydrogen Challenge](https://japan-equity.com/wp-content/uploads/2026/07/p21_sq-1024x1024.jpg)
![[Obayashi] Tackling the Labor Shortage — Robotics Construction®](https://japan-equity.com/wp-content/uploads/2026/07/p14_sq-1024x1024.jpg)
