
This article is based on publicly available IR materials and is not a recommendation to buy or sell any specific securities.
The Yokohama Rubber Co., Ltd. posted record results for FY2025 (January-December 2025). Sales revenue rose 12.8% year on year to 1,235.0 billion yen, business profit rose 24.0% to 166.6 billion yen, and profit attributable to owners of parent rose 40.7% to 105.4 billion yen. The company describes FY2025 as its fifth straight year of sales and profit growth, delivering record highs in sales revenue, business profit, business profit margin, operating profit, net profit and ROE. For FY2026 it forecasts sales revenue of 1,300.0 billion yen and business profit of 188.0 billion yen.
Consolidated Results (Full-Year Actual)
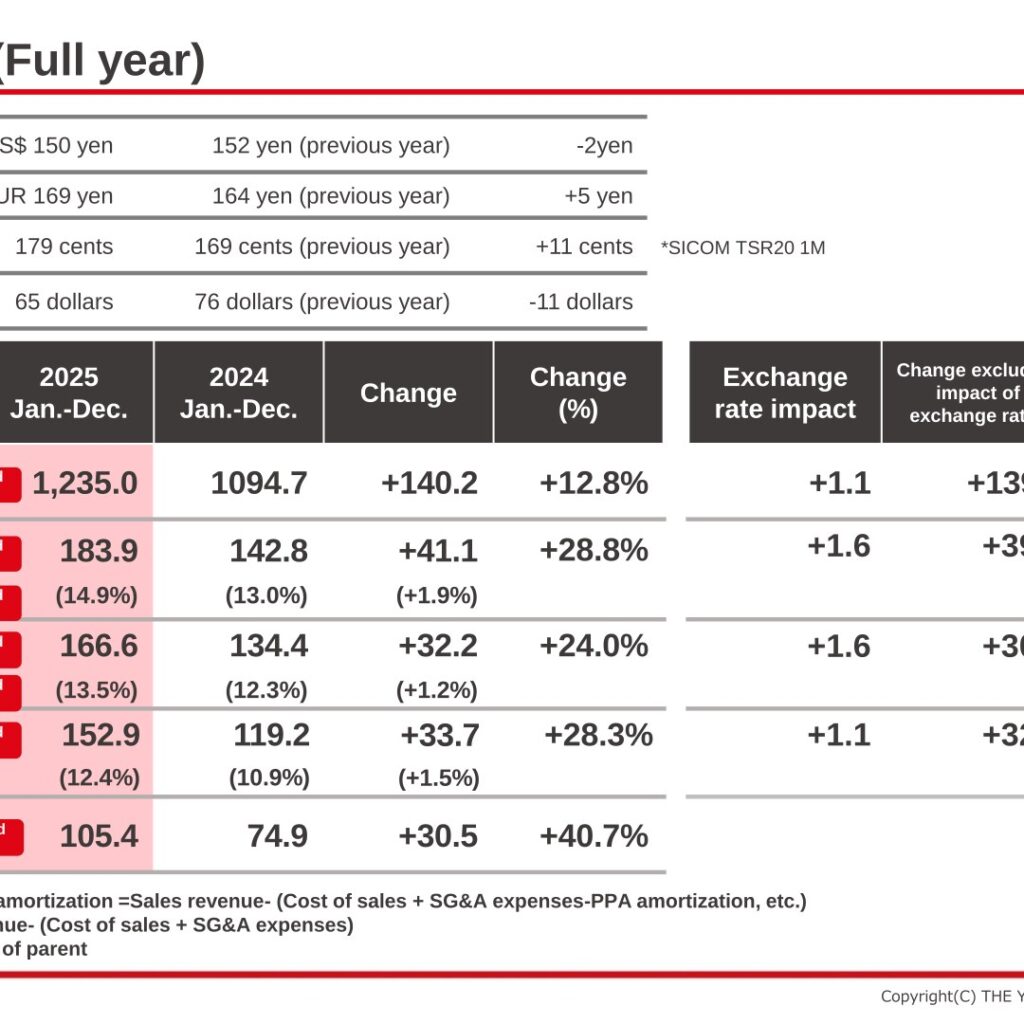
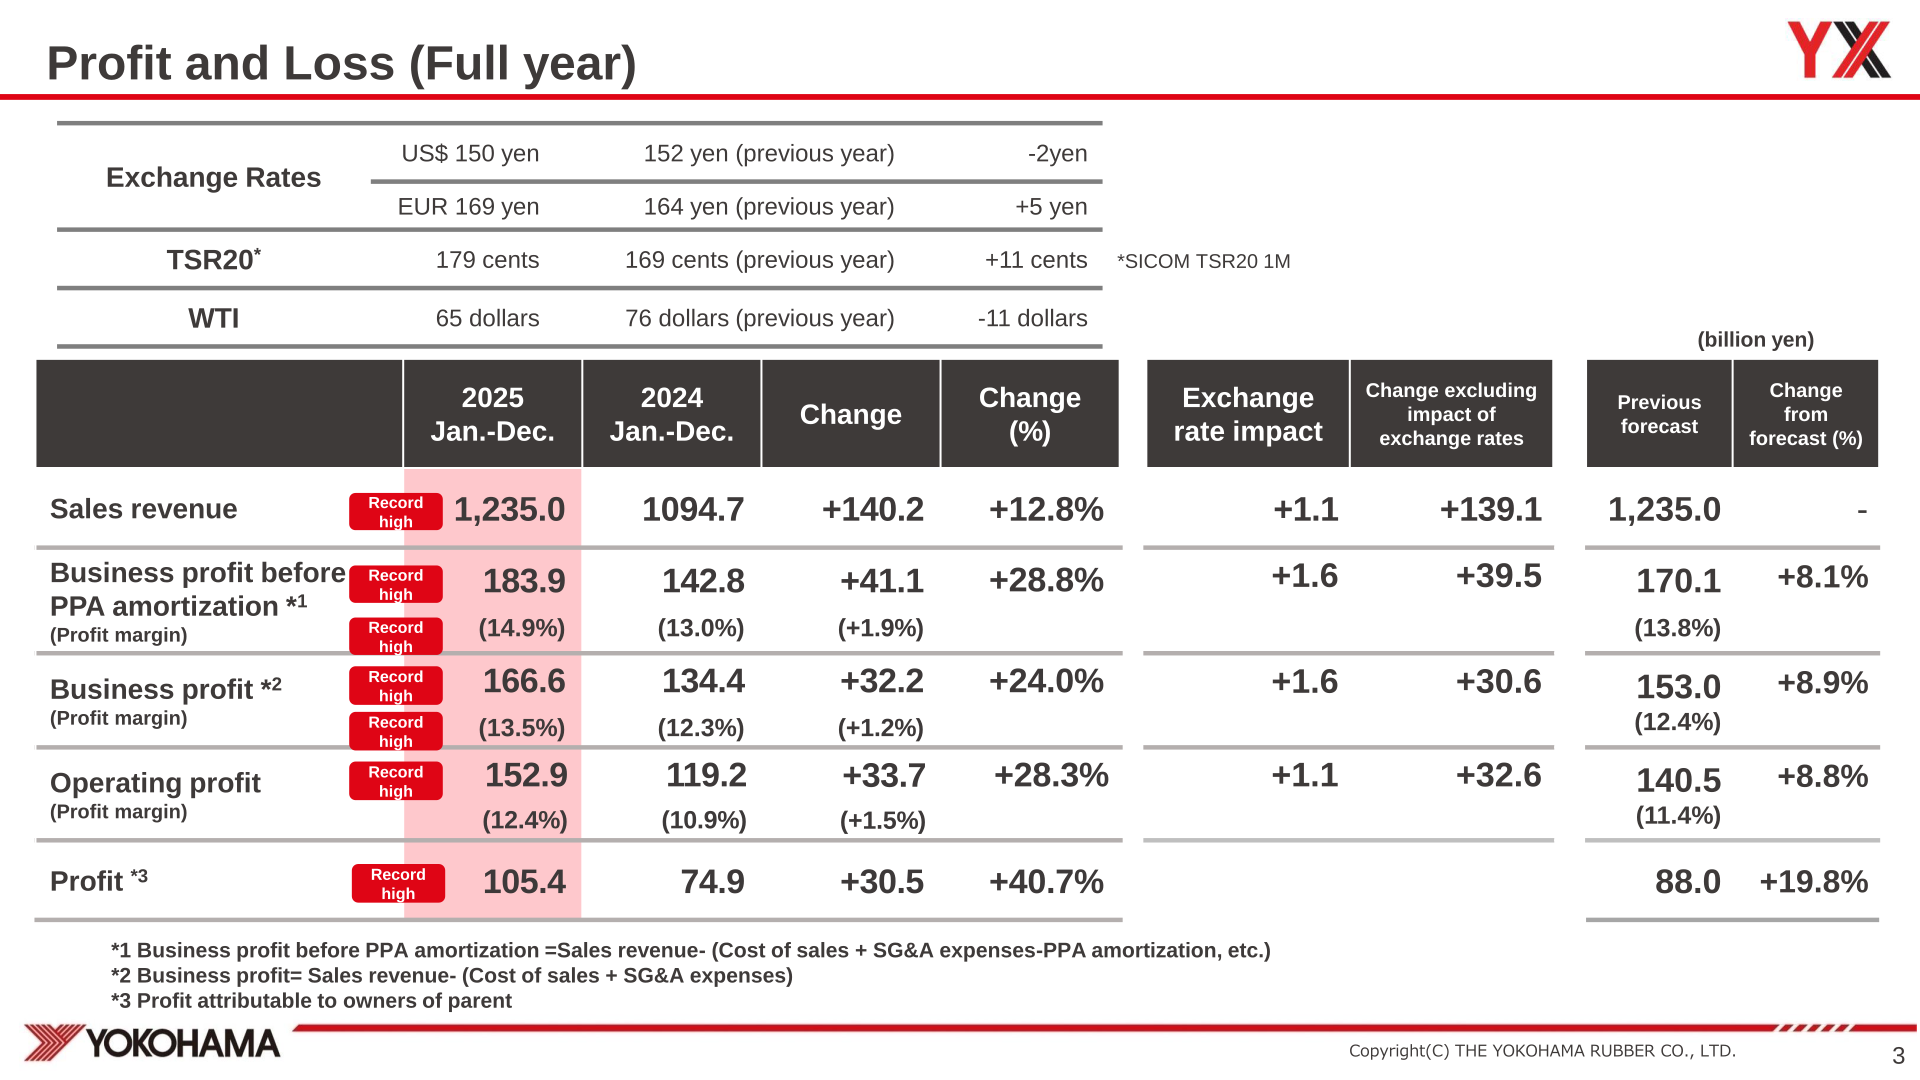
Figures are in billion yen for the twelve months from January to December. Every line shown below was flagged as a record high in the briefing material. Results also came in ahead of the previous forecast: business profit of 166.6 billion yen was 8.9% above the 153.0 billion yen previously forecast, operating profit of 152.9 billion yen was 8.8% above the 140.5 billion yen forecast, and profit of 105.4 billion yen was 19.8% above the 88.0 billion yen forecast, while sales revenue matched the 1,235.0 billion yen forecast. Average exchange rates were US$ 150 yen (152 yen in the previous year, -2 yen) and EUR 169 yen (164 yen, +5 yen); TSR20 averaged 179 cents (169 cents, +11 cents) and WTI 65 dollars (76 dollars, -11 dollars).
| Item | 2025 Jan.-Dec. | 2024 Jan.-Dec. | Change | Change (%) |
|---|---|---|---|---|
| Sales revenue | 1,235.0 | 1,094.7 | +140.2 | +12.8% |
| Business profit before PPA amortization | 183.9 | 142.8 | +41.1 | +28.8% |
| (Profit margin) | (14.9%) | (13.0%) | (+1.9%) | – |
| Business profit | 166.6 | 134.4 | +32.2 | +24.0% |
| (Profit margin) | (13.5%) | (12.3%) | (+1.2%) | – |
| Operating profit | 152.9 | 119.2 | +33.7 | +28.3% |
| (Profit margin) | (12.4%) | (10.9%) | (+1.5%) | – |
| Profit attributable to owners of parent | 105.4 | 74.9 | +30.5 | +40.7% |
Segment Results
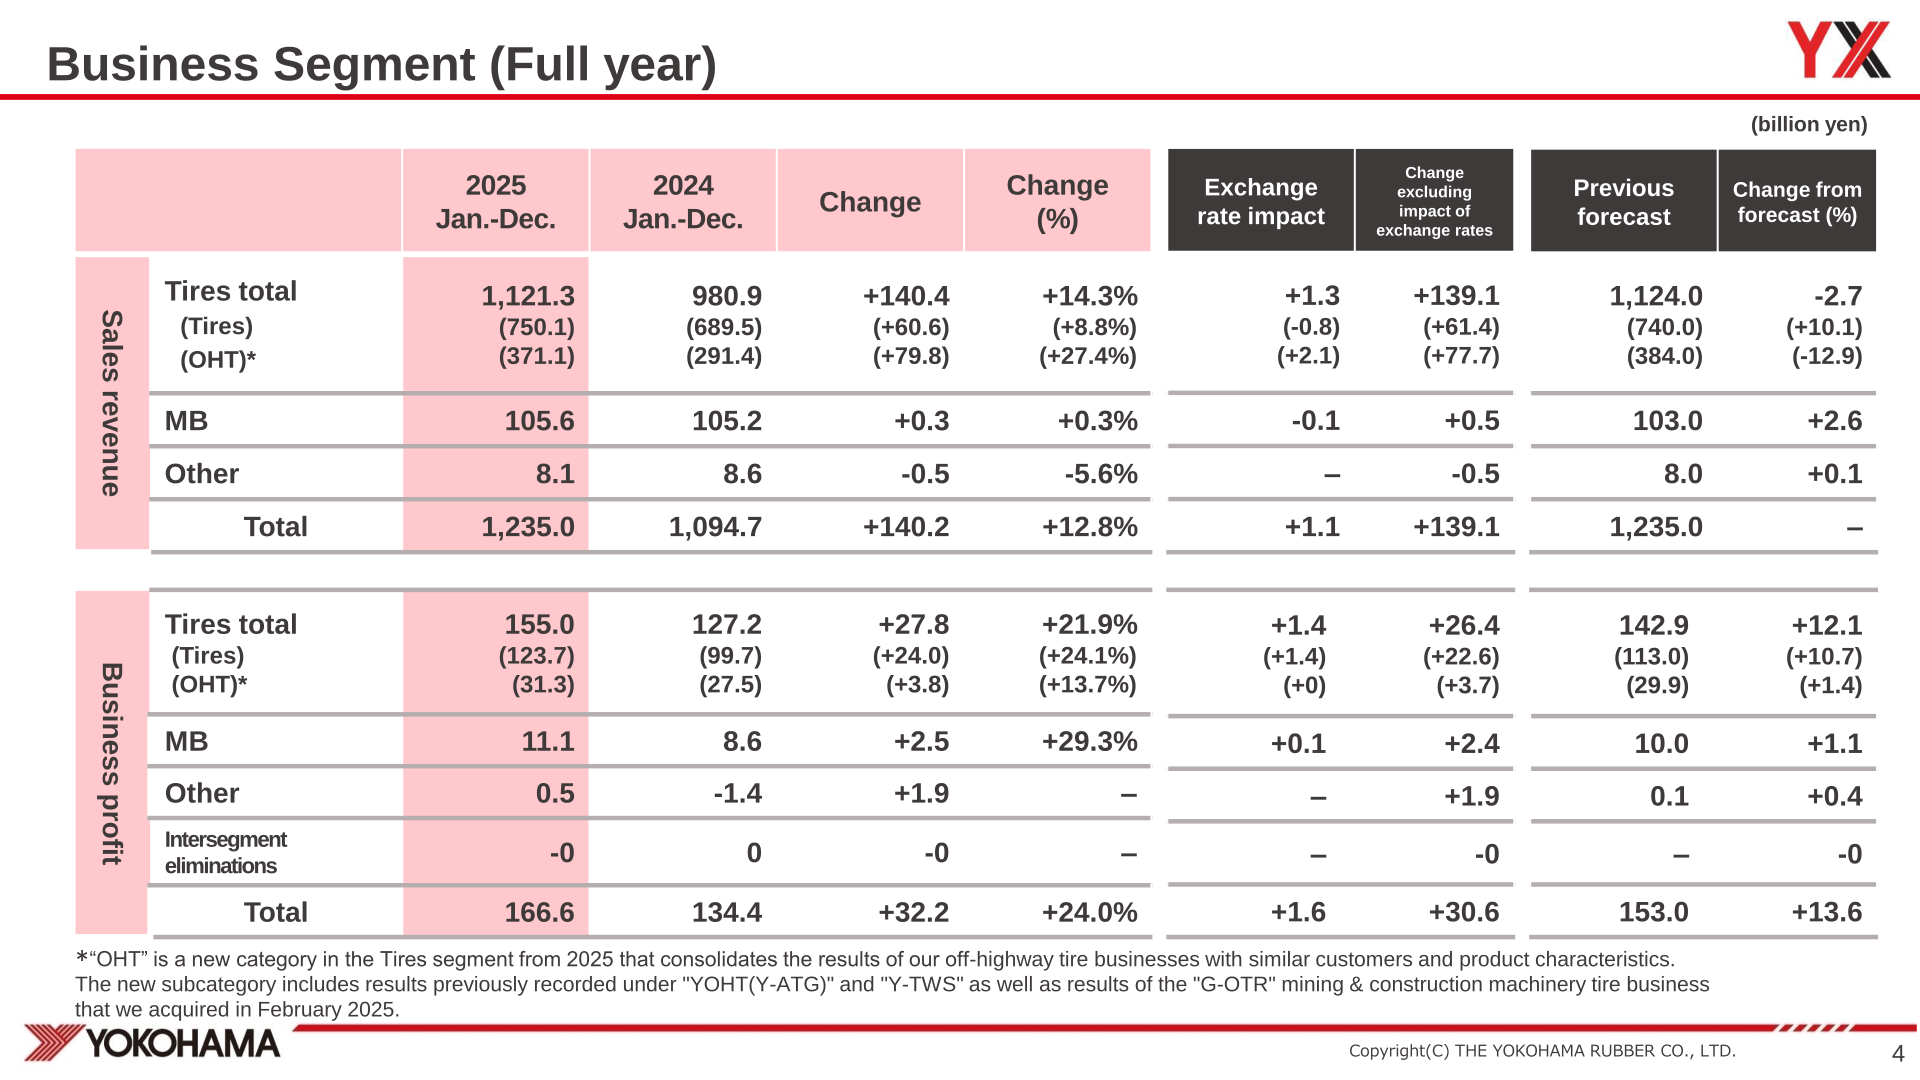
Tires total sales revenue grew 14.3% to 1,121.3 billion yen, split between Tires at 750.1 billion yen (+8.8%) and OHT at 371.1 billion yen (+27.4%). Tires total business profit rose 21.9% to 155.0 billion yen. The MB segment lifted business profit 29.3% to 11.1 billion yen on broadly flat sales revenue of 105.6 billion yen. OHT is a new subcategory within the Tires segment from 2025 that consolidates the off-highway tire businesses previously reported as YOHT (Y-ATG) and Y-TWS together with the G-OTR mining and construction machinery tire business acquired in February 2025. In the factor analysis of the 32.2 billion yen increase in business profit, Tires total contributed +31.7 billion yen, and MB / Other / acquisition one-time costs +0.5 billion yen.
| Segment | Metric | 2025 Jan.-Dec. | 2024 Jan.-Dec. | Change (%) |
|---|---|---|---|---|
| Tires total | Sales revenue | 1,121.3 | 980.9 | +14.3% |
| (Tires) | Sales revenue | 750.1 | 689.5 | +8.8% |
| (OHT) | Sales revenue | 371.1 | 291.4 | +27.4% |
| MB | Sales revenue | 105.6 | 105.2 | +0.3% |
| Other | Sales revenue | 8.1 | 8.6 | -5.6% |
| Total | Sales revenue | 1,235.0 | 1,094.7 | +12.8% |
| Tires total | Business profit | 155.0 | 127.2 | +21.9% |
| (Tires) | Business profit | 123.7 | 99.7 | +24.1% |
| (OHT) | Business profit | 31.3 | 27.5 | +13.7% |
| MB | Business profit | 11.1 | 8.6 | +29.3% |
| Other | Business profit | 0.5 | -1.4 | – |
| Intersegment eliminations | Business profit | -0 | 0 | – |
| Total | Business profit | 166.6 | 134.4 | +24.0% |
Financial Position and Cash Flows
Total assets stood at 1,998.4 billion yen at December 31, 2025, up 262.8 billion yen from a year earlier, and equity was 1,040.2 billion yen, up 136.2 billion yen. Interest-bearing debt (excluding lease liabilities) rose 97.7 billion yen to 535.8 billion yen, taking the D/E ratio to 0.52 and the net D/E ratio to 0.42. The ratio of equity attributable to owners of parent was 51.6% and ROE was 11.0%, up 1.8 points. Cash flow from operating activities was 135.6 billion yen (158.0 billion yen excluding the tax impact of gains from the sale of cross-shareholdings, etc.), cash flow from investing activities was -241.3 billion yen and free cash flow was -105.7 billion yen; the closing balance of cash and cash equivalents was 107.4 billion yen.
FY2026 Forecast
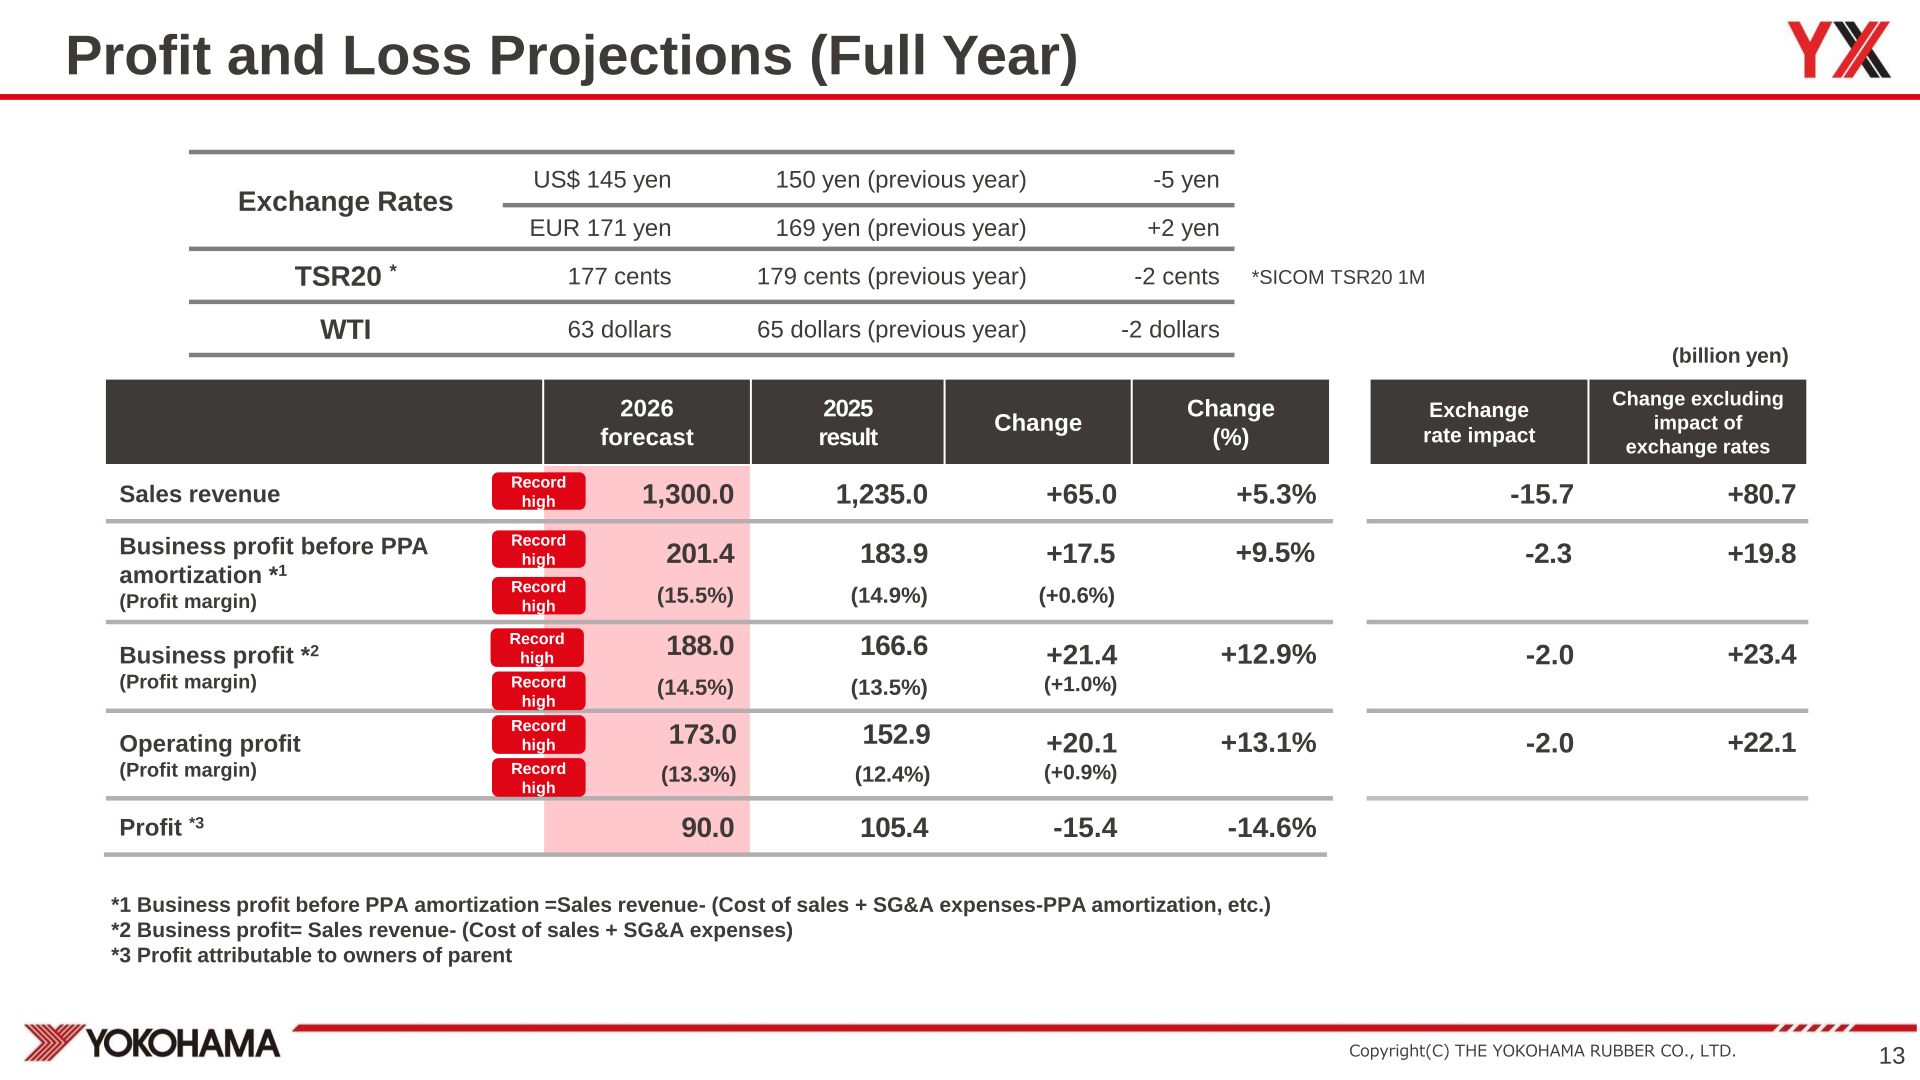
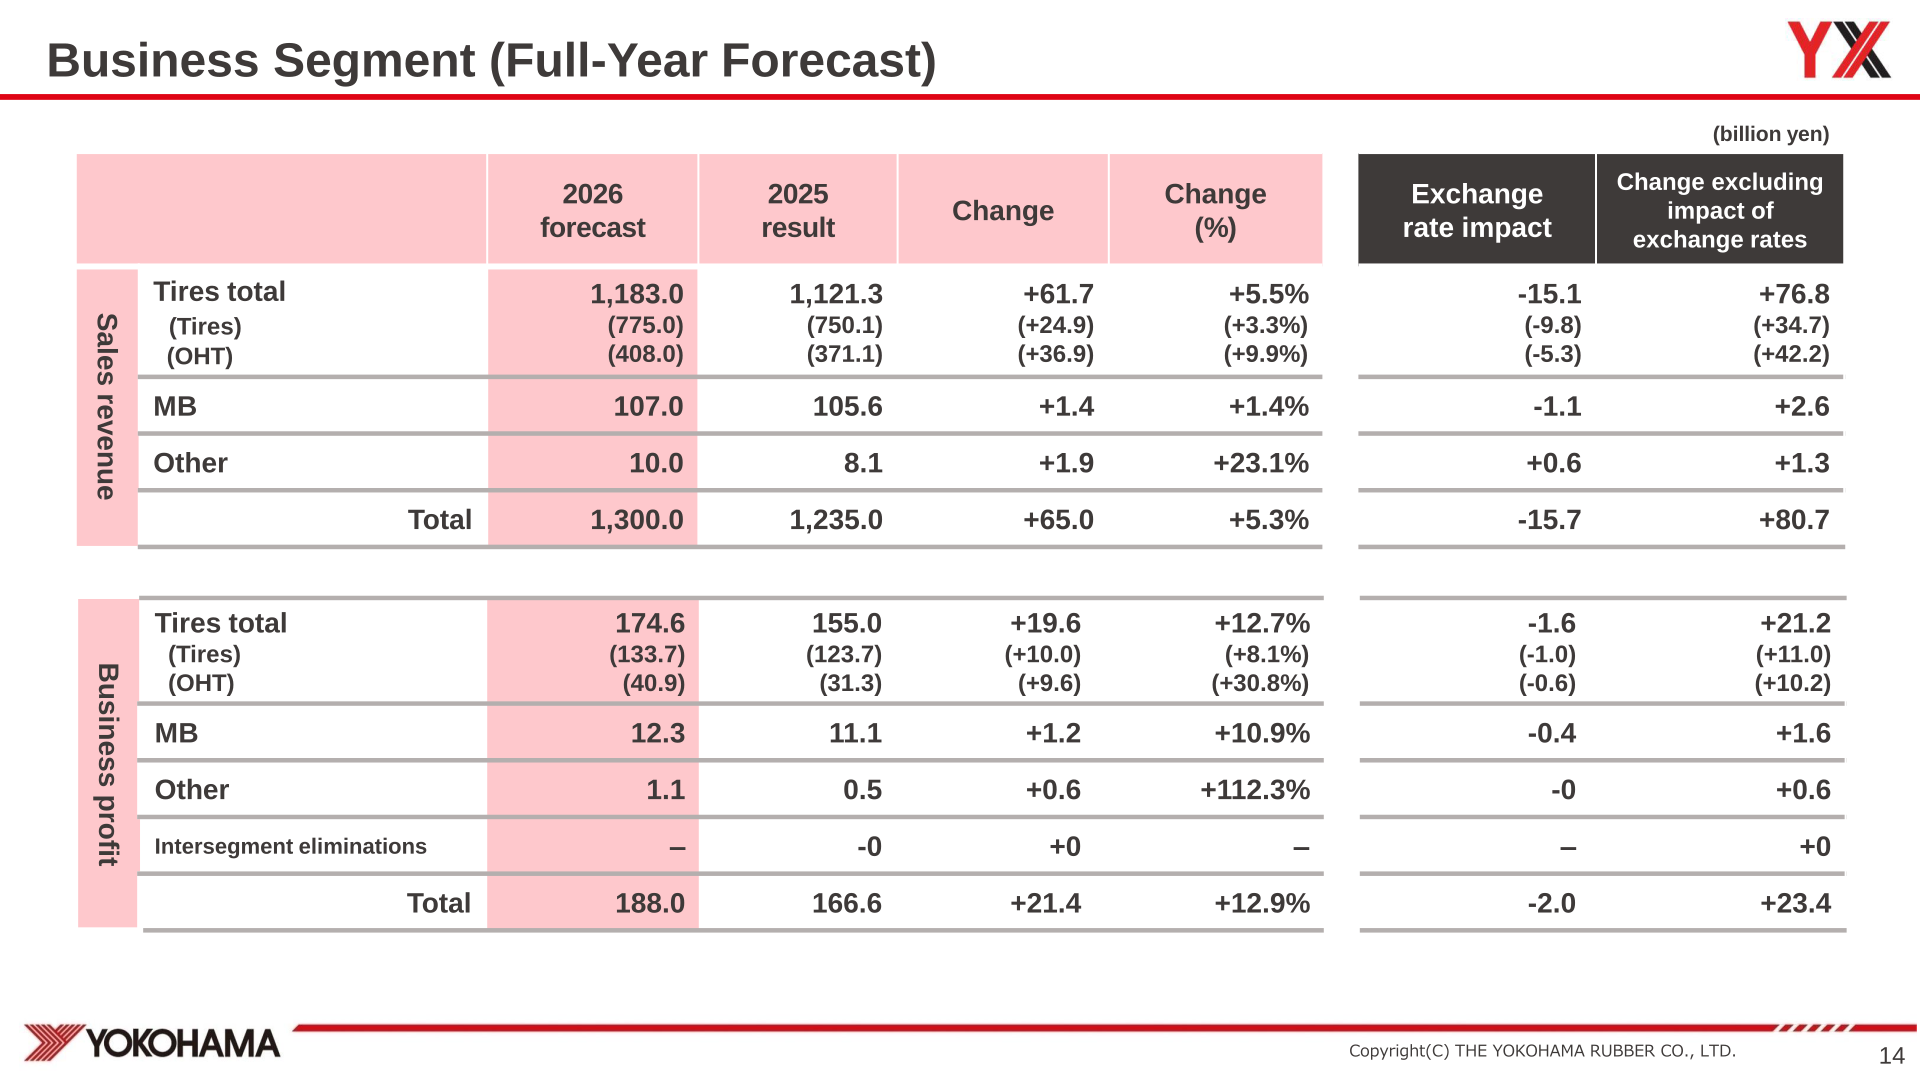
For FY2026 the company projects sales revenue of 1,300.0 billion yen (+5.3%) and business profit of 188.0 billion yen (+12.9%), which would be a sixth consecutive year of sales and profit growth. Profit attributable to owners of parent is forecast at 90.0 billion yen, down 14.6%. Assumed exchange rates are US$ 145 yen (-5 yen) and EUR 171 yen (+2 yen), with TSR20 at 177 cents (-2 cents) and WTI at 63 dollars (-2 dollars). By segment, Tires total sales revenue is forecast at 1,183.0 billion yen (Tires 775.0 billion yen, OHT 408.0 billion yen) and Tires total business profit at 174.6 billion yen (Tires 133.7 billion yen, OHT 40.9 billion yen).
| Item | 2026 forecast | 2025 result | Change | Change (%) |
|---|---|---|---|---|
| Sales revenue | 1,300.0 | 1,235.0 | +65.0 | +5.3% |
| Business profit before PPA amortization | 201.4 | 183.9 | +17.5 | +9.5% |
| (Profit margin) | (15.5%) | (14.9%) | (+0.6%) | – |
| Business profit | 188.0 | 166.6 | +21.4 | +12.9% |
| (Profit margin) | (14.5%) | (13.5%) | (+1.0%) | – |
| Operating profit | 173.0 | 152.9 | +20.1 | +13.1% |
| (Profit margin) | (13.3%) | (12.4%) | (+0.9%) | – |
| Profit attributable to owners of parent | 90.0 | 105.4 | -15.4 | -14.6% |
Shareholder Returns
The dividend per share for 2025 is 134 yen with a dividend payout ratio of 20% and a total return ratio of 26%; for 2026 the company plans 172 yen per share with a payout ratio of 30% and a total return ratio of 30%+. Its stated basic policy is: targeting a dividend payout ratio of 30% and a total return ratio of more than 30%, it aims for stable increases in shareholder dividends in line with profit growth, and it will also consider flexible share buybacks based on the status of its shareholders’ equity and available surplus funds. Under the YX2026 capital allocation update, shareholder return was raised to 64.5 billion yen from the 46.5 billion yen initial plan, an increase of 18.0 billion yen. (Source: Fiscal 2025 Financial Results Briefing – YX2026 Progress & Initiatives, P.20-21.)
| Item | 2025 | 2026 |
|---|---|---|
| Dividend (per share) | 134 yen | 172 yen |
| Dividend payout ratio | 20% | 30% |
| Total return ratio | 26% | 30%+ |
Medium-Term Plan and Topics
The company raised the FY2026 financial targets of its YX2026 medium-term management plan. Against an initial target (Feb. 2024) of 1,150 billion yen in sales revenue and 130 billion yen in business profit, and a pre-revision target (Aug. 2024) of 1,250 billion yen and 150 billion yen, the revised targets (Feb. 2026) are sales revenue of 1,300 billion yen, business profit of 188 billion yen and a business profit margin of 14.5%, with an equity capital ratio target of 50% and ROE above 10%. Management frames the tire business strategy as the Grand Design “Best Alternative,” noting that the addition of G-OTR to ATG and TWS strengthened the OHT business’s market resilience and that TWS acquisition synergies are contributing above the original plan. The next medium-term management plan, YX2029, is positioned as “Hockey Stick Growth” leading to sustainable growth. (Source: Fiscal 2025 Financial Results Briefing – YX2026 Progress & Initiatives, P.3, P.24, P.26.)
This article is an analysis based on publicly available information and is not a recommendation to buy or sell any specific securities. Investment decisions are your own responsibility.
![[Obayashi] Investors’ Guide 2026 — The Complete 24-Article Breakdown](https://japan-equity.com/wp-content/uploads/2026/07/hub_cover-1024x1024.png)
![[Obayashi] IR & SR Policy — Feeding Dialogue Back into Management](https://japan-equity.com/wp-content/uploads/2026/07/p32_sq-1024x1024.jpg)
![[Obayashi] Domestic Civil Engineering — Resilience Spending Supports 9.6% Margin](https://japan-equity.com/wp-content/uploads/2026/07/p11_sq-1024x1024.jpg)
![[Obayashi] Overseas Construction — Orders Reach ¥1.2tn](https://japan-equity.com/wp-content/uploads/2026/07/p15_sq-1024x1024.jpg)
![[Obayashi] Share Price & External Ratings — vs TOPIX, ESG Index Inclusion](https://japan-equity.com/wp-content/uploads/2026/07/p40_sq-1024x1024.jpg)
![[Construction] ¥75.5tn Investment, Shrinking Workforce — Big-5 Market Share](https://japan-equity.com/wp-content/uploads/2026/07/p12_sq-1024x1024.jpg)



![[Obayashi] Capital Policy & Shareholder Returns — ROE 10%+, DOE ~5%, ¥100bn Buyback](https://japan-equity.com/wp-content/uploads/2026/07/p27_sq-1024x1024.jpg)
![[Obayashi] Reducing Cross-Shareholdings — ¥285.2bn Sold in Five Years](https://japan-equity.com/wp-content/uploads/2026/07/p29_sq-1024x1024.jpg)
![[Obayashi] ¥750bn Investment Plan — ¥300bn to Development, ¥190bn to Tech/DX](https://japan-equity.com/wp-content/uploads/2026/07/p30_sq-1024x1024.jpg)
![[Obayashi] MTP2022 KPIs — Operating Profit ~2x Target, ROE 14.4%](https://japan-equity.com/wp-content/uploads/2026/07/p25_sq-1024x1024.jpg)
![[Obayashi] Cash Allocation — ¥420bn Investment CF Over Five Years](https://japan-equity.com/wp-content/uploads/2026/07/p26_sq-1024x1024.jpg)
![[Obayashi] Green Energy — 44 Plants, 344MW, and the Green Hydrogen Challenge](https://japan-equity.com/wp-content/uploads/2026/07/p21_sq-1024x1024.jpg)
![[Obayashi] Tackling the Labor Shortage — Robotics Construction®](https://japan-equity.com/wp-content/uploads/2026/07/p14_sq-1024x1024.jpg)
