
This article is based on publicly available IR materials and is not a recommendation to buy or sell any specific securities.
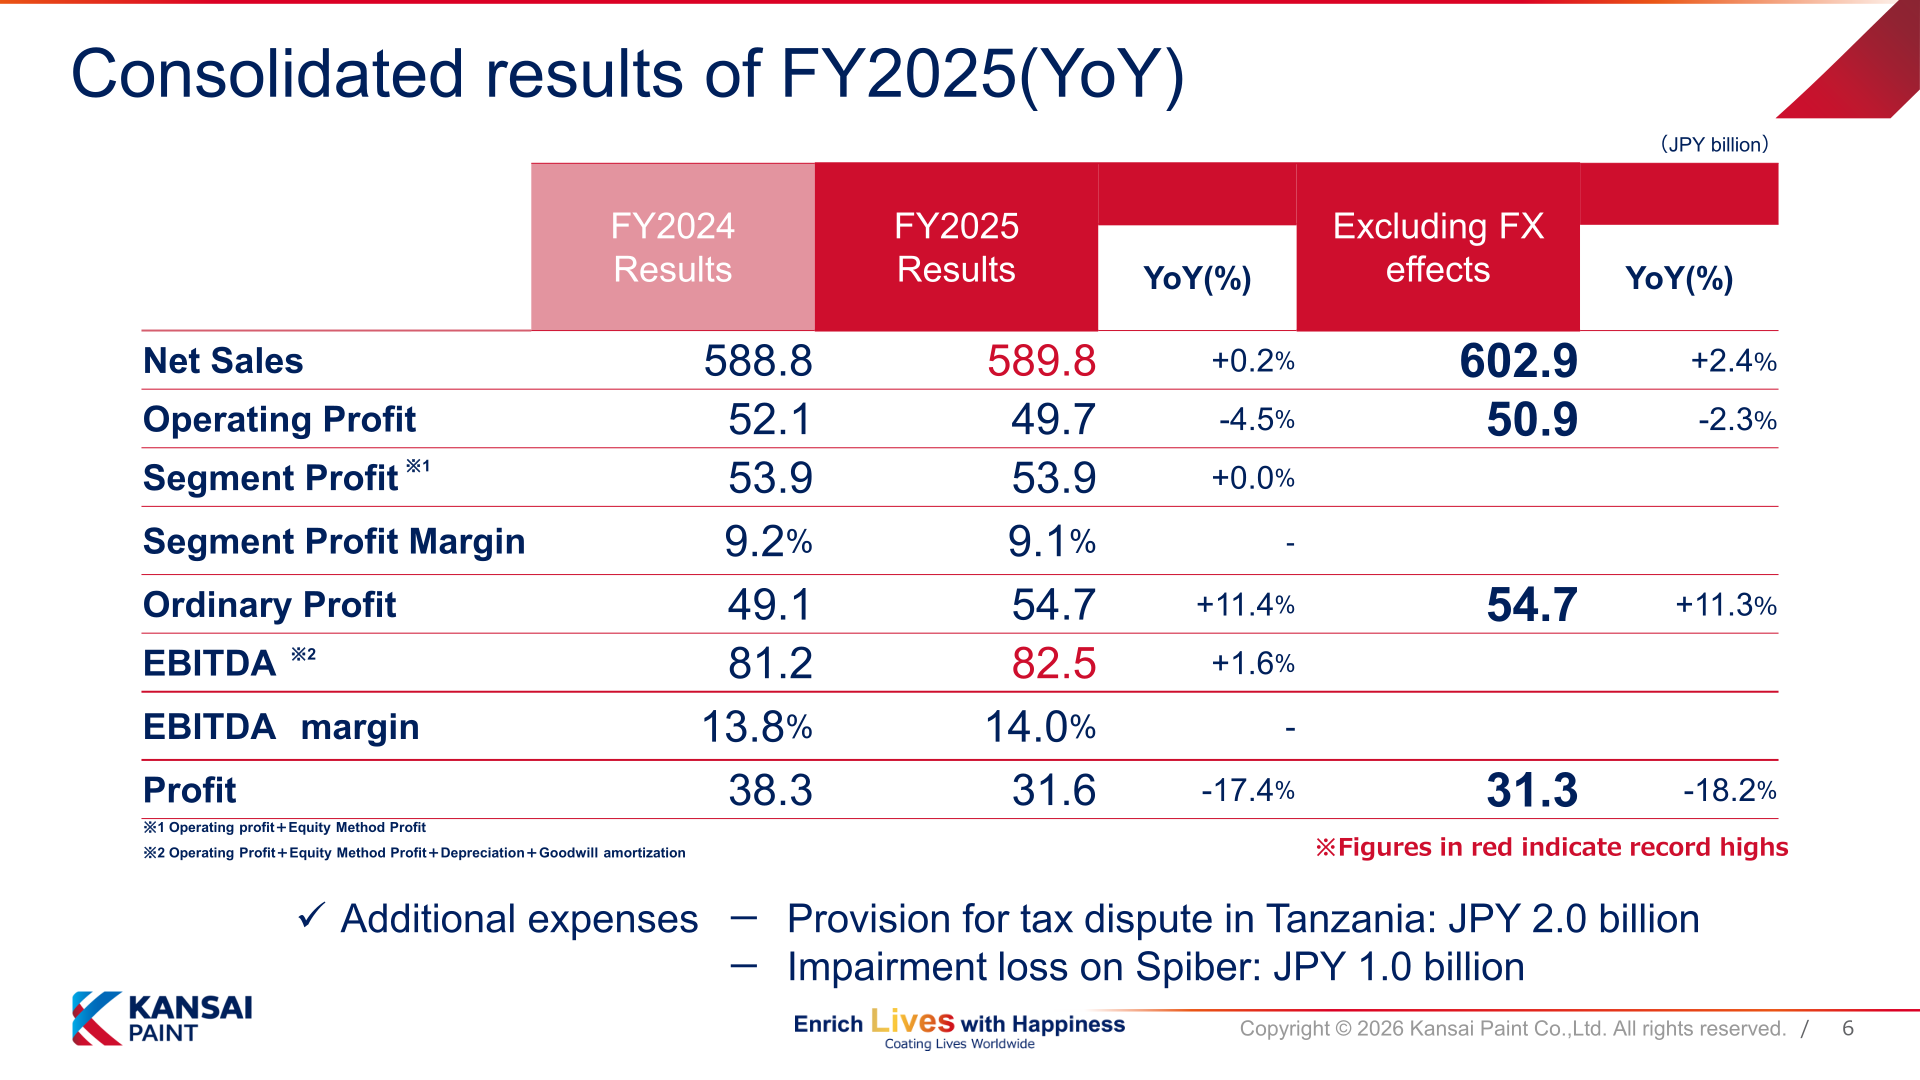
Kansai Paint Co., Ltd. (4613) announced consolidated financial results for FY2025 on May 11, 2026. Net sales rose 0.2% year on year to JPY 589.8 billion and EBITDA increased 1.6% to JPY 82.5 billion, with both reaching record highs for the fifth consecutive year. Profit declined 17.4% to JPY 31.6 billion, reflecting additional expenses including a JPY 2.0 billion provision for a tax dispute in Tanzania and a JPY 1.0 billion impairment loss on Spiber. Kansai Paint reports the fiscal year ended March 31, 2026 as FY2025, and the period labels in this article follow the company’s presentation.
Consolidated Results (Full-Year Actual)
Net sales were JPY 589.8 billion (+0.2% year on year; +2.4% excluding FX effects at JPY 602.9 billion). Operating profit was JPY 49.7 billion (-4.5%; -2.3% excluding FX effects), and segment profit (operating profit plus equity method profit) was JPY 53.9 billion (+0.0%), with the segment profit margin at 9.1% versus 9.2% a year earlier. Ordinary profit increased 11.4% to JPY 54.7 billion, and EBITDA rose to JPY 82.5 billion with the EBITDA margin improving from 13.8% to 14.0%. Profit fell 17.4% to JPY 31.6 billion. On the balance sheet, the shareholders’ equity ratio improved 1.5 points to 37.4% and Net Debt/EBITDA was 1.3 times, which the company describes as a resilient and flexible financial foundation amid uncertainty.
| Item (JPY billion) | FY2024 | FY2025 | YoY | YoY excl. FX |
|---|---|---|---|---|
| Net sales | 588.8 | 589.8 | +0.2% | +2.4% |
| Operating profit | 52.1 | 49.7 | -4.5% | -2.3% |
| Segment profit | 53.9 | 53.9 | +0.0% | – |
| Segment profit margin | 9.2% | 9.1% | – | – |
| Ordinary profit | 49.1 | 54.7 | +11.4% | +11.3% |
| EBITDA | 81.2 | 82.5 | +1.6% | – |
| EBITDA margin | 13.8% | 14.0% | – | – |
| Profit | 38.3 | 31.6 | -17.4% | -18.2% |
Segment Results
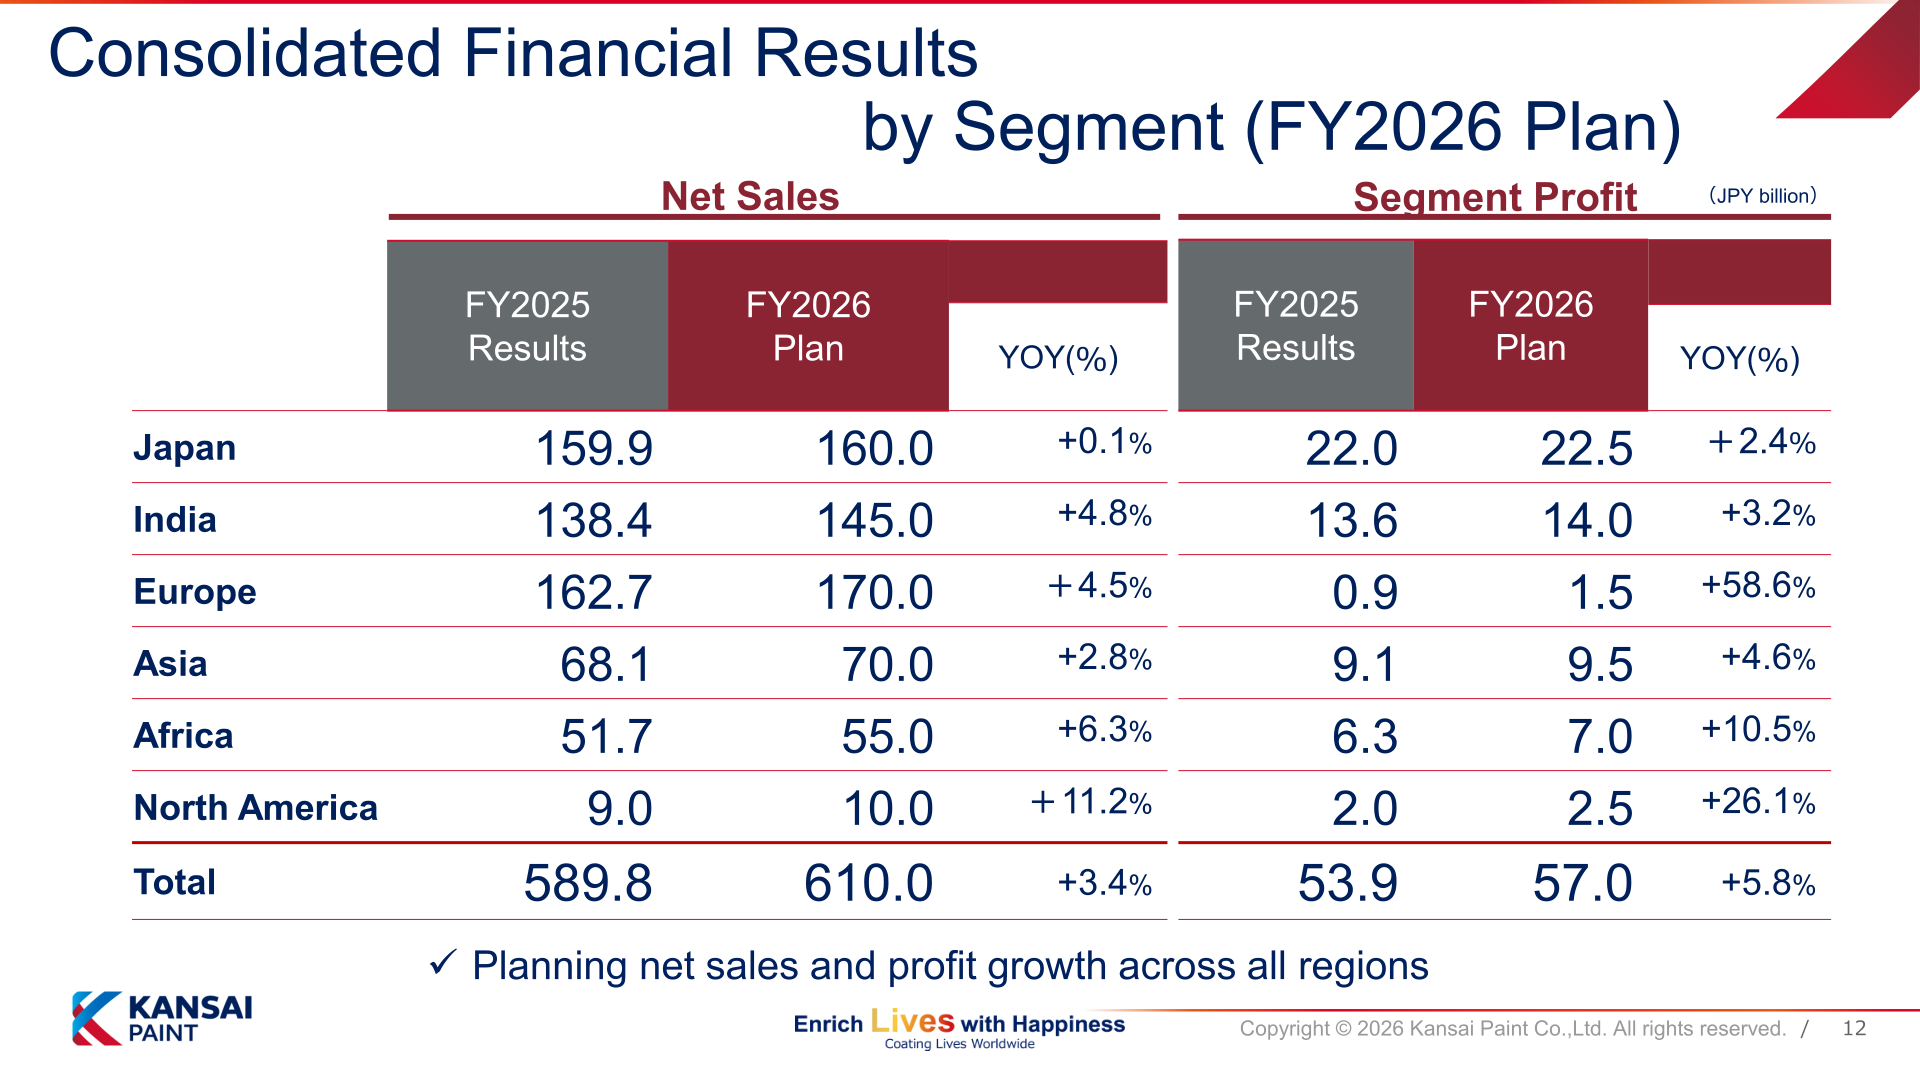
By region, Africa led growth with net sales up 9.1% to JPY 51.7 billion, driven by revenue and profit growth in South Africa despite weak market conditions, strong sales in Zambia, and continued high growth across East Africa including Tanzania and Uganda; the company notes Africa’s segment profit increased significantly on volume growth and lower raw material costs (net sales +9%, operating profit +50%). Europe grew 4.0% to JPY 162.7 billion (+7.6% excluding FX effects) and launched the structural reform program “True Color,” recording extraordinary losses of JPY 7.0 billion related to the reforms. Japan declined 2.4% to JPY 159.9 billion, and India declined 2.8% to JPY 138.4 billion in yen terms but grew 3.0% excluding FX effects, with automotive leading sales and profit growth supported by GST rate reductions. By sector, Auto rose 0.9% to JPY 178.4 billion and Industrial rose 4.8% to JPY 176.2 billion, while Deco AR PC fell 3.3% to JPY 183.2 billion; the company describes the year as driven by Automotive and Industrial. FY2025 segment profit by region was JPY 22.0 billion in Japan, JPY 13.6 billion in India, JPY 0.9 billion in Europe, JPY 9.1 billion in Asia, JPY 6.3 billion in Africa, and JPY 2.0 billion in North America.
| Region (JPY billion) | FY2024 | FY2025 | YoY | YoY excl. FX |
|---|---|---|---|---|
| Japan | 163.9 | 159.9 | -2.4% | – |
| India | 142.3 | 138.4 | -2.8% | +3.0% |
| Europe | 156.5 | 162.7 | +4.0% | +7.6% |
| Asia | 68.7 | 68.1 | -0.9% | -1.6% |
| Africa | 47.4 | 51.7 | +9.1% | +8.6% |
| North America | 10.0 | 9.0 | -10.3% | -9.5% |
| Total | 588.8 | 589.8 | +0.2% | +2.4% |
FY2026 Plan
For FY2026, the company plans net sales of JPY 610.0 billion (+3.4%), operating profit of JPY 53.0 billion (+6.6%), segment profit of JPY 57.0 billion (+5.8%), ordinary profit of JPY 55.0 billion (+0.5%), and EBITDA of JPY 92.0 billion (+11.5%), with the EBITDA margin rising 1.1 points to 15.1%. Profit is planned at JPY 27.0 billion (-14.7%), reflecting JPY 7.0 billion of extraordinary losses recorded for the “True Color” project in Europe. The company plans net sales and profit growth across all regions and states that the FY2026 plan targets record-high levels in both quality and scale.
| Item (JPY billion) | FY2025 (Actual) | FY2026 (Plan) | YoY |
|---|---|---|---|
| Net sales | 589.8 | 610.0 | +3.4% |
| Operating profit | 49.7 | 53.0 | +6.6% |
| Segment profit | 53.9 | 57.0 | +5.8% |
| Ordinary profit | 54.7 | 55.0 | +0.5% |
| EBITDA | 82.5 | 92.0 | +11.5% |
| EBITDA margin | 14.0% | 15.1% | +1.1pt |
| Profit | 31.6 | 27.0 | -14.7% |
Shareholder Returns
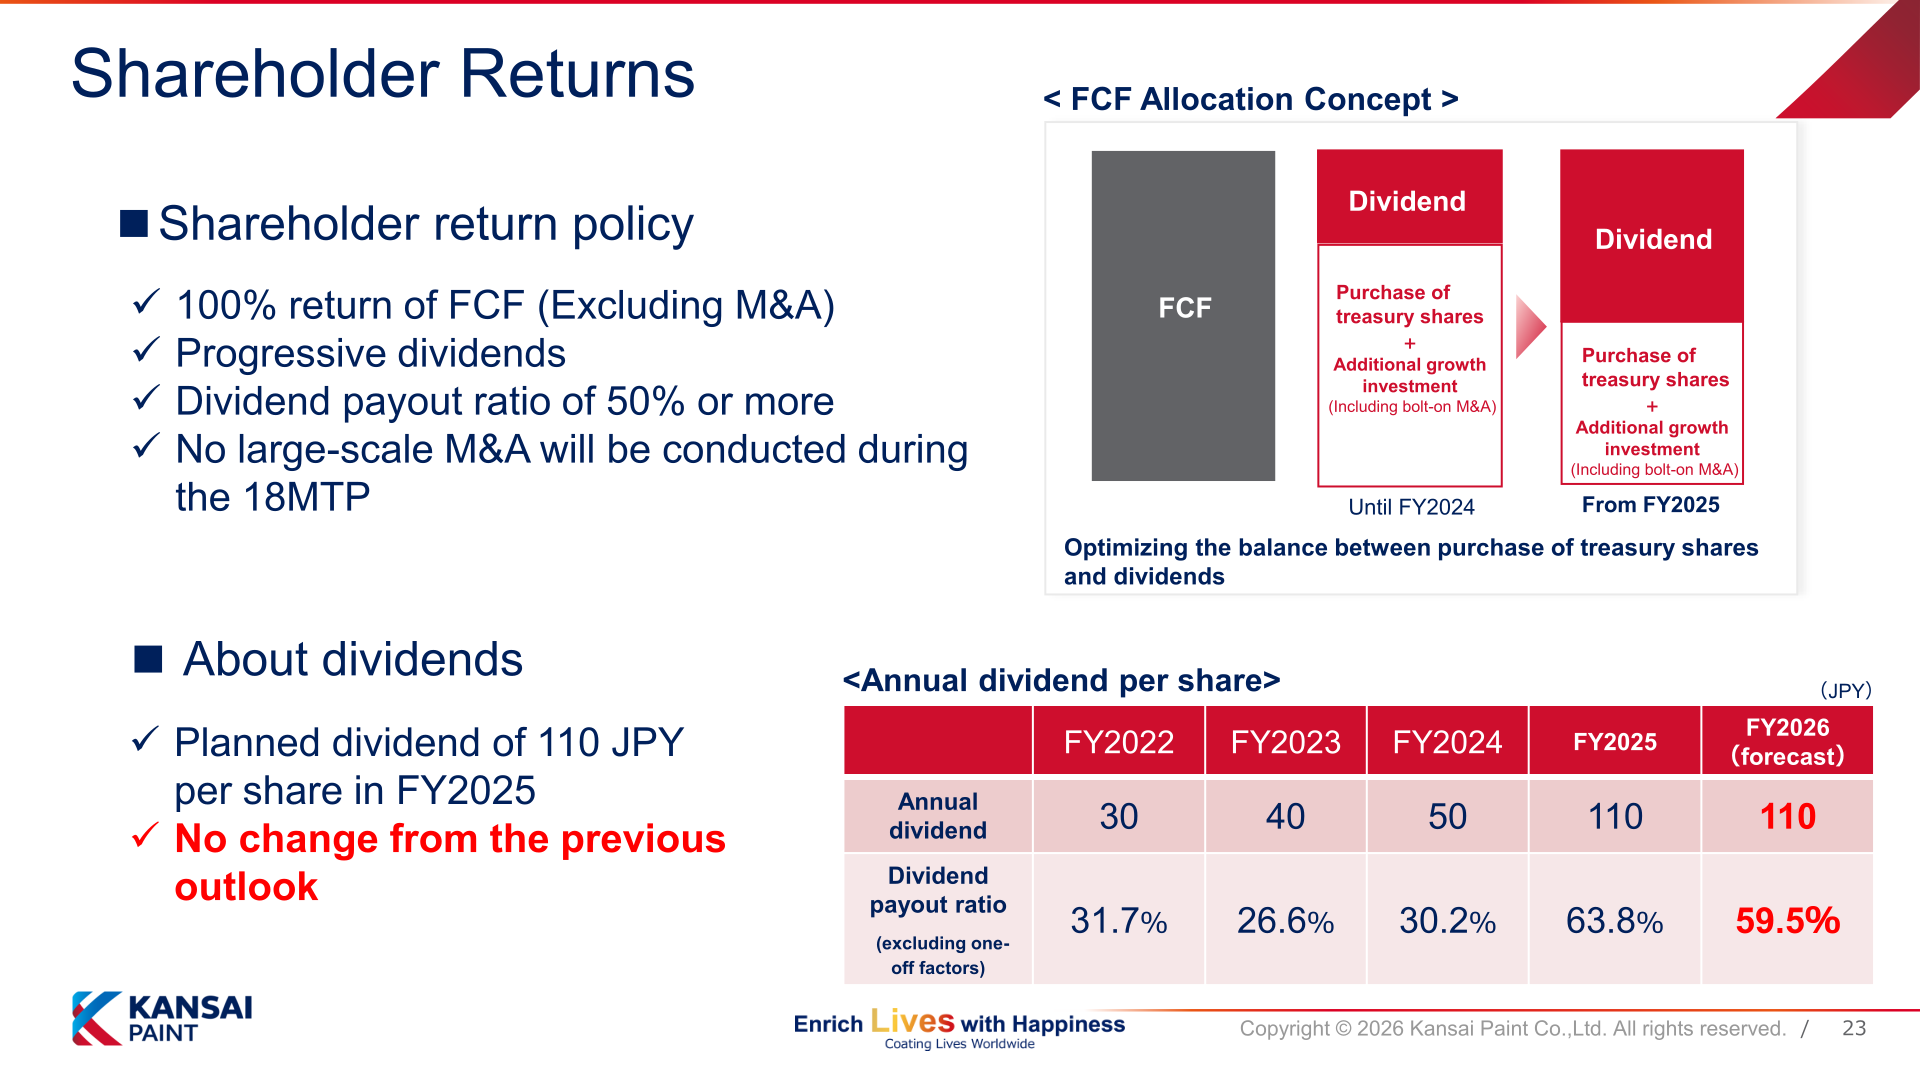
The company plans an annual dividend of JPY 110 per share for FY2025, unchanged from its previous outlook, and forecasts JPY 110 per share for FY2026. The dividend payout ratio (excluding one-off factors) was 63.8% for FY2025 and is planned at 59.5% for FY2026. The shareholder return policy comprises a 100% return of free cash flow (excluding M&A), progressive dividends, and a dividend payout ratio of 50% or more, and the company states that no large-scale M&A will be conducted during the 18th Medium-term Management Plan. From FY2025, free cash flow is allocated to dividends and purchases of treasury shares, optimizing the balance between the two, plus additional growth investment including bolt-on M&A.
| Item | FY2022 | FY2023 | FY2024 | FY2025 | FY2026 (forecast) |
|---|---|---|---|---|---|
| Annual dividend per share (JPY) | 30 | 40 | 50 | 110 | 110 |
| Dividend payout ratio (excluding one-off factors) | 31.7% | 26.6% | 30.2% | 63.8% | 59.5% |
Topics
In Japan, the renewal of core systems caused a one-off negative impact beyond plan due to actions taken to address supply disruptions, including support from system vendors, special logistics measures such as air freight, additional personnel costs, and leakage to competitors; Japan segment profit was JPY 22.0 billion versus an underlying JPY 23.6 billion excluding one-off impacts. The company states that issues related to integration with surrounding systems have been resolved, recovery production has been fully ramped up since late April, and the impact on future performance is expected to be limited. In Europe, the “True Color” structural reform program was launched as planned, covering business portfolio optimization, manufacturing footprint optimization, and sales network restructuring. Regarding the Middle East situation, the company reports no major supply concerns across regions, with supply in Japan secured through the end of the following month, and it prioritizes stable supply to customers while passing on cost increases through pricing.
This article is an analysis based on publicly available information and is not a recommendation to buy or sell any specific securities. Investment decisions are your own responsibility.
![[Obayashi] Investors’ Guide 2026 — The Complete 24-Article Breakdown](https://japan-equity.com/wp-content/uploads/2026/07/hub_cover-1024x1024.png)
![[Obayashi] IR & SR Policy — Feeding Dialogue Back into Management](https://japan-equity.com/wp-content/uploads/2026/07/p32_sq-1024x1024.jpg)
![[Obayashi] Real Estate Development — 18.7% Margin, ¥287.7bn Unrealized Gains](https://japan-equity.com/wp-content/uploads/2026/07/p20_sq-1024x1024.jpg)
![[Obayashi] Domestic Civil Engineering — Resilience Spending Supports 9.6% Margin](https://japan-equity.com/wp-content/uploads/2026/07/p11_sq-1024x1024.jpg)
![[Obayashi] Share Price & External Ratings — vs TOPIX, ESG Index Inclusion](https://japan-equity.com/wp-content/uploads/2026/07/p40_sq-1024x1024.jpg)
![[Construction] ¥75.5tn Investment, Shrinking Workforce — Big-5 Market Share](https://japan-equity.com/wp-content/uploads/2026/07/p12_sq-1024x1024.jpg)



![[Obayashi] Capital Policy & Shareholder Returns — ROE 10%+, DOE ~5%, ¥100bn Buyback](https://japan-equity.com/wp-content/uploads/2026/07/p27_sq-1024x1024.jpg)
![[Obayashi] Reducing Cross-Shareholdings — ¥285.2bn Sold in Five Years](https://japan-equity.com/wp-content/uploads/2026/07/p29_sq-1024x1024.jpg)
![[Obayashi] ¥750bn Investment Plan — ¥300bn to Development, ¥190bn to Tech/DX](https://japan-equity.com/wp-content/uploads/2026/07/p30_sq-1024x1024.jpg)
![[Obayashi] MTP2022 KPIs — Operating Profit ~2x Target, ROE 14.4%](https://japan-equity.com/wp-content/uploads/2026/07/p25_sq-1024x1024.jpg)
![[Obayashi] Cash Allocation — ¥420bn Investment CF Over Five Years](https://japan-equity.com/wp-content/uploads/2026/07/p26_sq-1024x1024.jpg)
![[Obayashi] Green Energy — 44 Plants, 344MW, and the Green Hydrogen Challenge](https://japan-equity.com/wp-content/uploads/2026/07/p21_sq-1024x1024.jpg)
![[Obayashi] Tackling the Labor Shortage — Robotics Construction®](https://japan-equity.com/wp-content/uploads/2026/07/p14_sq-1024x1024.jpg)
