
This article is based on publicly available IR materials and is not a recommendation to buy or sell any specific securities.
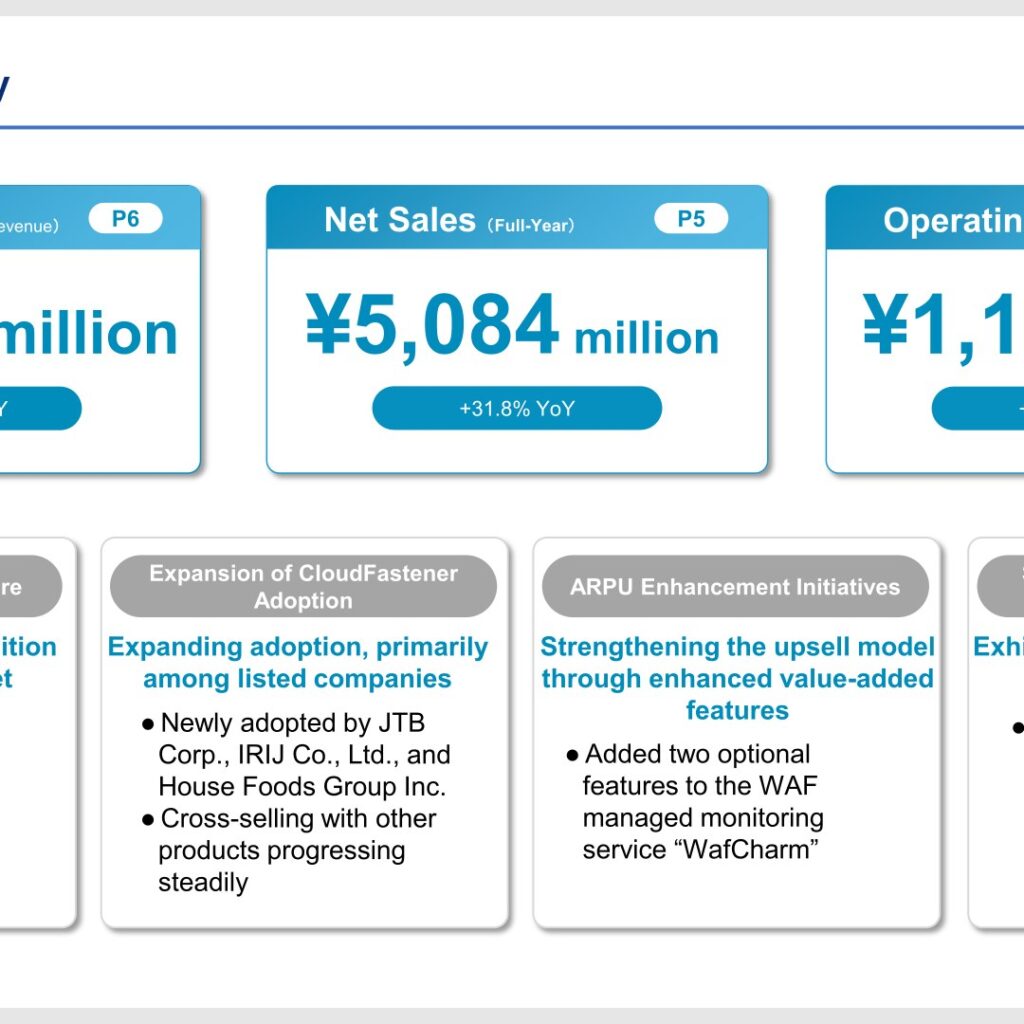
Cyber Security Cloud, Inc. (TSE Growth Market: 4493) reported net sales of ¥5,084 million and operating profit of ¥1,102 million for FY2025, the fiscal year ended December 31, 2025. Net sales rose 31.8% year on year and operating profit rose 42.5%, and both figures exceeded the 2025 targets of ¥5.0 billion in net sales and ¥1.0 billion in operating profit that the company set in 2021. Annual Recurring Revenue (ARR) reached ¥4,997 million, up 22.0% year on year. For FY2026, the company forecasts net sales of ¥6,000 million and operating profit of ¥1,200 million as the first year of a new mid-term management plan running through FY2030.
Consolidated Results (Full-Year Actual)
All four headline profit lines grew by double digits and each came in above the company’s own FY2025 forecast. The operating margin improved 1.5 percentage points to 21.6%. Results were released on February 13, 2026.
| Item (Millions of yen) | FY2025 Full-Year | FY2024 Full-Year | YoY | FY2025 Forecast | Progress Rate |
|---|---|---|---|---|---|
| Revenue | 5,084 | 3,857 | +31.8% | 5,000 | 101.7% |
| Gross Profit | 3,333 | 2,520 | +32.3% | ― | ― |
| Operating Profit | 1,102 | 773 | +42.5% | 1,000 | 110.3% |
| Operating Margin | 21.6% | 20.1% | +1.5pt | 20.0% | ― |
| Ordinary Profit | 1,092 | 832 | +31.1% | 1,000 | 109.2% |
| Net Income Attributable to Owners of the parent | 821 | 575 | +42.9% | 693 | 118.6% |
The company also disclosed its balance sheet and cash flow position. Total assets expanded to ¥5,833 million and net assets to ¥4,422 million, while cash and cash equivalents at the end of the period stood at ¥3,983 million.
| Item (Millions of yen) | FY2025 | FY2024 |
|---|---|---|
| Total Assets | 5,833 | 3,016 |
| Total Liabilities | 1,411 | 1,310 |
| Net Assets | 4,422 | 1,706 |
| Cash Flows from Operating Activities | 1,004 | 633 |
| Cash Flows from Investing Activities | -426 | -175 |
| Cash Flows from Financing Activities | 1,707 | -595 |
| Cash and Cash Equivalents at End of Period | 3,983 | 1,667 |
Product Results (ARR and KPIs)
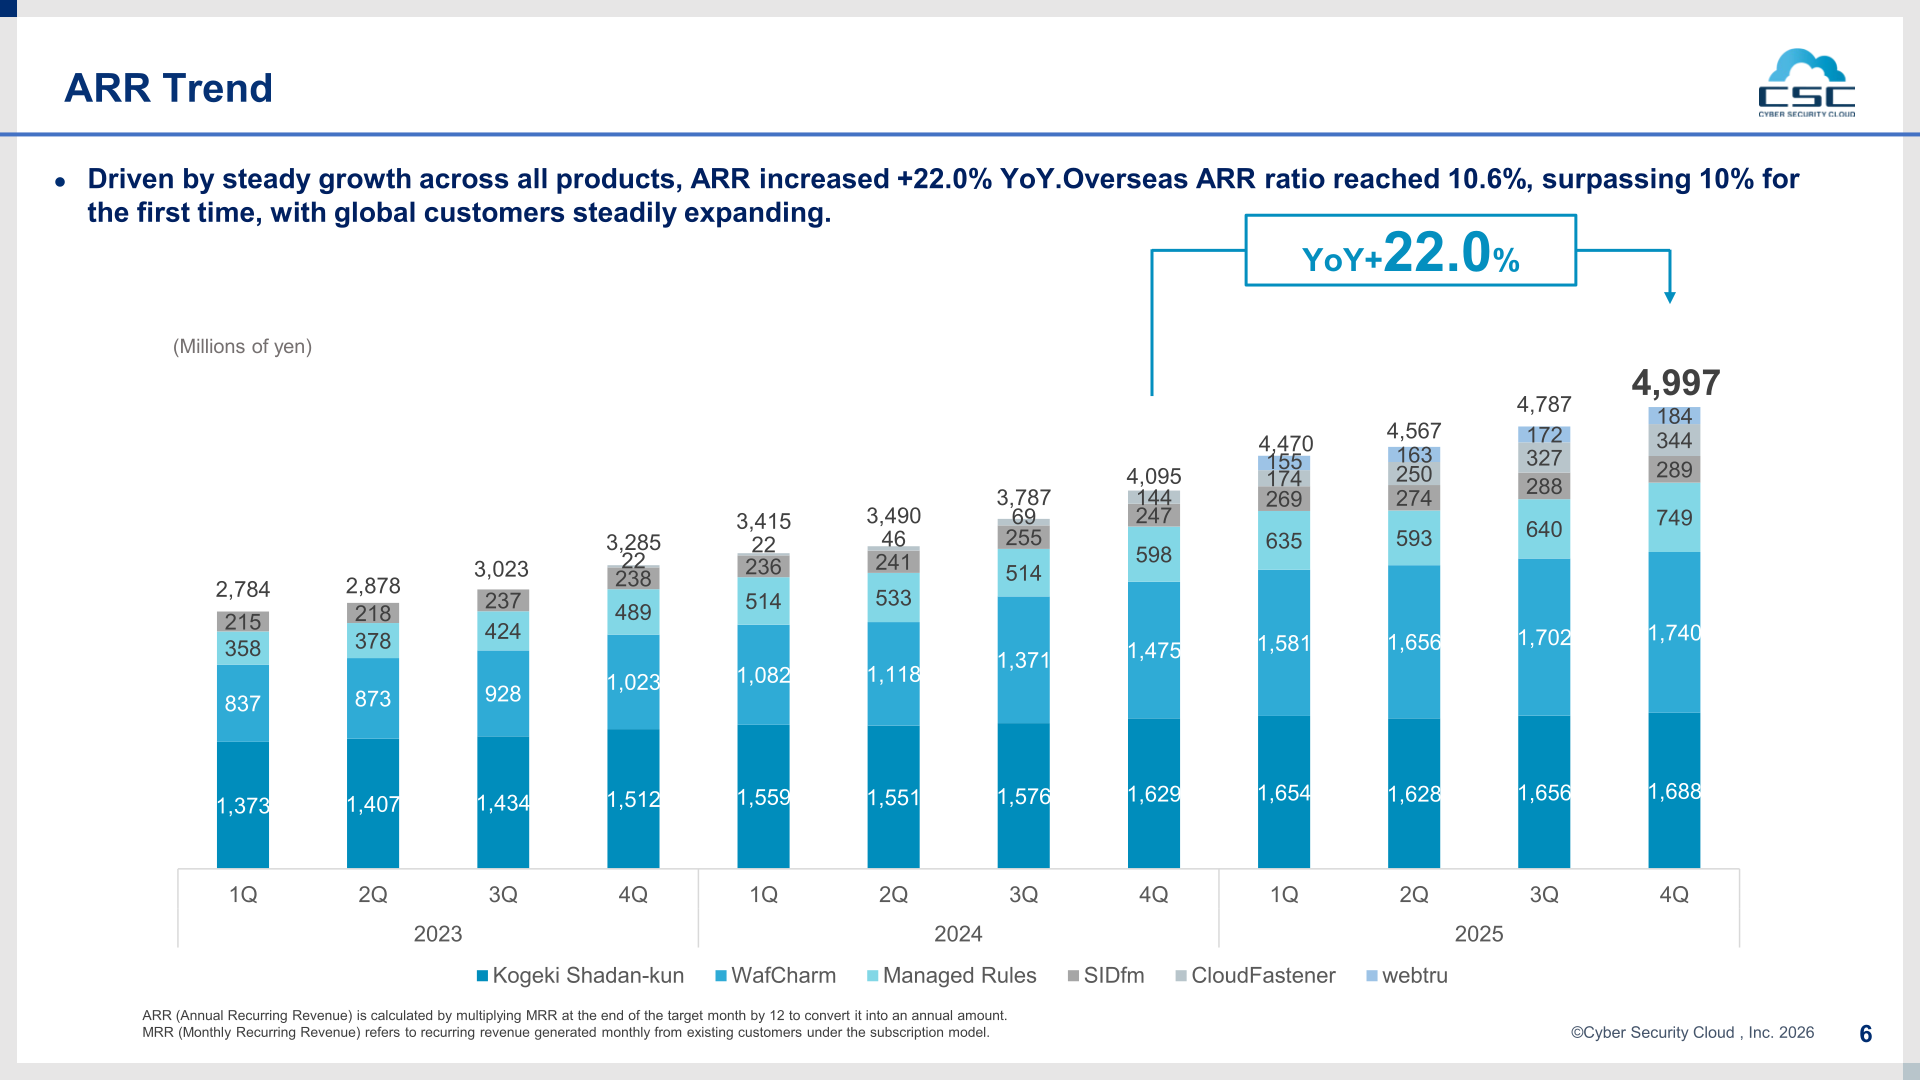
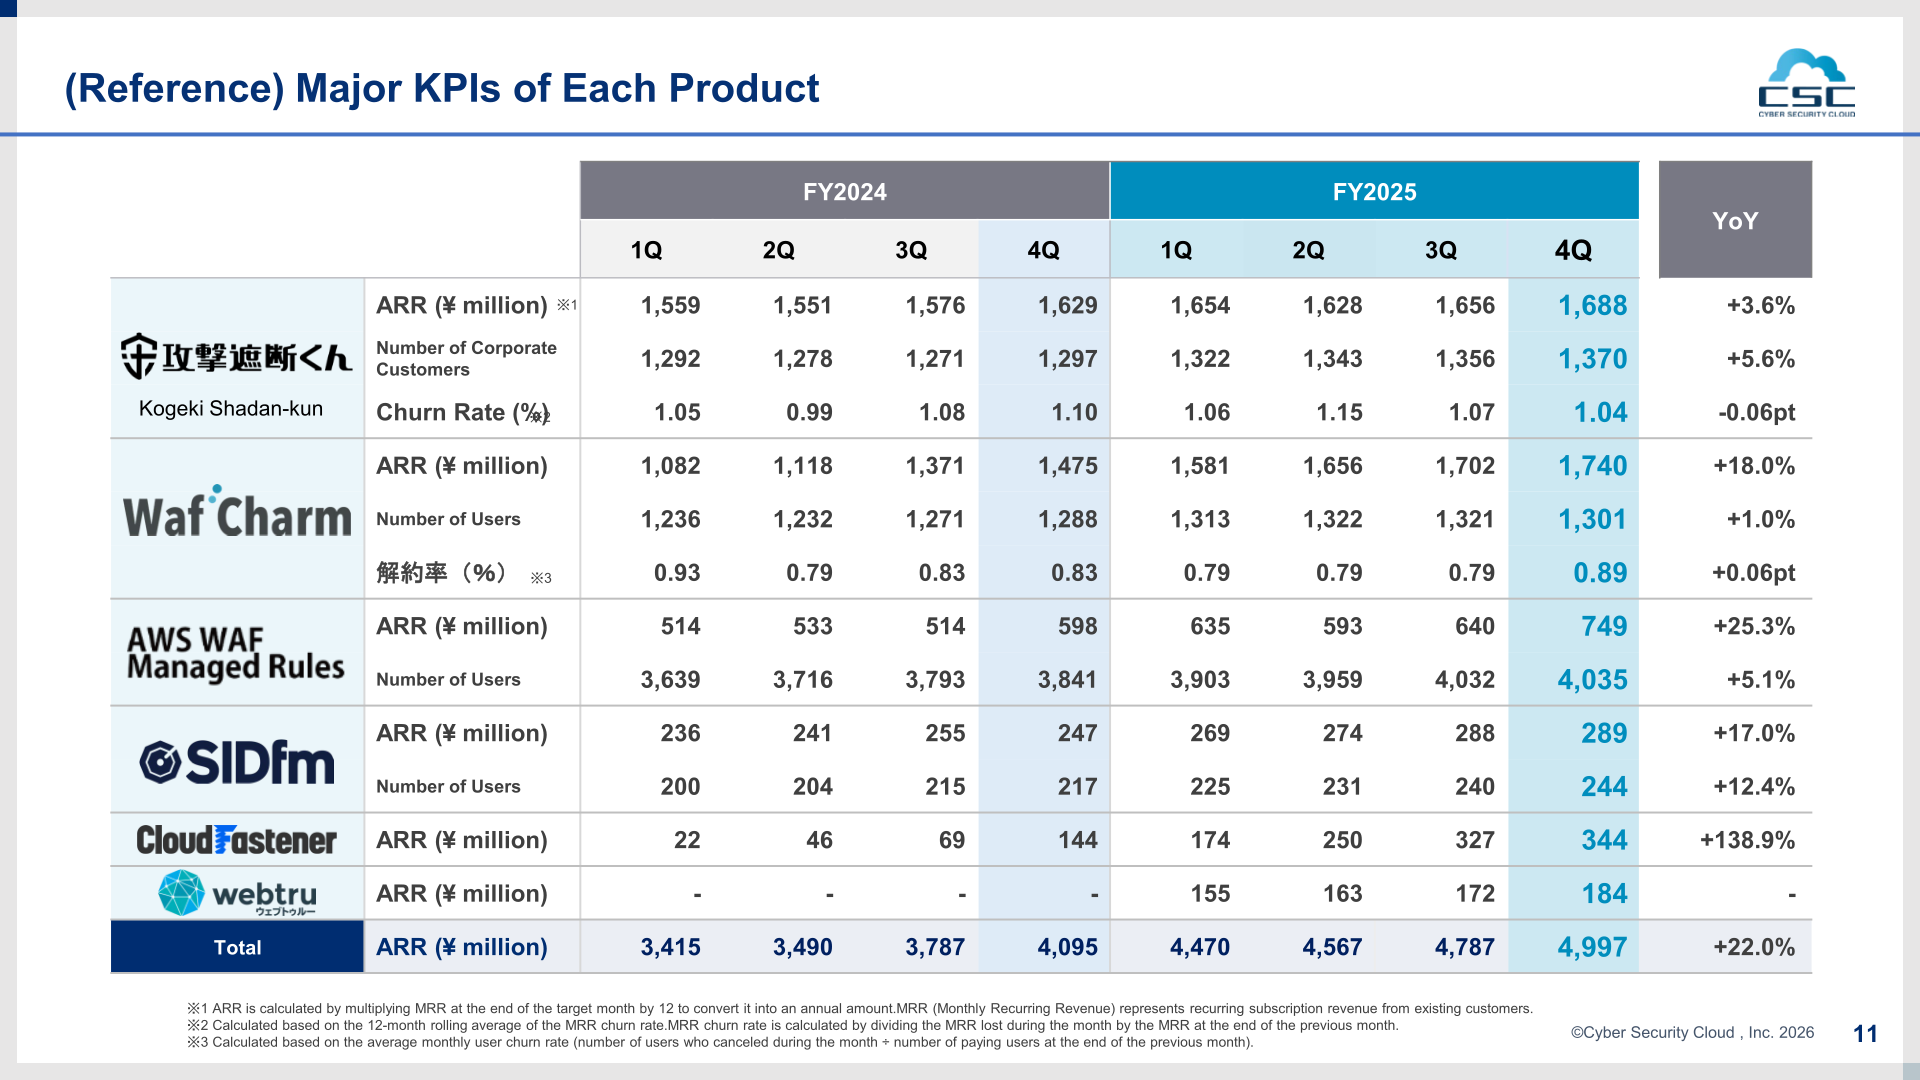
Total ARR rose 22.0% year on year to ¥4,997 million at the end of FY2025, driven by steady growth across all products. The overseas ARR ratio reached 10.6%, surpassing 10% for the first time. CloudFastener recorded the sharpest growth at +138.9%, and webtru contributed ARR of ¥184 million. Churn rates were stable at approximately 1%, with Kogeki Shadan-kun at 1.04% and WafCharm at 0.89% as of the end of FY2025.
| Product | Metric | FY2025 4Q | FY2024 4Q | YoY |
|---|---|---|---|---|
| Kogeki Shadan-kun | ARR (¥ million) | 1,688 | 1,629 | +3.6% |
| Kogeki Shadan-kun | Number of Corporate Customers | 1,370 | 1,297 | +5.6% |
| Kogeki Shadan-kun | Churn Rate (%) | 1.04 | 1.10 | -0.06pt |
| WafCharm | ARR (¥ million) | 1,740 | 1,475 | +18.0% |
| WafCharm | Number of Users | 1,301 | 1,288 | +1.0% |
| WafCharm | Churn Rate (%) | 0.89 | 0.83 | +0.06pt |
| Managed Rules | ARR (¥ million) | 749 | 598 | +25.3% |
| Managed Rules | Number of Users | 4,035 | 3,841 | +5.1% |
| SIDfm | ARR (¥ million) | 289 | 247 | +17.0% |
| SIDfm | Number of Users | 244 | 217 | +12.4% |
| CloudFastener | ARR (¥ million) | 344 | 144 | +138.9% |
| webtru | ARR (¥ million) | 184 | – | – |
| Total | ARR (¥ million) | 4,997 | 4,095 | +22.0% |
Topics in FY2025
The company highlighted four topics for the period. First, after three consecutive years as No.1 in sales share in Japan’s cloud-based WAF market with Kogeki Shadan-kun, it newly achieved No.1 sales share in the domestic WAF managed monitoring services market, giving it the top position in two WAF-related market segments. Second, adoption of CloudFastener expanded, particularly among listed companies, with new customers including JTB Corp., IRIJ Co., Ltd. and House Foods Group Inc., and cross-selling with WafCharm progressing. Third, two optional features — “WAF Log Storage” and the “Log Intelligence Option” — were added to WafCharm to raise ARPU. Fourth, the company exhibited at AWS re:Invent for a third consecutive year, generating over 170 high-potential leads, and was selected as a finalist for the “Geo and Global AWS Partner Award 2025” Marketplace Partner of the Year – APJ.
Headcount increased by 29 year on year to 175 employees at the end of 2025, reflecting continued strengthening of new graduate and mid-career hiring. Quarterly operating expenses rose to ¥1,097 million in Q4, as personnel expenses grew with headcount and advertising expenses increased in connection with participation in AWS re:Invent 2025.
FY2026 Forecast
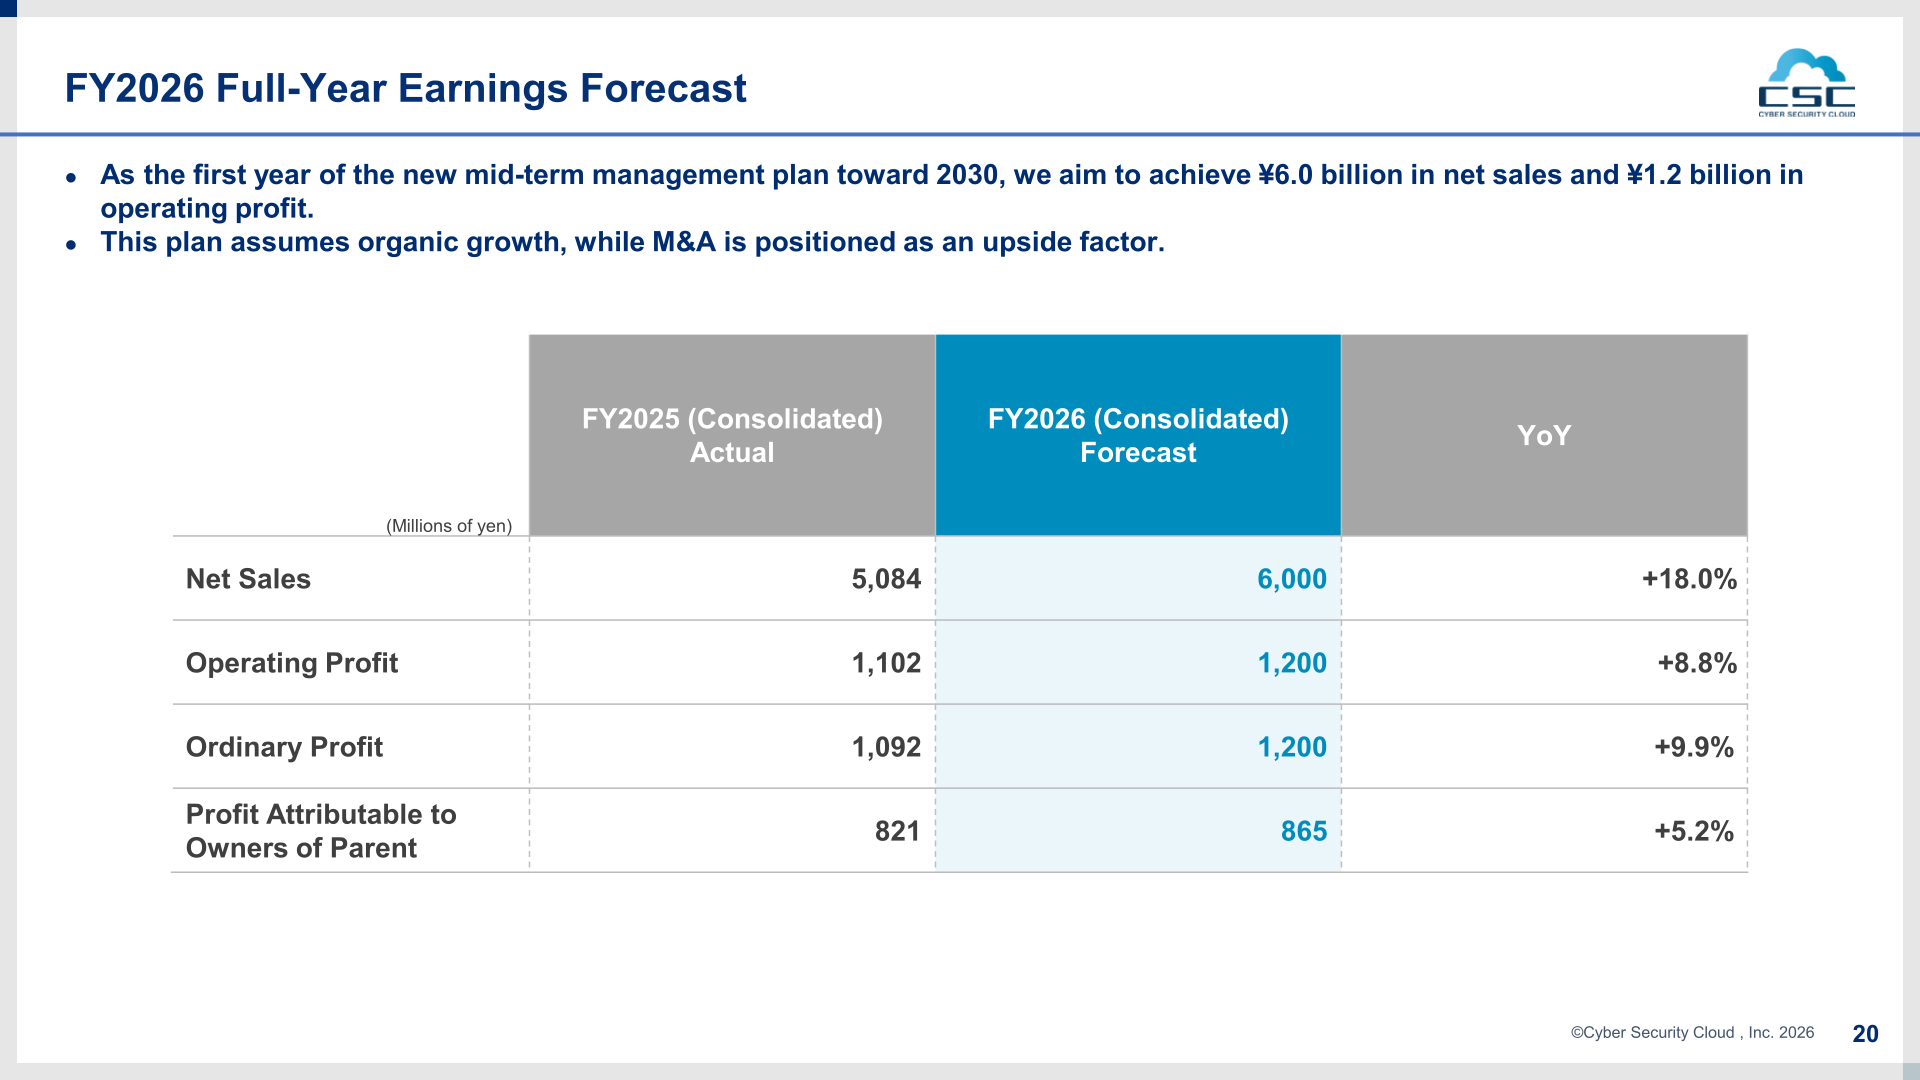
For FY2026, the company targets net sales of ¥6.0 billion and operating profit of ¥1.2 billion. The plan assumes organic growth, with M&A positioned as an upside factor.
| Item (Millions of yen) | FY2026 Forecast | FY2025 Actual | YoY |
|---|---|---|---|
| Net Sales | 6,000 | 5,084 | +18.0% |
| Operating Profit | 1,200 | 1,102 | +8.8% |
| Ordinary Profit | 1,200 | 1,092 | +9.9% |
| Profit Attributable to Owners of Parent | 865 | 821 | +5.2% |
Shareholder Returns
The results presentation does not include information on dividends or share buybacks. This cannot be confirmed from the materials.
Mid-Term Management Plan
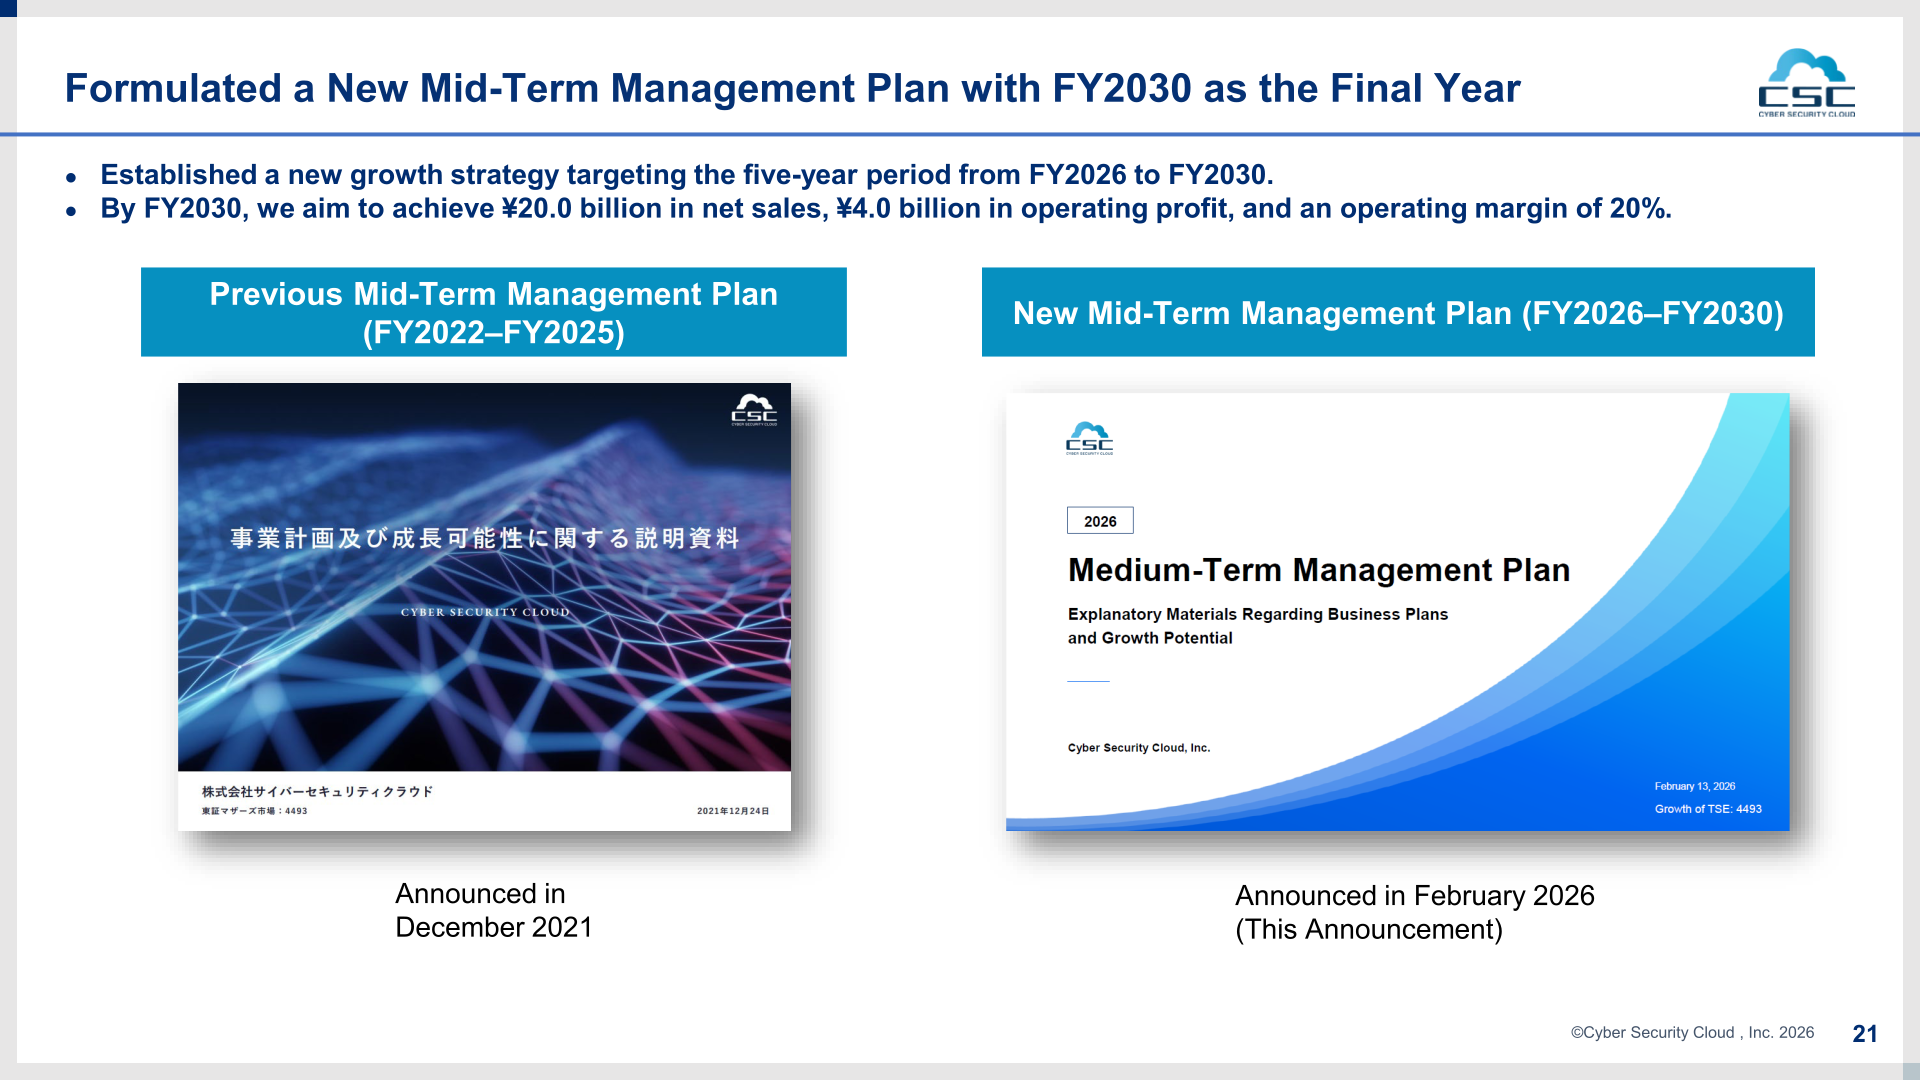
Alongside the results, the company announced in February 2026 a new mid-term management plan covering the five-year period from FY2026 to FY2030, succeeding the previous plan for FY2022–FY2025. By FY2030, it aims to achieve ¥20.0 billion in net sales, ¥4.0 billion in operating profit and an operating margin of 20%.
Reference points disclosed in the materials include a revenue CAGR of 33.6% from 2020 to 2025, an overseas ARR ratio of 10.6%, services provided in more than 100 countries, more than 6 million users, and 48 customers with an ARR of ¥10 million or more. The recurring revenue ratio is approximately 90%.
This article is an analysis based on publicly available information and is not a recommendation to buy or sell any specific securities. Investment decisions are your own responsibility.
![[Obayashi] Investors’ Guide 2026 — The Complete 24-Article Breakdown](https://japan-equity.com/wp-content/uploads/2026/07/hub_cover-1024x1024.png)
![[Obayashi] IR & SR Policy — Feeding Dialogue Back into Management](https://japan-equity.com/wp-content/uploads/2026/07/p32_sq-1024x1024.jpg)
![[Obayashi] Real Estate Development — 18.7% Margin, ¥287.7bn Unrealized Gains](https://japan-equity.com/wp-content/uploads/2026/07/p20_sq-1024x1024.jpg)
![[Obayashi] Domestic Civil Engineering — Resilience Spending Supports 9.6% Margin](https://japan-equity.com/wp-content/uploads/2026/07/p11_sq-1024x1024.jpg)
![[Obayashi] Share Price & External Ratings — vs TOPIX, ESG Index Inclusion](https://japan-equity.com/wp-content/uploads/2026/07/p40_sq-1024x1024.jpg)
![[Construction] ¥75.5tn Investment, Shrinking Workforce — Big-5 Market Share](https://japan-equity.com/wp-content/uploads/2026/07/p12_sq-1024x1024.jpg)



![[Obayashi] Capital Policy & Shareholder Returns — ROE 10%+, DOE ~5%, ¥100bn Buyback](https://japan-equity.com/wp-content/uploads/2026/07/p27_sq-1024x1024.jpg)
![[Obayashi] Reducing Cross-Shareholdings — ¥285.2bn Sold in Five Years](https://japan-equity.com/wp-content/uploads/2026/07/p29_sq-1024x1024.jpg)
![[Obayashi] ¥750bn Investment Plan — ¥300bn to Development, ¥190bn to Tech/DX](https://japan-equity.com/wp-content/uploads/2026/07/p30_sq-1024x1024.jpg)
![[Obayashi] MTP2022 KPIs — Operating Profit ~2x Target, ROE 14.4%](https://japan-equity.com/wp-content/uploads/2026/07/p25_sq-1024x1024.jpg)
![[Obayashi] Cash Allocation — ¥420bn Investment CF Over Five Years](https://japan-equity.com/wp-content/uploads/2026/07/p26_sq-1024x1024.jpg)
![[Obayashi] Green Energy — 44 Plants, 344MW, and the Green Hydrogen Challenge](https://japan-equity.com/wp-content/uploads/2026/07/p21_sq-1024x1024.jpg)
![[Obayashi] Tackling the Labor Shortage — Robotics Construction®](https://japan-equity.com/wp-content/uploads/2026/07/p14_sq-1024x1024.jpg)
