
This article is based on publicly available IR materials and is not a recommendation to buy or sell any specific securities.
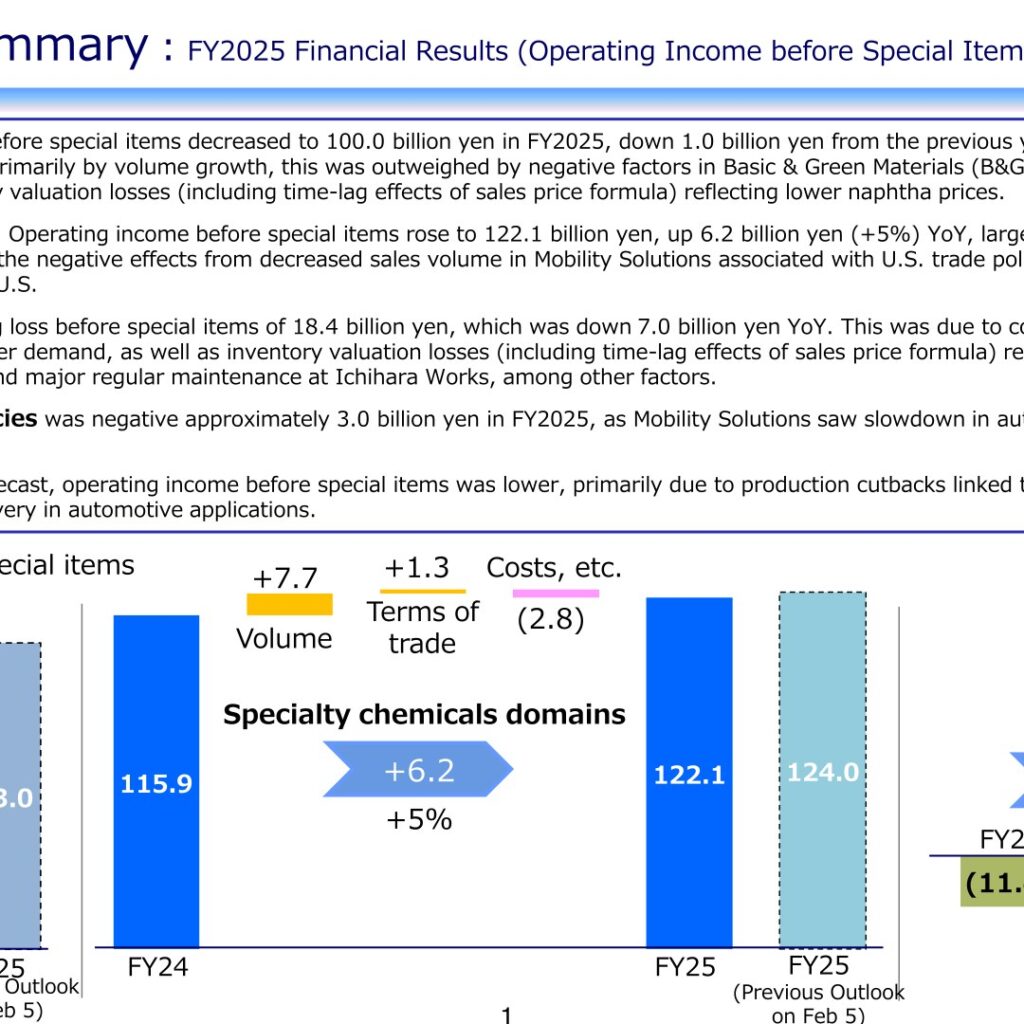
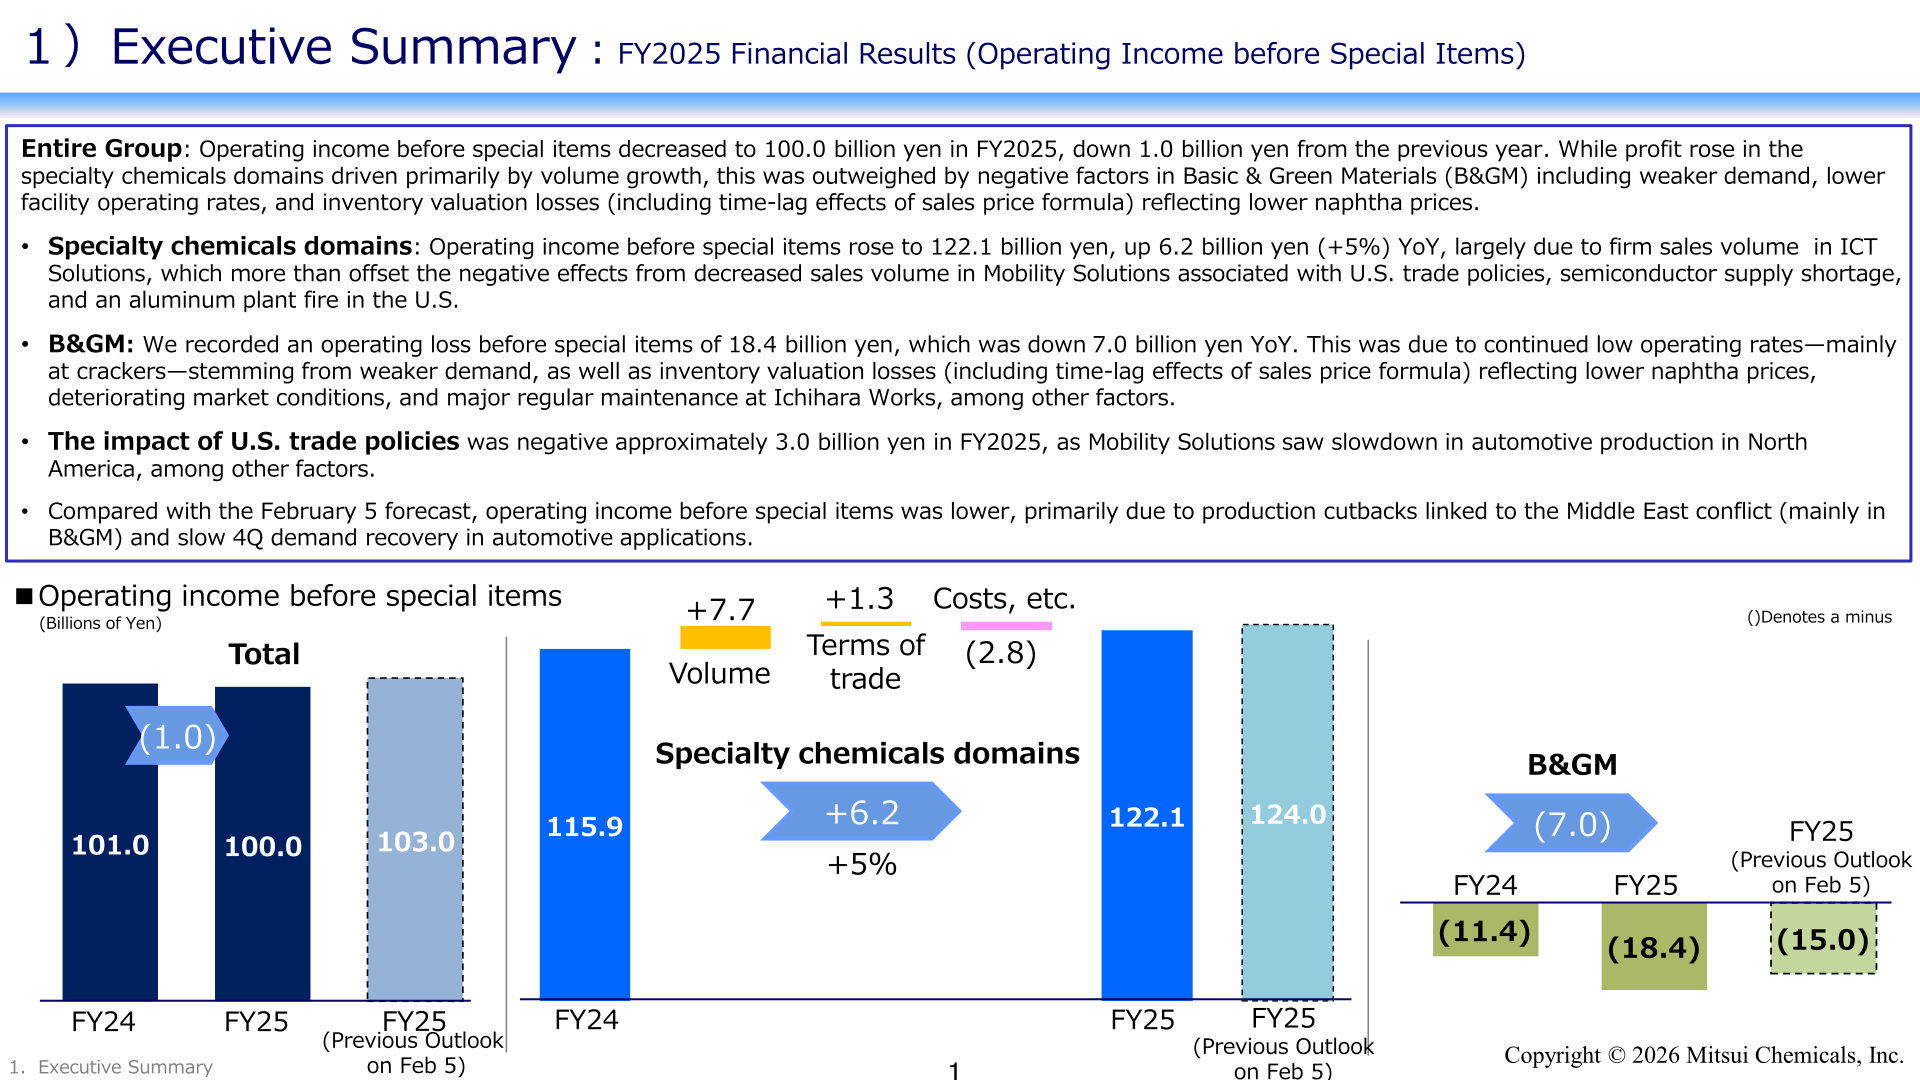
Mitsui Chemicals reported FY2025 (April 2025–March 2026) sales revenue of 1,668.8 billion yen, down 140.4 billion yen (-8%) year on year, and operating income before special items of 100.0 billion yen, down 1.0 billion yen (-1%) YoY. Net income attributable to owners of the parent rose to 34.4 billion yen, up 2.2 billion yen (+7%) YoY. Growth in the specialty chemicals domains — led by firm sales volume in ICT Solutions — was more than offset by weakness in Basic & Green Materials (B&GM), which recorded an operating loss before special items of 18.4 billion yen amid lower operating rates, weaker demand, and inventory valuation losses linked to lower naphtha prices.
Consolidated Results (Full-Year Actual)
Operating income (inc. Equity in earnings) was 73.8 billion yen, down 4.5 billion yen (-6%) year on year, after non-recurring items of (26.2) billion yen in FY2025 versus (22.7) billion yen in FY2024 — reflecting a higher impairment loss of (21.9) billion yen (FY2024: (18.5) billion yen) and a loss on related business of (4.0) billion yen (FY2024: nil) tied to business restructuring (Kulzer, ARRK). Financial incomes/expenses improved to (5.2) billion yen from (6.7) billion yen. Income before taxes was 68.6 billion yen, down 3.0 billion yen (-4%). The domestic standard naphtha price fell to 65,300 yen/KL in FY2025 from 75,600 yen/KL in FY2024, and the exchange rate was 151 yen/US$ versus 153 yen/US$ a year earlier.
| Item | FY2024 | FY2025 | Change |
|---|---|---|---|
| Sales revenue | 1,809.2 | 1,668.8 | (140.4) (-8%) |
| Operating income before special items | 101.0 | 100.0 | (1.0) (-1%) |
| Equity in earnings | 12.4 | 18.4 | 6.0 (48%) |
| Non-recurring items | (22.7) | (26.2) | (3.5) |
| Operating income (inc. Equity in earnings) | 78.3 | 73.8 | (4.5) (-6%) |
| Financial incomes/expenses | (6.7) | (5.2) | 1.5 |
| Income before taxes | 71.6 | 68.6 | (3.0) (-4%) |
| Net income attributable to owners of the parent | 32.2 | 34.4 | 2.2 (7%) |
Segment Results
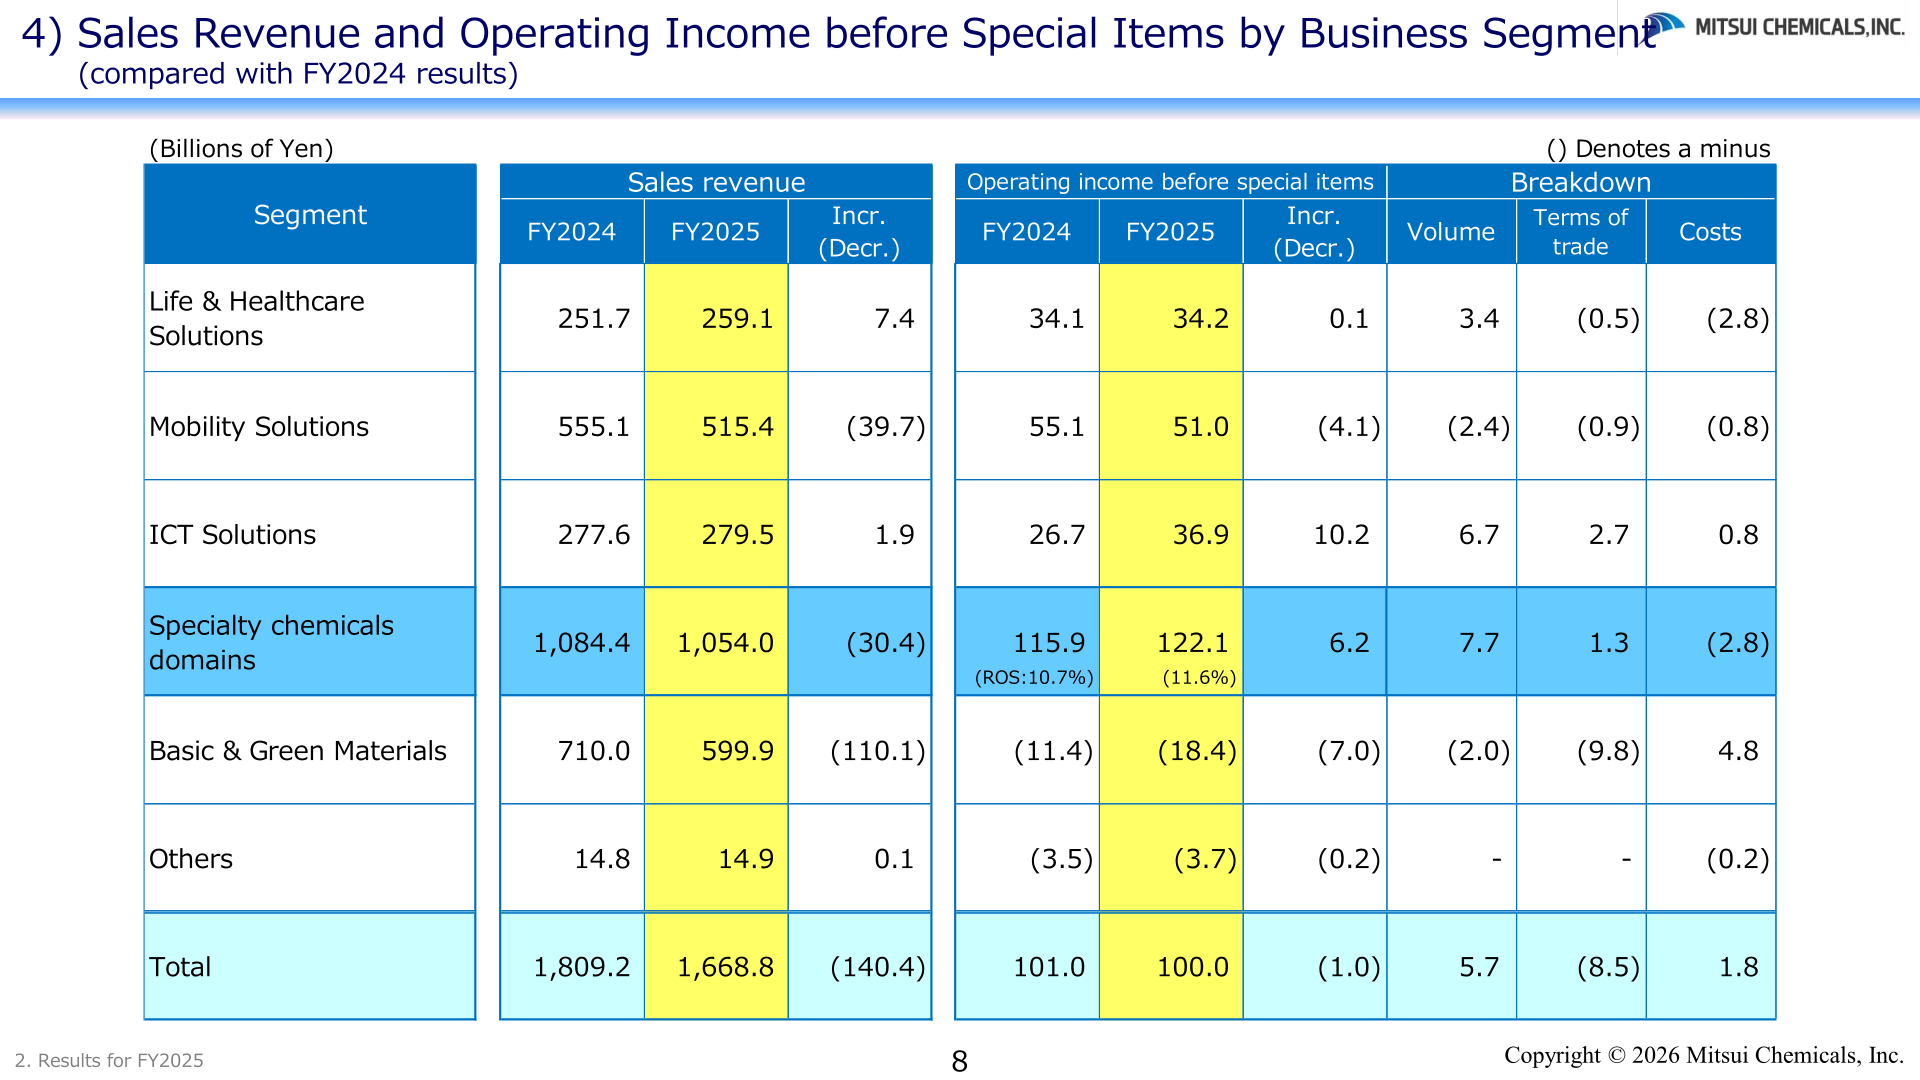
By segment, operating income before special items in Life & Healthcare Solutions was essentially flat at 34.2 billion yen (FY2024: 34.1 billion yen), as firm demand for vision care and agrochemicals was offset by a loss from a gas leakage at Omuta Works. Mobility Solutions declined to 51.0 billion yen (FY2024: 55.1 billion yen), reflecting lower sales volume in composite materials linked to U.S. trade policies, a semiconductor supply shortage, and an aluminum plant fire in the U.S. — the impact of U.S. trade policies alone was approximately (3.0) billion yen. ICT Solutions rose to 36.9 billion yen (FY2024: 26.7 billion yen) on higher sales volume in semiconductor & optical materials, driven by demand growth in the cutting-edge semiconductor market. Basic & Green Materials (B&GM) recorded an operating loss before special items of (18.4) billion yen (FY2024: (11.4) billion yen), due to continued low operating rates at crackers, inventory valuation losses reflecting lower naphtha prices, deteriorating market conditions, and major regular maintenance at Ichihara Works.
| Segment | Sales Revenue FY2024 | Sales Revenue FY2025 | Op. Income before Special Items FY2024 | Op. Income before Special Items FY2025 |
|---|---|---|---|---|
| Life & Healthcare Solutions | 251.7 | 259.1 | 34.1 | 34.2 |
| Mobility Solutions | 555.1 | 515.4 | 55.1 | 51.0 |
| ICT Solutions | 277.6 | 279.5 | 26.7 | 36.9 |
| Specialty chemicals domains | 1,084.4 | 1,054.0 | 115.9 | 122.1 |
| Basic & Green Materials | 710.0 | 599.9 | (11.4) | (18.4) |
| Others | 14.8 | 14.9 | (3.5) | (3.7) |
| Total | 1,809.2 | 1,668.8 | 101.0 | 100.0 |
FY2026 Forecast
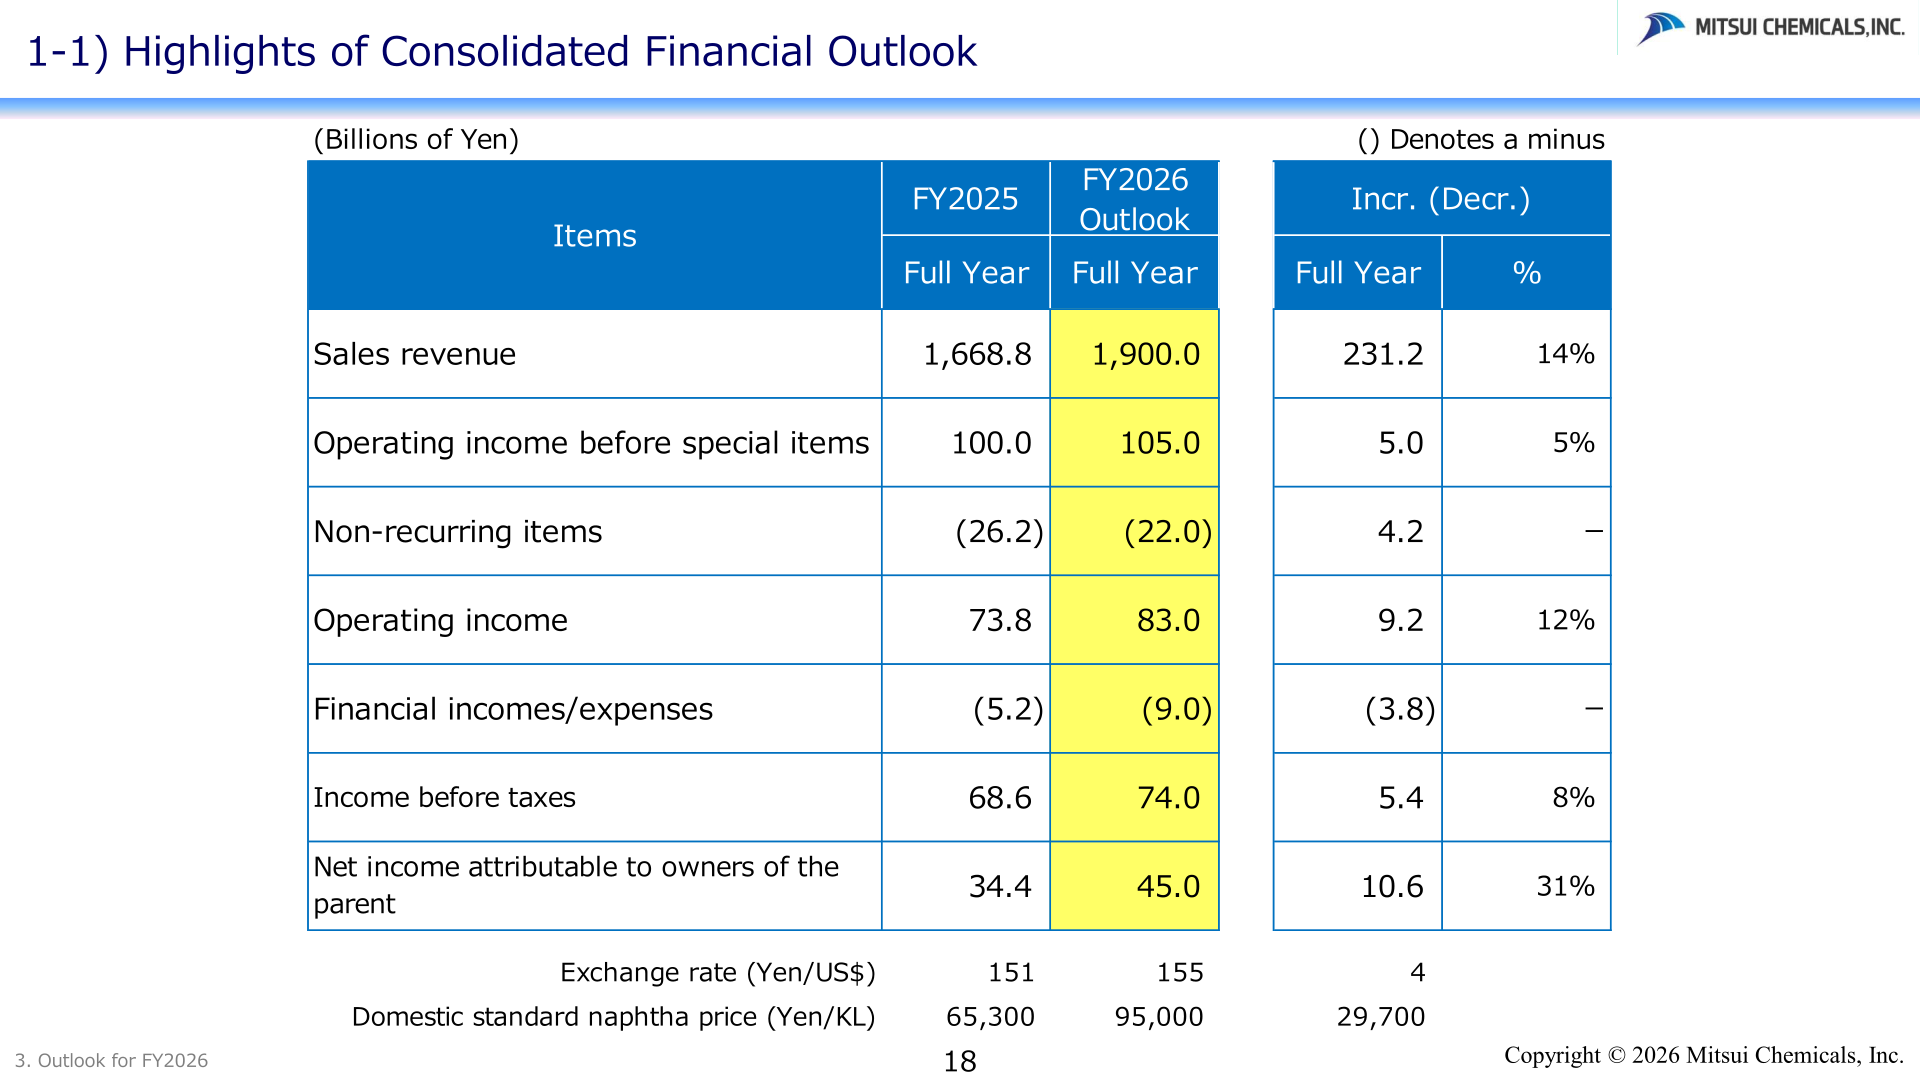
For FY2026, Mitsui Chemicals forecasts consolidated sales revenue of 1,900.0 billion yen, up 231.2 billion yen (+14%) year on year, and operating income before special items of 105.0 billion yen, up 5.0 billion yen (+5%). Net income attributable to owners of the parent is forecast at 45.0 billion yen, up 10.6 billion yen (+31%). The specialty chemicals domains are expected to grow operating income before special items to 130.0 billion yen (+7.9 billion yen, +6%), led by vision care, agrochemicals, elastomers and semiconductor applications, while B&GM is expected to narrow its operating loss before special items to (3.0) billion yen, an improvement of 15.4 billion yen, on the full contribution of restructuring measures and elimination of FY2025 temporary factors. The company estimates a negative impact of approximately 15.0 billion yen from the Middle East conflict in FY2026, reflected mainly in the ‘Others’ segment, due to reduced sales volume from production cutbacks and deteriorating production yields and energy efficiency, mainly in B&GM. Forecast assumptions are an exchange rate of 155 yen/US$ (FY2025: 151 yen/US$) and a domestic standard naphtha price of 95,000 yen/KL (FY2025: 65,300 yen/KL).
| Item | FY2025 (Actual) | FY2026 (Outlook) | Change |
|---|---|---|---|
| Sales revenue | 1,668.8 | 1,900.0 | 231.2 (14%) |
| Operating income before special items | 100.0 | 105.0 | 5.0 (5%) |
| Non-recurring items | (26.2) | (22.0) | 4.2 |
| Operating income (inc. Equity in earnings) | 73.8 | 83.0 | 9.2 (12%) |
| Financial incomes/expenses | (5.2) | (9.0) | (3.8) |
| Income before taxes | 68.6 | 74.0 | 5.4 (8%) |
| Net income attributable to owners of the parent | 34.4 | 45.0 | 10.6 (31%) |
By segment, FY2026 operating income before special items outlook is 38.0 billion yen for Life & Healthcare Solutions (FY2025: 34.2 billion yen), 51.0 billion yen for Mobility Solutions (unchanged from FY2025), 41.0 billion yen for ICT Solutions (FY2025: 36.9 billion yen), and (3.0) billion yen for Basic & Green Materials (FY2025: (18.4) billion yen).
Shareholder Returns
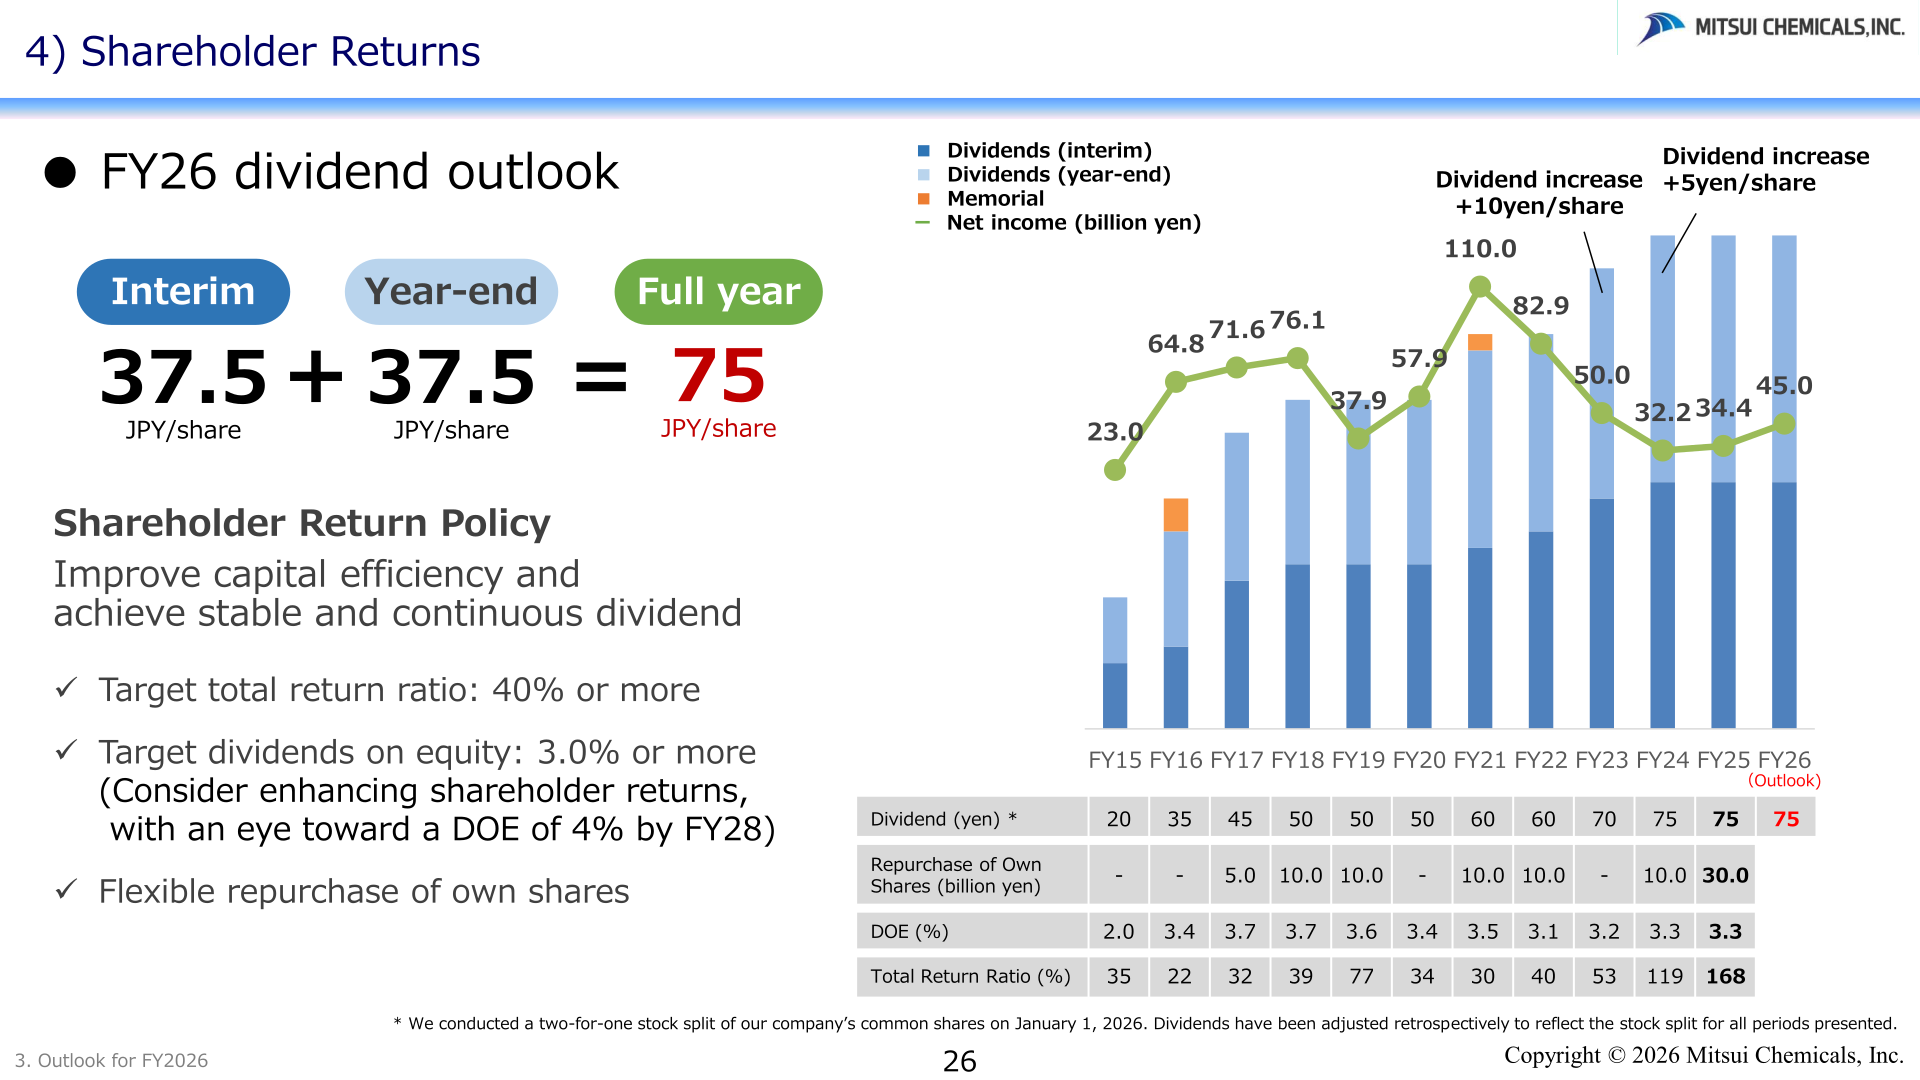
Mitsui Chemicals conducted a two-for-one stock split of its common shares on January 1, 2026; dividend figures have been adjusted retrospectively to reflect the stock split for all periods presented. The FY2025 annual dividend was 75 yen per share, and the FY2026 dividend outlook is also 75 yen per share (interim 37.5 yen + year-end 37.5 yen). FY2025 results show a total return ratio of 168% and a DOE (dividend on equity) of 3.3%; the company repurchased 30.0 billion yen of its own shares in FY2025. The shareholder return policy targets a total return ratio of 40% or more and dividends on equity of 3.0% or more, with consideration of enhancing shareholder returns toward a DOE of 4% by FY2028, alongside flexible repurchase of own shares.
| Item | FY2025 (Actual) | FY2026 (Outlook) |
|---|---|---|
| Annual dividend per share (JPY) | 75 | 75 |
| Interim dividend (JPY/share) | – | 37.5 |
| Year-end dividend (JPY/share) | – | 37.5 |
| Total Return Ratio (%) | 168 | – |
| DOE (%) | 3.3 | – |
| Repurchase of own shares (Billions of Yen) | 30.0 | – |
This article is an analysis based on publicly available information and is not a recommendation to buy or sell any specific securities. Investment decisions are your own responsibility.
![[Obayashi] Investors’ Guide 2026 — The Complete 24-Article Breakdown](https://japan-equity.com/wp-content/uploads/2026/07/hub_cover-1024x1024.png)
![[Obayashi] IR & SR Policy — Feeding Dialogue Back into Management](https://japan-equity.com/wp-content/uploads/2026/07/p32_sq-1024x1024.jpg)
![[Obayashi] Real Estate Development — 18.7% Margin, ¥287.7bn Unrealized Gains](https://japan-equity.com/wp-content/uploads/2026/07/p20_sq-1024x1024.jpg)
![[Obayashi] Domestic Civil Engineering — Resilience Spending Supports 9.6% Margin](https://japan-equity.com/wp-content/uploads/2026/07/p11_sq-1024x1024.jpg)
![[Obayashi] Share Price & External Ratings — vs TOPIX, ESG Index Inclusion](https://japan-equity.com/wp-content/uploads/2026/07/p40_sq-1024x1024.jpg)
![[Construction] ¥75.5tn Investment, Shrinking Workforce — Big-5 Market Share](https://japan-equity.com/wp-content/uploads/2026/07/p12_sq-1024x1024.jpg)



![[Obayashi] Capital Policy & Shareholder Returns — ROE 10%+, DOE ~5%, ¥100bn Buyback](https://japan-equity.com/wp-content/uploads/2026/07/p27_sq-1024x1024.jpg)
![[Obayashi] Reducing Cross-Shareholdings — ¥285.2bn Sold in Five Years](https://japan-equity.com/wp-content/uploads/2026/07/p29_sq-1024x1024.jpg)
![[Obayashi] ¥750bn Investment Plan — ¥300bn to Development, ¥190bn to Tech/DX](https://japan-equity.com/wp-content/uploads/2026/07/p30_sq-1024x1024.jpg)
![[Obayashi] MTP2022 KPIs — Operating Profit ~2x Target, ROE 14.4%](https://japan-equity.com/wp-content/uploads/2026/07/p25_sq-1024x1024.jpg)
![[Obayashi] Cash Allocation — ¥420bn Investment CF Over Five Years](https://japan-equity.com/wp-content/uploads/2026/07/p26_sq-1024x1024.jpg)
![[Obayashi] Green Energy — 44 Plants, 344MW, and the Green Hydrogen Challenge](https://japan-equity.com/wp-content/uploads/2026/07/p21_sq-1024x1024.jpg)
![[Obayashi] Tackling the Labor Shortage — Robotics Construction®](https://japan-equity.com/wp-content/uploads/2026/07/p14_sq-1024x1024.jpg)
