
This article is based on publicly available IR materials and is not a recommendation to buy or sell any specific securities.
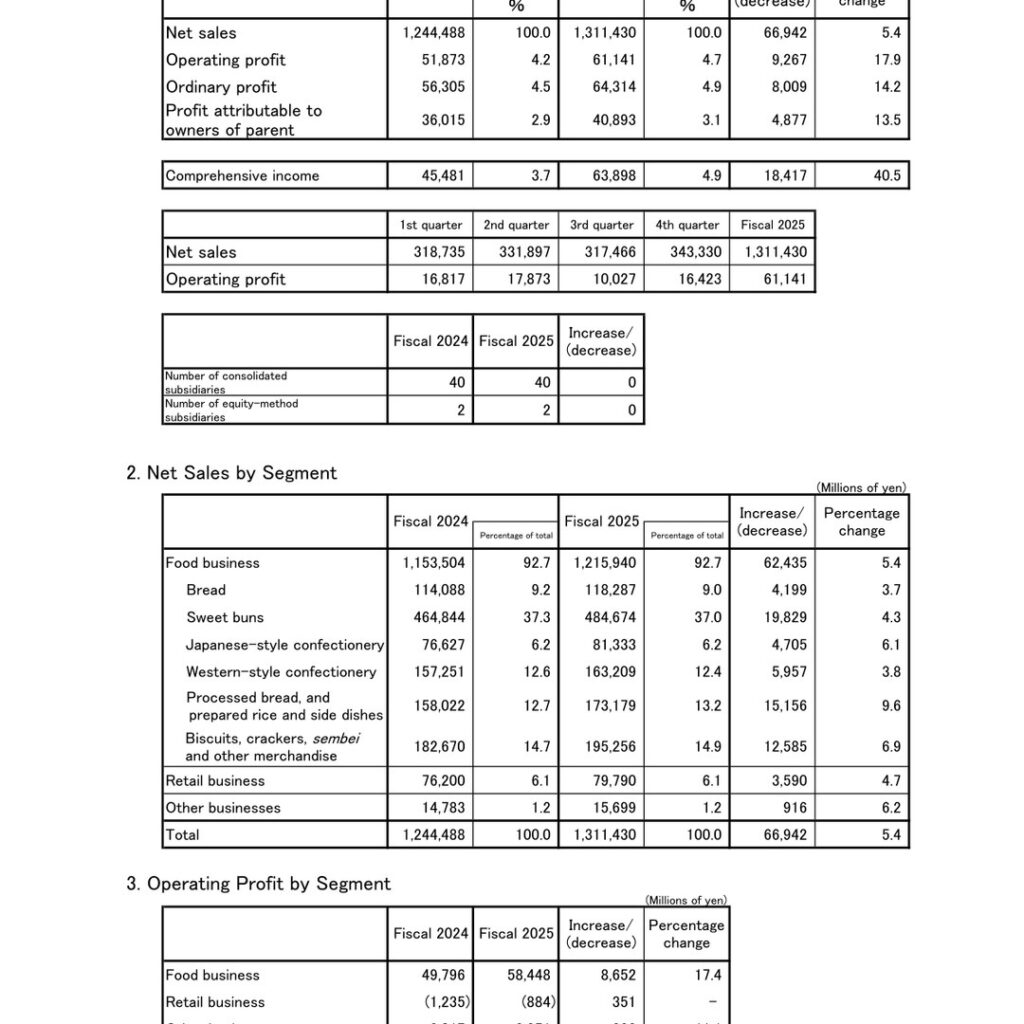
Yamazaki Baking Co., Ltd. has a December fiscal year-end, so FY2025 in this article refers to the fiscal year ended December 31, 2025 — the same “Fiscal 2025” label the company uses in this material. Consolidated net sales rose 5.4% year on year to ¥1,311,430 million, operating profit rose 17.9% to ¥61,141 million, ordinary profit rose 14.2% to ¥64,314 million and profit attributable to owners of parent rose 13.5% to ¥40,893 million. Growth was led by the Food business, where operating profit increased 17.4% to ¥58,448 million. For Fiscal 2026 the company projects net sales of ¥1,338,000 million (+2.0%), operating profit of ¥64,000 million (+4.7%) and profit attributable to owners of parent of ¥42,500 million (+3.9%).
Consolidated Results (Full-Year Actual)
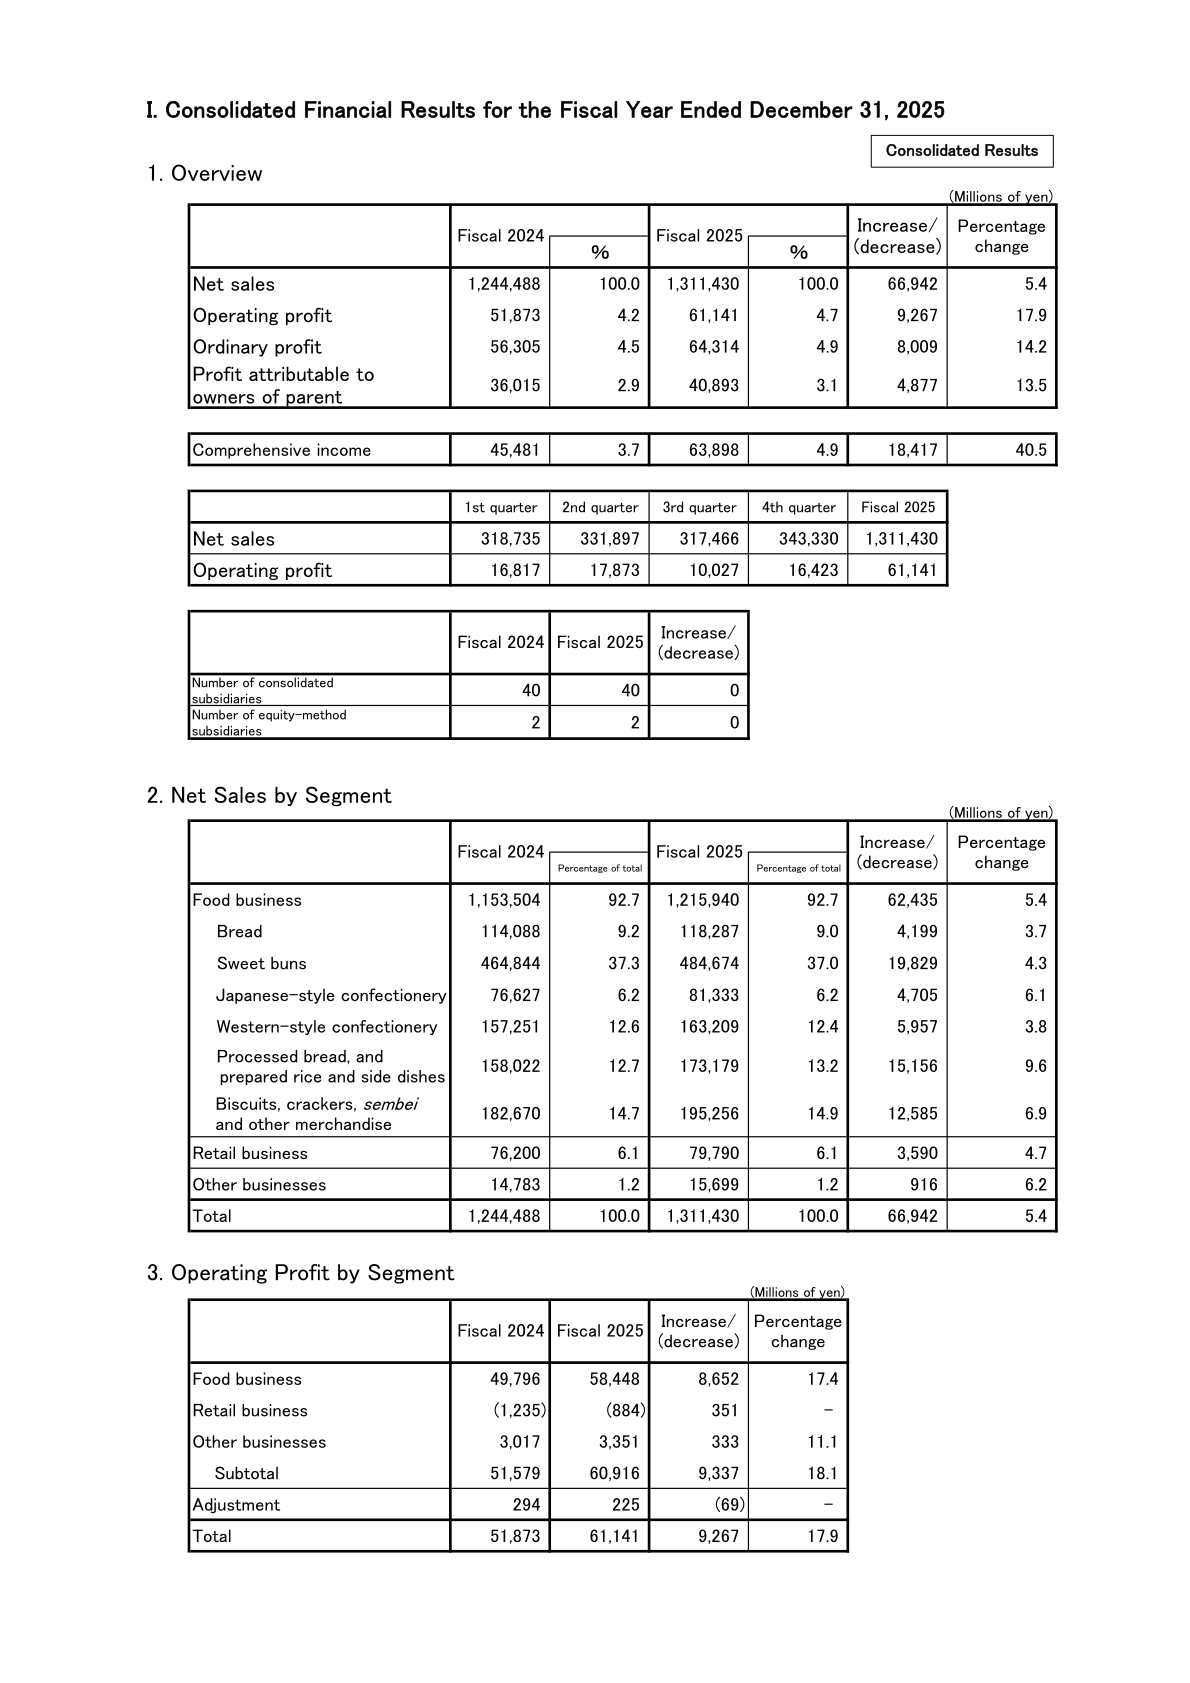
Consolidated net sales for the fiscal year ended December 31, 2025 were ¥1,311,430 million, up ¥66,942 million or 5.4% year on year. Gross profit rose 5.7% to ¥428,404 million, lifting the gross margin to 32.7% from 32.6%, while selling, general and administrative expenses rose 3.9% to ¥367,263 million and fell as a share of sales to 28.0% from 28.4%. Within SG&A, haulage expenses increased ¥3,761 million to ¥75,150 million on higher cargo volume and personnel expenses increased ¥5,317 million to ¥163,767 million on higher salaries and wages. Operating profit rose ¥9,267 million or 17.9% to ¥61,141 million, with the operating margin improving to 4.7% from 4.2%. Ordinary profit rose 14.2% to ¥64,314 million; non-operating income declined 6.7% to ¥5,691 million as foreign exchange gains of ¥927 million in the prior year did not recur, while non-operating expenses rose 51.0% to ¥2,518 million on higher interest expenses of ¥1,470 million relating to foreign currency loans. Extraordinary income fell to ¥1,495 million and extraordinary losses rose to ¥4,241 million, including impairment losses of ¥1,459 million, leaving profit before income taxes at ¥61,569 million (+10.7%). Profit attributable to owners of parent was ¥40,893 million, up 13.5%, and comprehensive income rose 40.5% to ¥63,898 million. By quarter, net sales were ¥318,735 million, ¥331,897 million, ¥317,466 million and ¥343,330 million, and operating profit was ¥16,817 million, ¥17,873 million, ¥10,027 million and ¥16,423 million. The number of consolidated subsidiaries was unchanged at 40 and equity-method subsidiaries at 2.
| Item | FY2025 | FY2024 | Increase/(decrease) | Percentage change |
|---|---|---|---|---|
| Net sales (¥mn) | 1,311,430 | 1,244,488 | 66,942 | 5.4% |
| Gross profit (¥mn) | 428,404 | 405,255 | 23,149 | 5.7% |
| SG&A expenses (¥mn) | 367,263 | 353,381 | 13,881 | 3.9% |
| Operating profit (¥mn) | 61,141 | 51,873 | 9,267 | 17.9% |
| Operating profit margin | 4.7% | 4.2% | — | — |
| Ordinary profit (¥mn) | 64,314 | 56,305 | 8,009 | 14.2% |
| Profit before income taxes (¥mn) | 61,569 | 55,636 | 5,933 | 10.7% |
| Profit attributable to owners of parent (¥mn) | 40,893 | 36,015 | 4,877 | 13.5% |
| Comprehensive income (¥mn) | 63,898 | 45,481 | 18,417 | 40.5% |
Segment Results
The Food business, which accounted for 92.7% of consolidated net sales, posted net sales of ¥1,215,940 million, up ¥62,435 million or 5.4%, and operating profit of ¥58,448 million, up ¥8,652 million or 17.4%. Within the Food business, processed bread, and prepared rice and side dishes grew fastest at 9.6% to ¥173,179 million, followed by biscuits, crackers, sembei and other merchandise at 6.9% to ¥195,256 million and Japanese-style confectionery at 6.1% to ¥81,333 million; sweet buns, the largest category at 37.0% of consolidated sales, rose 4.3% to ¥484,674 million. The Retail business recorded net sales of ¥79,790 million, up 4.7%, and narrowed its operating loss to ¥884 million from ¥1,235 million. Other businesses posted net sales of ¥15,699 million, up 6.2%, and operating profit of ¥3,351 million, up 11.1%. The segment subtotal of operating profit was ¥60,916 million with an adjustment of ¥225 million, giving the consolidated total of ¥61,141 million.
| Segment / Product category | Metric | FY2025 | FY2024 | Percentage change |
|---|---|---|---|---|
| Food business | Net sales (¥mn) | 1,215,940 | 1,153,504 | 5.4% |
| – Bread | Net sales (¥mn) | 118,287 | 114,088 | 3.7% |
| – Sweet buns | Net sales (¥mn) | 484,674 | 464,844 | 4.3% |
| – Japanese-style confectionery | Net sales (¥mn) | 81,333 | 76,627 | 6.1% |
| – Western-style confectionery | Net sales (¥mn) | 163,209 | 157,251 | 3.8% |
| – Processed bread, and prepared rice and side dishes | Net sales (¥mn) | 173,179 | 158,022 | 9.6% |
| – Biscuits, crackers, sembei and other merchandise | Net sales (¥mn) | 195,256 | 182,670 | 6.9% |
| Retail business | Net sales (¥mn) | 79,790 | 76,200 | 4.7% |
| Other businesses | Net sales (¥mn) | 15,699 | 14,783 | 6.2% |
| Total | Net sales (¥mn) | 1,311,430 | 1,244,488 | 5.4% |
| Food business | Operating profit (¥mn) | 58,448 | 49,796 | 17.4% |
| Retail business | Operating profit (¥mn) | (884) | (1,235) | — |
| Other businesses | Operating profit (¥mn) | 3,351 | 3,017 | 11.1% |
| Adjustment | Operating profit (¥mn) | 225 | 294 | — |
| Total | Operating profit (¥mn) | 61,141 | 51,873 | 17.9% |
Major Subsidiaries
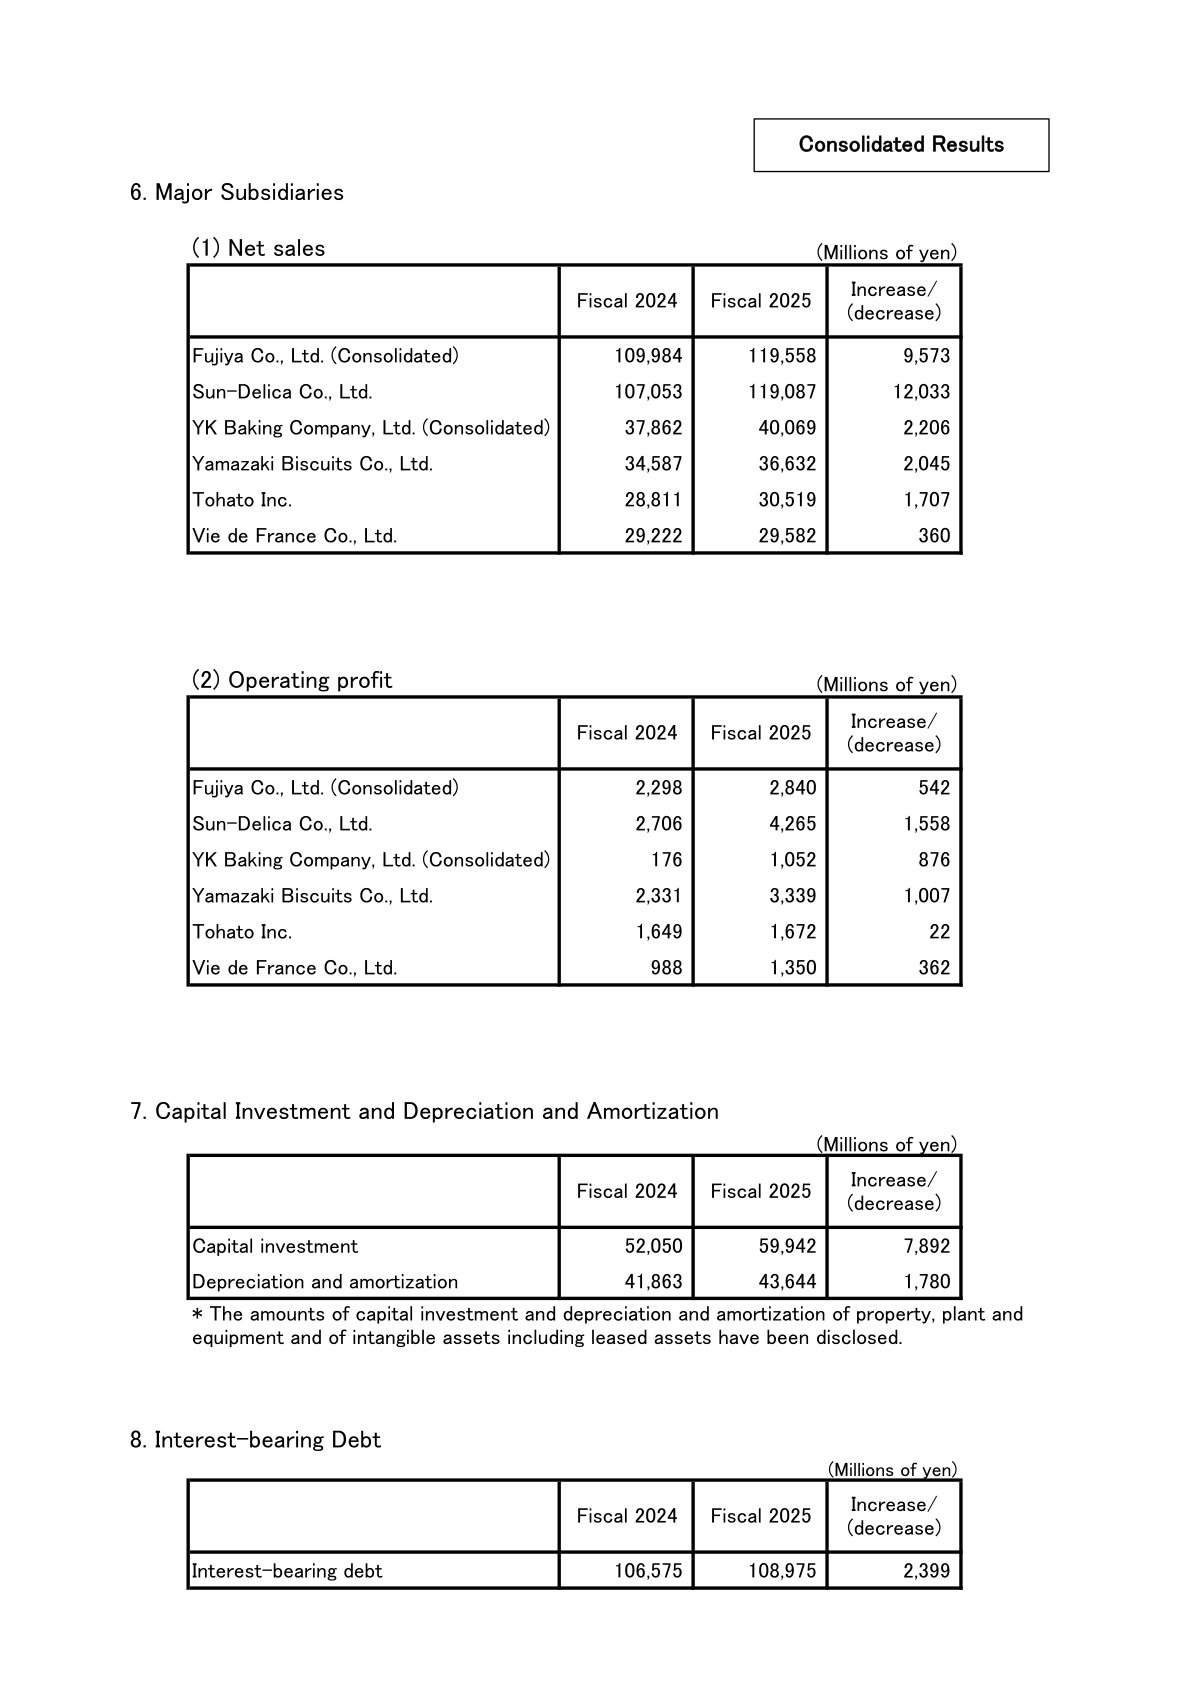
Among the major subsidiaries disclosed, Fujiya Co., Ltd. (consolidated) recorded net sales of ¥119,558 million, up ¥9,573 million, and operating profit of ¥2,840 million, up ¥542 million. Sun-Delica Co., Ltd. posted the largest sales increase, up ¥12,033 million to ¥119,087 million, with operating profit up ¥1,558 million to ¥4,265 million. YK Baking Company, Ltd. (consolidated) lifted operating profit to ¥1,052 million from ¥176 million on net sales of ¥40,069 million, and Yamazaki Biscuits Co., Ltd. raised operating profit ¥1,007 million to ¥3,339 million on net sales of ¥36,632 million. Tohato Inc. reported net sales of ¥30,519 million and operating profit of ¥1,672 million, and Vie de France Co., Ltd. reported net sales of ¥29,582 million and operating profit of ¥1,350 million.
| Company | Net sales FY2025 (¥mn) | Net sales FY2024 (¥mn) | Operating profit FY2025 (¥mn) | Operating profit FY2024 (¥mn) |
|---|---|---|---|---|
| Fujiya Co., Ltd. (Consolidated) | 119,558 | 109,984 | 2,840 | 2,298 |
| Sun-Delica Co., Ltd. | 119,087 | 107,053 | 4,265 | 2,706 |
| YK Baking Company, Ltd. (Consolidated) | 40,069 | 37,862 | 1,052 | 176 |
| Yamazaki Biscuits Co., Ltd. | 36,632 | 34,587 | 3,339 | 2,331 |
| Tohato Inc. | 30,519 | 28,811 | 1,672 | 1,649 |
| Vie de France Co., Ltd. | 29,582 | 29,222 | 1,350 | 988 |
Balance Sheet, Cash Flows and Capital Investment
Total assets increased ¥66,773 million to ¥931,878 million. Cash and deposits rose ¥11,377 million to ¥163,820 million on higher sales and new loans payable, accounts receivable – trade rose ¥8,841 million to ¥149,734 million on higher sales, investment securities rose ¥9,187 million to ¥85,913 million on rises in the price of shares held, and the retirement benefit asset rose ¥20,637 million to ¥53,686 million on improved pension asset management. Total liabilities rose ¥16,432 million to ¥421,050 million, with long-term borrowings up ¥6,929 million to ¥39,303 million and the retirement benefit liability down ¥4,978 million to ¥69,303 million. Total net assets increased ¥50,341 million to ¥510,828 million. Interest-bearing debt rose ¥2,399 million to ¥108,975 million. Cash flows from operating activities were ¥78,870 million (up ¥4,895 million on higher profit before income taxes), cash flows from investing activities were negative ¥55,859 million on increased payments for purchases of property, plant and equipment, and cash flows from financing activities were negative ¥14,126 million, leaving cash and cash equivalents at the end of the period at ¥155,423 million. Capital investment was ¥59,942 million (up ¥7,892 million) against depreciation and amortization of ¥43,644 million (up ¥1,780 million). Group employees totalled 33,545 permanent staff plus an average 21,237 temporary staff. Store counts declined across the retail formats: Daily Yamazaki to 1,251, Fujiya (Western-style confectionery) to 850 and Vie de France to 180.
FY2026 Forecast
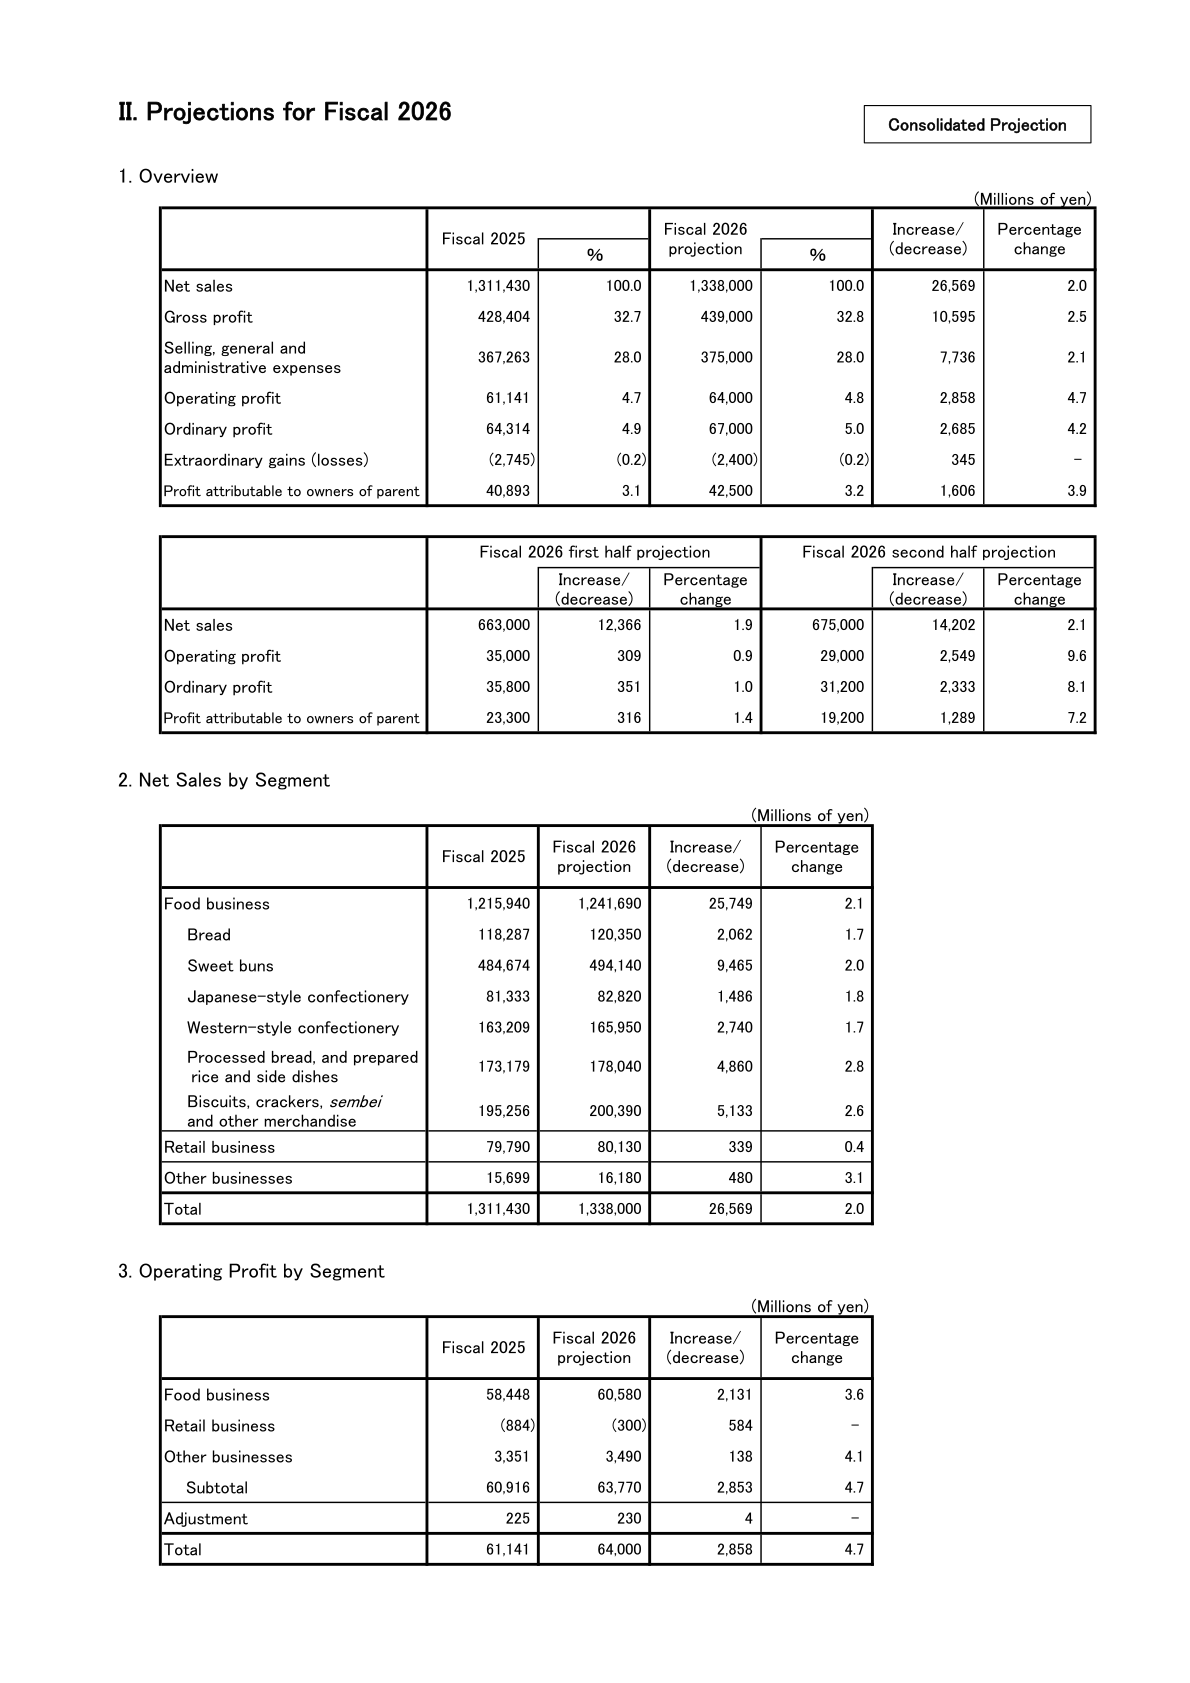
For Fiscal 2026 the company projects consolidated net sales of ¥1,338,000 million, up ¥26,569 million or 2.0%, gross profit of ¥439,000 million (+2.5%, a 32.8% margin) and SG&A expenses of ¥375,000 million (+2.1%). Operating profit is projected at ¥64,000 million, up ¥2,858 million or 4.7%, for a 4.8% margin, with ordinary profit of ¥67,000 million (+4.2%) and profit attributable to owners of parent of ¥42,500 million (+3.9%). Extraordinary losses are assumed to narrow to ¥2,400 million from ¥2,745 million. On a half-year basis, first-half net sales are projected at ¥663,000 million (+1.9%) with operating profit of ¥35,000 million (+0.9%), and second-half net sales at ¥675,000 million (+2.1%) with operating profit of ¥29,000 million (+9.6%). By segment, Food business net sales are projected at ¥1,241,690 million (+2.1%) with operating profit of ¥60,580 million (+3.6%); the Retail business is projected to narrow its operating loss to ¥300 million on net sales of ¥80,130 million; and Other businesses are projected at net sales of ¥16,180 million with operating profit of ¥3,490 million. Capital investment is planned at ¥64,580 million against depreciation and amortization of ¥46,690 million.
| Item | FY2026 projection | FY2025 (actual) | Increase/(decrease) | Percentage change |
|---|---|---|---|---|
| Net sales (¥mn) | 1,338,000 | 1,311,430 | 26,569 | 2.0% |
| Gross profit (¥mn) | 439,000 | 428,404 | 10,595 | 2.5% |
| SG&A expenses (¥mn) | 375,000 | 367,263 | 7,736 | 2.1% |
| Operating profit (¥mn) | 64,000 | 61,141 | 2,858 | 4.7% |
| Ordinary profit (¥mn) | 67,000 | 64,314 | 2,685 | 4.2% |
| Extraordinary gains (losses) (¥mn) | (2,400) | (2,745) | 345 | — |
| Profit attributable to owners of parent (¥mn) | 42,500 | 40,893 | 1,606 | 3.9% |
| Food business – net sales (¥mn) | 1,241,690 | 1,215,940 | 25,749 | 2.1% |
| Retail business – net sales (¥mn) | 80,130 | 79,790 | 339 | 0.4% |
| Other businesses – net sales (¥mn) | 16,180 | 15,699 | 480 | 3.1% |
| Food business – operating profit (¥mn) | 60,580 | 58,448 | 2,131 | 3.6% |
| Retail business – operating profit (¥mn) | (300) | (884) | 584 | — |
| Other businesses – operating profit (¥mn) | 3,490 | 3,351 | 138 | 4.1% |
| Capital investment (¥mn) | 64,580 | 59,942 | 4,637 | — |
| Depreciation and amortization (¥mn) | 46,690 | 43,644 | 3,045 | — |
Non-Consolidated Results and Plan
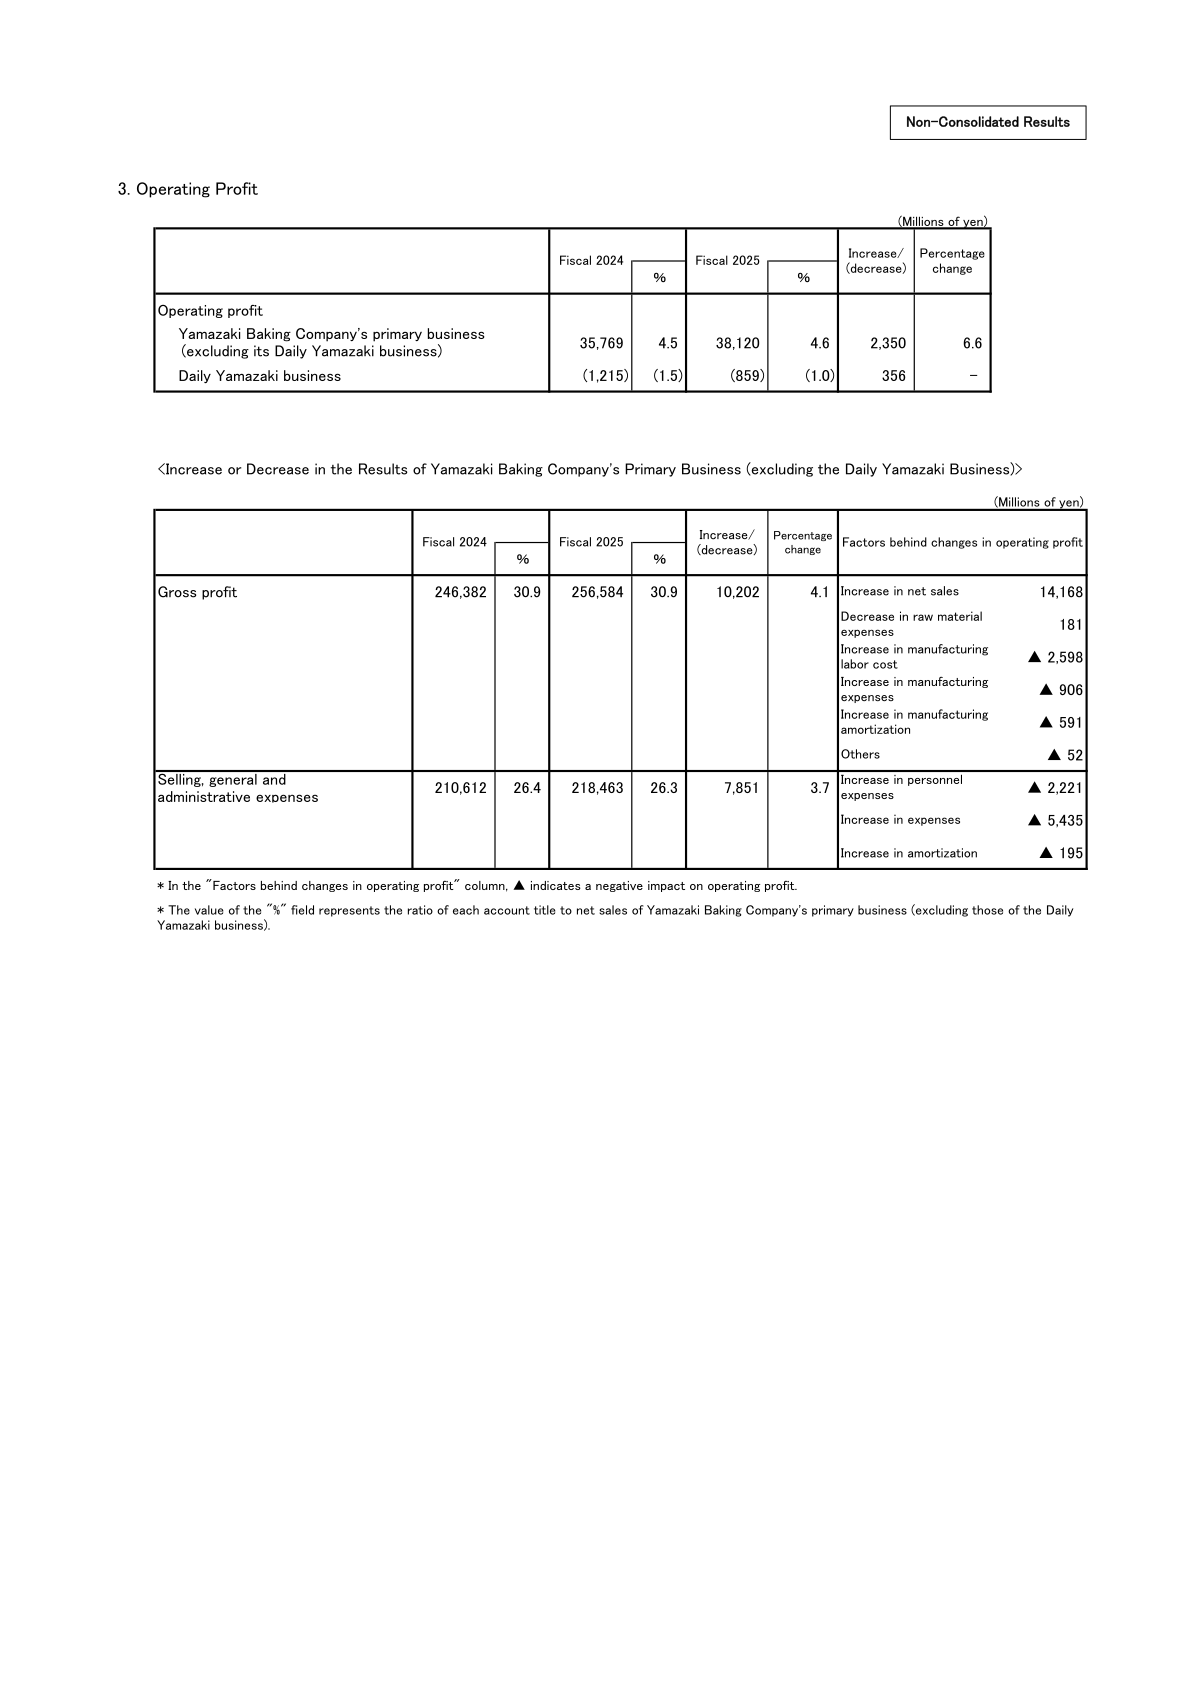
On a non-consolidated basis, Yamazaki Baking Co., Ltd. reported net sales of ¥891,198 million (+4.0%), operating profit of ¥37,261 million (+7.8%), ordinary profit of ¥42,206 million (+5.2%) and profit of ¥30,052 million (+2.0%). Splitting the parent company, the primary business excluding the Daily Yamazaki business earned operating profit of ¥38,120 million (+6.6%), while the Daily Yamazaki business narrowed its operating loss to ¥859 million from ¥1,215 million. For the primary business, gross profit rose ¥10,202 million or 4.1% to ¥256,584 million: the company attributes this to a ¥14,168 million benefit from increased net sales and a ¥181 million benefit from decreased raw material expenses, against negative impacts of ¥2,598 million from increased manufacturing labour cost, ¥906 million from increased manufacturing expenses, ¥591 million from increased manufacturing amortization and ¥52 million from other items. SG&A expenses rose ¥7,851 million or 3.7% to ¥218,463 million, reflecting negative impacts of ¥2,221 million from increased personnel expenses, ¥5,435 million from increased expenses and ¥195 million from increased amortization. For Fiscal 2026 the non-consolidated plan is net sales of ¥907,000 million (+1.8%), operating profit of ¥38,500 million (+3.3%), ordinary profit of ¥43,500 million (+3.1%) and profit of ¥30,700 million (+2.2%).
Shareholder Returns
This material does not cover dividends, share buybacks or any other shareholder return policy. This cannot be confirmed from the materials.
This article is an analysis based on publicly available information and is not a recommendation to buy or sell any specific securities. Investment decisions are your own responsibility.
![[Obayashi] Investors’ Guide 2026 — The Complete 24-Article Breakdown](https://japan-equity.com/wp-content/uploads/2026/07/hub_cover-1024x1024.png)
![[Obayashi] IR & SR Policy — Feeding Dialogue Back into Management](https://japan-equity.com/wp-content/uploads/2026/07/p32_sq-1024x1024.jpg)
![[Obayashi] Real Estate Development — 18.7% Margin, ¥287.7bn Unrealized Gains](https://japan-equity.com/wp-content/uploads/2026/07/p20_sq-1024x1024.jpg)
![[Obayashi] Domestic Civil Engineering — Resilience Spending Supports 9.6% Margin](https://japan-equity.com/wp-content/uploads/2026/07/p11_sq-1024x1024.jpg)
![[Obayashi] Share Price & External Ratings — vs TOPIX, ESG Index Inclusion](https://japan-equity.com/wp-content/uploads/2026/07/p40_sq-1024x1024.jpg)
![[Construction] ¥75.5tn Investment, Shrinking Workforce — Big-5 Market Share](https://japan-equity.com/wp-content/uploads/2026/07/p12_sq-1024x1024.jpg)



![[Obayashi] Capital Policy & Shareholder Returns — ROE 10%+, DOE ~5%, ¥100bn Buyback](https://japan-equity.com/wp-content/uploads/2026/07/p27_sq-1024x1024.jpg)
![[Obayashi] Reducing Cross-Shareholdings — ¥285.2bn Sold in Five Years](https://japan-equity.com/wp-content/uploads/2026/07/p29_sq-1024x1024.jpg)
![[Obayashi] ¥750bn Investment Plan — ¥300bn to Development, ¥190bn to Tech/DX](https://japan-equity.com/wp-content/uploads/2026/07/p30_sq-1024x1024.jpg)
![[Obayashi] MTP2022 KPIs — Operating Profit ~2x Target, ROE 14.4%](https://japan-equity.com/wp-content/uploads/2026/07/p25_sq-1024x1024.jpg)
![[Obayashi] Cash Allocation — ¥420bn Investment CF Over Five Years](https://japan-equity.com/wp-content/uploads/2026/07/p26_sq-1024x1024.jpg)
![[Obayashi] Green Energy — 44 Plants, 344MW, and the Green Hydrogen Challenge](https://japan-equity.com/wp-content/uploads/2026/07/p21_sq-1024x1024.jpg)
![[Obayashi] Tackling the Labor Shortage — Robotics Construction®](https://japan-equity.com/wp-content/uploads/2026/07/p14_sq-1024x1024.jpg)
